

Abstract
Although many studies have explored the neural correlates of visual attention and selection, few have examined the reliability with which neurons represent relevant information. We monitored activity in the frontal eye field (FEF) of monkeys trained to make a saccade to a target defined by the conjunction of color and shape or to a target defined by color differences. The difficulty of conjunction search was manipulated by varying the number of distractors, and the difficulty of feature search was manipulated by varying the similarity in color between target and distractors. The reliability of individual neurons in signaling the target location in correct trials was determined using a neuron—anti-neuron approach within a winner-take-all architecture. On average, approximately seven trials of the activity of single neurons were sufficient to match near-perfect behavioral performance in the easiest search, and ∼14 trials were sufficient in the most difficult search. We also determined how many neurons recorded separately need to be evaluated within a trial to match behavioral performance. Results were quantitatively similar to those of the single neuron analysis. We also found that signal reliability in the FEF did not change with task demands, and overall, behavioral accuracy across the search tasks was approximated when only six trials or neurons were combined. Furthermore, whether combining trials or neurons, the increase in time of target discrimination corresponded to the increase in mean saccade latency across visual search difficulty levels. Finally, the variance of spike counts in the FEF increased as a function of the mean spike count, and the parameters of this relationship did not change with attentional selection.
Keywords: oculomotor, visual cortex, vision, attention, eye movements, selection, model
Neural correlates of visual selection and attention have been observed in nearly all visual and visual-association brain areas that have been examined (Bushnell et al., 1981; Moran and Desimone, 1985; Mountcastle et al., 1987; Motter, 1993; Zipser et al., 1996; Luck et al., 1997; Treue and Maunsell, 1999) (for review, see Desimone and Duncan, 1995; Maunsell, 1995). In a majority of these studies, the average activity of a neuron during one behavioral state was compared with the average activity of the same neuron during another behavioral state. However, it is not clear from these results how reliably neurons signal changes in behavioral state. This is because analyses have usually been confined to average discharge rate in specific time intervals of interest and have not examined the variability in discharges of cortical neurons under identical conditions.
Most analyses of neural reliability have compared the variance of responses with their magnitude (Henry et al., 1973; Tolhurst et al., 1983; Britten et al., 1993; McAdams and Maunsell, 1999), commonly finding that the variance of spike counts is proportional to the mean number of spikes produced by the neuron. Only a few studies have looked at neural reliability from the perspective of how many trials or neurons it takes to reliably convey the pertinent information. One such early study by Tolhurst et al. (1983) found that psychophysical detection of sinusoidal gratings of varying contrast could be approximated by combining the signals of two to eight V1 neurons. More recently, Shadlen et al. (1996) found that a pool of at least 100 weakly correlated neurons in the middle temporal (MT) visual area simulated behavioral responses to visual motion.
In previous studies, we have shown that the frontal eye field (FEF) exhibits the characteristics of a salience map in which stimuli are represented as a function of their behavioral significance (for review, see Bichot, 2001; Thompson et al., 2001). We have shown that activity in this map reflects visual selection based on conspicuousness (Schall et al., 1995; Thompson et al., 1997), as well as selection based on knowledge and experience (Bichot et al., 1996;Bichot and Schall, 1999b; Thompson and Schall, 1999). In this study, we examine the reliability with which the target location is signaled in the FEF in two conceptually different visual search tasks (Treisman and Gelade, 1980): a conjunction visual search in which locating the target required a memory of the target features, and a feature search in which the target was the singleton stimulus. Furthermore, the difficulty (i.e., speed and accuracy) of conjunction search was manipulated by varying the number of distractors, whereas the difficulty of feature search was manipulated by varying the chromatic similarity between target and distractors. We compared neural activity when the target appeared in the response field with neural activity when distractors appeared in the response field within a winner-take-all architecture (i.e., the simulation selected the stimulus that elicited the highest activation). The comparison was performed as a function of time beginning at stimulus presentation; this allowed us to relate the performance of the simulations to saccadic latencies across search difficulty levels, in addition to determining the number of trials from a single neuron and the number of neurons within a single trial that needed to be combined to achieve a rate of target selection similar to the behavioral performance of the monkeys. We also examined neural reliability in the FEF by examining the relationship between spike variance and spike count and evaluated whether this relationship changes with target selection.
MATERIALS AND METHODS
Subjects and physiological procedures. Data were collected from one Macaca mulatta and one Macaca radiata, weighing 9 and 7 kg, respectively. The animals were cared for in accordance with the NIH Guide for the Care and Use of Laboratory Animals and the guidelines of the Vanderbilt Animal Care Committee. The surgical procedures for the subconjunctival implantation of a scleral search coil, for the attachment of a stainless steel post to the skull to restrain the head during testing, and for the craniotomy and the placement of a recording chamber over the FEF have been described previously (Schall et al., 1995; Thompson et al., 1996). All surgical procedures were performed with the use of sterile techniques.
Conjunction search: stimuli, apparatus, and behavioral procedure. The experiments were under the control of two PC computers using software developed by Reflective Computing (St. Louis, MO), which presented the stimuli, recorded action potentials, and eye movements sampled at 1 kHz and 250 Hz, respectively, and delivered the juice reward. Monkeys were seated in an enclosed chair within a magnetic field to monitor eye position with a scleral search coil. Stimuli were presented on a video monitor (70 Hz non-interlace, 800 × 600 resolution) viewed binocularly at a distance of 57 cm in a dark room. The background was uniform dark gray, and the fixation spot was a white square. The stimuli were either red [Commission Internationale d'Éclairage (CIE), x = 621, y = 345] or green (CIE, x = 279,y = 615) matched for luminance (2.3 cd/m2) and could be either crosses or circles.
Each experimental session started with a block of ∼150 detection trials that instructed monkeys what the target would be in conjunction search trials for that session. The target stimulus was a combination of one of two colors (red or green) with one of two shapes (cross or circle). Each detection trial began with the presentation of a central fixation point. After an interval of fixation (∼500 msec), the target stimulus for the session was presented, and monkeys were rewarded for making a single saccade to it.
The procedure for conjunction search trials was essentially the same as for the detection trials except that the target was presented among three or five distractors. In the four-stimulus configuration (Fig.1A), the target was presented along with a distractor that had the target color but not the target shape, another distractor that had the target shape but not the target color, and a distractor that had neither the target color nor the target shape. In the six-stimulus display (Fig.1B), there was an additional distractor that shared the target color and an additional distractor that shared the target shape. With these choices, both displays were balanced for the number of stimuli containing any given color or shape. The stimuli, spaced evenly on the circumference of an imaginary circle around fixation, were placed such that one stimulus always fell in the center of the receptive field of the neuron. On average, monkeys ran ∼600 conjunction search trials while recordings were made from each neuron.
Fig. 1.

Behavioral tasks. The monkey's task was to shift gaze to a target stimulus during conjunction search with four (A) or six (B) stimuli, or a feature search with the target easy (C) or difficult (D) to discriminate from distractors. The discrimination in the difficult feature search was more difficult than depicted schematically in D.Dotted circles represent the monkey's current point of fixation; the arrow represents the saccade to the target. Stimuli are not drawn to scale.
Easy and difficult feature search: stimuli, apparatus, and behavioral procedure. Procedures for the feature search experiments were similar to those for the conjunction search experiments. The experiments were under the control of a PDP/11 computer. In the easy feature search condition (Fig. 1C), a green target (CIE, x = 283, y = 612) was presented among seven red distractors (CIE, x = 655, y = 327). In the difficult feature search condition (Fig. 1D), the distractors were green/yellow (CIE, x = 363, y = 552). In both conditions, the target and distractors were filled squares spaced evenly on the circumference of an imaginary circle around fixation and were matched for luminance (11.1 cd/m2). Easy and difficult feature search trials were randomly interleaved. On average, monkeys ran ∼700 feature search trials while recordings were made from each neuron.
Neuron-by-neuron reliability analysis. First, the spike density function for each correct trial was generated by convolving action potentials with a function that resembled a postsynaptic potential: A(t) = [1 − exp(−t/τg)][exp(−t/τd)]. Physiological data from excitatory synapses estimate the growth constant τg at ∼1 msec and the decay constant τd at ∼20 msec (Sayer et al., 1990).
For each neuron, we determined the number of trials that needed to be combined to match near-perfect performance as follows. Every 10 msec starting at the time of stimulus presentation, we calculated the activity of the neuron averaged over a 10 msec period (from 5 msec before to 5 msec after). Nonoverlapping intervals of 10 msec were used because they allowed for a sensitive estimate of the time course of neural modulation while reducing the noise in the data and the number of data points over which reliability calculations were performed. At each time point, we compared trials in which the target was in the response field of the neuron (i.e., target-activity trial) with trials in which a distractor was in its response field (distractor-activity trial). For every iteration, we randomly selected a target-activity trial and one distractor-activity trial for each of the different types of distractors. Thus, during conjunction search with four stimuli, we selected and compared one trial in response to the target, one in response to the distractor that shared the target color, one in response to the distractor that shared the target shape, and one in response to the distractor that shared no target feature. During conjunction search with six stimuli, we applied the same procedure except that two additional trials were selected, one for each of the additional distractors in the search array that shared a target feature. In other words, for each iteration we selected one trial for each stimulus location in the array. During feature search, because all distractors were the same within a difficulty level, we randomly selected and compared one target-activity trial and seven distractor-activity trials. We then identified the trial with the maximum activity. If it was a target-activity trial, we added one to a “target behavioral choice” count; otherwise, we added one to a “distractor behavioral choice” count. This procedure was repeated for 1000 iterations with trials selected with replacement and independently on each iteration. We then calculated, adjusting for ties, the percentage of iterations in which a target behavioral choice was made. This measure represented the percentage of target choices derived from the activity of the neuron during one trial.
We repeated the same procedure combining the activity of 2–50 trials at each stimulus location. In other words, for each stimulus type and each iteration, we randomly selected with replacement a fixed number of trials in response to that particular stimulus, summed their activity, and found the stimulus that elicited the highest combined activation. The rest of the calculations were identical to the one-trial case described above. We then plotted the probability of target choice as a function of the number of combined trials for each stimulus, and fit the points using Matlab software (The MathWorks, Natick, MA) with an exponential function of the form P(Target) = α + βexp[γ(N − δ)], whereP(Target) is the percentage of target choice by the simulation (a number between 0 and 100%, inclusive), Nis the number of combined trials, and α, β, γ, and δ are the fitting parameters. This function was applied with no theoretical basis but only to quantify the relationship. From the equation of the best-fit curve, we determined the number of trials needed to match behavioral performance as the number required to reach a target choice of 95%. Although we only considered correctly performed trials in the simulations, a fixed criterion of 95% was chosen to approximate the actual rate of target choice for several reasons. First, the α parameter for the exponential fits was bound at 0 and 100% because the actual target choice percentage is bound by these values. Second, this allowed selection reliability to be measured as a function of the number of combined trials at enough time points to reliably characterize the time course of target selection as described below. Finally, as mentioned in Discussion, from the measurements performed one can extrapolate the number of trials that would be required to match perfect performance. We refer to the 95% criterion level as “near-perfect” performance.
Finally, we plotted the number of trials that needed to be combined to reach the criterion level as a function of time from stimulus presentation, and fit the points at which behavior could be matched by a finite number of trials with an exponential function of the formTcrit = α + βexp[γ(t − δ)], whereTcrit is the number of combined trials needed to reach criterion, t is time from stimulus presentation, and α, β, γ, and δ are the fitting parameters. This equation was used for quantification purposes only and does not make any claims about the nature and properties of the dynamics of the selection process. We used the α parameter to describe the number of trials that needed to be combined when the activity of the neuron reached a steady state and the δ parameter to represent the time of beginning of target discrimination. This time is obviously related to but is technically different from the time of target discrimination ofThompson et al. (1996).
Population reliability analysis. This analysis was similar to that of the neuron-by-neuron reliability analysis described above except that instead of combining the activity from an increasing number of trials drawn from the activity of a single neuron, we combined the activity of an increasing number of neurons. For example, in the two-neuron case, for each iteration we randomly selected two neurons that each contributed one randomly selected trial to a pooled response for each of the stimulus types. We then compared the pooled responses to determine the stimulus that elicited the highest pooled response. Again, we repeated this procedure for 1000 iterations for each number of pooled neurons, and neurons were selected independently across iterations. This analysis was performed with or without redundant sampling. With redundant sampling, we selected neurons entirely randomly, and a neuron could be selected more than once. Thus, when the simulation combined the activity of Nneurons on a given iteration, the N neurons were not necessarily all different from one another. Without redundant sampling, the simulation selected neurons pseudorandomly such that a single neuron could be sampled only once.
Relationship between spike variance and spike count.Analyses were conducted in two predetermined time intervals, the first intended to capture activity before neurons discriminated the target from distractors (0–100 msec after stimulus presentation), and the second intended to capture activity while the neurons discriminated the target from distractors (100–0 msec before saccade initiation). These intervals were chosen based on our measurements of the time course of target selection in the FEF in this study, as well as previous findings (Schall et al., 1995; Thompson et al., 1996). During each 100 msec interval, we determined for each neuron and for each visual search condition the mean number of spikes generated across trials and the variance associated with this mean spike count. Analyses were conducted separately for the target in the response field of a neuron and distractors in the response field of a neuron to determine whether target selection affected the relationship between spike variance and spike count. Response variance functions were obtained by fitting the logarithm of the spike variance against the logarithm of the mean spike count with a simple linear regression. When plotted on logarithmic axes, the best-fit straight line is represented by a power function of the form Variance =c(Count)p, where p is the power (or slope) and c is the coefficient (or intercept). In each interval, the simple linear regressions when the target was in the response field and when the distractors were in the response field were compared using a procedure outlined in Zar (1999). When the fit parameters did not differ significantly, we derived an overall response variance function by computing a common slope and a common intercept.
RESULTS
Conjunction search
Overall, monkeys performed conjunction search more efficiently when the target was presented among three distractors than when the target was presented among five distractors. The difference in search difficulty was reflected in both the monkeys' error rates (four-stimulus: 7.5 ± 1.1% mean ± SEM; six-stimulus: 12.8 ± 1.5%; t44 = 8.2;p < 0.001) and saccade latencies during correct trials (four-stimulus: 216.7 ± 2.7 msec; six-stimulus: 230.2 ± 2.9 msec; t44 = 8.4, p < 0.001) [also see Bichot and Schall (1999a)].
Reliability across trials
We recorded from a total of 62 neurons during conjunction search, of which 45 showed significant task-related modulation and provided sufficient data for the analyses presented in this paper. All of these neurons were recorded during separate sessions.
Most single-neuron studies of visual selection and attention have compared the average activity of a neuron across trials during one behavioral state with the average activity of the same neuron across trials during another behavioral state. Thus, we first examined neural reliability in the FEF from this perspective, with the underlying assumption that there are many neurons that would respond on any particular trial in a way that is represented by the ensemble of responses recorded for a given neuron over many trials. The computations of the reliability of signaling the target location for one FEF neuron during conjunction search with both four and six stimuli are shown in Figure 2. This neuron responded to the presentation of the search array with a visual response latency of ∼75 msec, and the initial response did not discriminate target from distractors in the response field during search with either set size (Fig. 2A). However, over time, the activity evolved to discriminate the target from distractors as evidenced by an attenuation of the activity evoked by distractors relative to the activity evoked by the target in the response field. Note also that the discrimination during search with four stimuli started earlier and reached a larger difference between target and distractor activation.
Fig. 2.

Reliability of target selection by an FEF neuron during conjunction search. A, Spike density function of the neuron when the target (thick lines) or distractors (thin lines) of the search array fell in its receptive field during conjunction search with four (solid lines) or six (dashed lines) stimuli. Spike density functions were aligned on stimulus presentation at time 0 and are plotted up to the mean saccade latency during each search condition. Only spikes that occurred before saccade initiation were used in the calculations.B–E, Probability of target choice as a function of number of trials combined by the simulation at the four different time points shown between A and B.Filled circles represent simulations for search with four stimuli, and open circles represent simulations for search with six stimuli. The number of trials needed to reach a fixed criterion level (i.e., 95% indicated by dotted line) was determined by fitting exponential functions to the data points.F, The number of trials required to reach the criterion level is shown as a function of time from stimulus presentation for search with four (●) and six (○) stimuli. The best-fit exponential curves are shown overlaid on the data points. The absence of data points signifies that the number of combined trials needed to result in a target choice probability that matched the criterion level was indeterminate (e.g., both curves in B and the curve for search with six stimuli in C).
In Figure 2, we plot the average activation related to the three different distractor types (i.e., same color, same shape, or opposite the target) for illustration purposes. However, the reliability calculations considered activity related to each of the three distractor types separately. This is critical during conjunction search because activity related to each distractor type was not the same but depended on the similarity of a particular distractor to the target and whether the distractor was the target during the previous recording session (Bichot and Schall, 1999b). Thus, comparisons of activations for the target and each distractor separately are not equivalent to a comparison between activation for the target and the average activation for all distractors combined. For example, consider a case in which the target is presented among two distractors, one nearly identical to the target and the other very different from the target. Suppose that the activation related to the similar distractor is nearly identical to the activation related to the target, whereas the activation related to the other distractor is much less than for either the target or the similar distractor. While a three-way comparison between the activation for each stimulus by our simulations would lead to selection of the target and the similar distractor on almost every iteration and with nearly equal probability (i.e., target selection rate would be near chance as expected behaviorally), comparing target activation with average distractor activation would erroneously lead to much higher rates of target selection. Moreover, evaluating each display stimulus separately is clearly more plausible because information about which stimulus locations contain distractors is not available to the brain until the selection process is completed.
The reliability calculations at four different time points are shown in Figure 2B–E. At 90 msec after search array presentation, the neuron has started responding to the stimuli but its activity is about the same for either the target or distractors in its response field during search with either set size. Accordingly, the simulation shows that the probability of selecting the target does not increase dramatically as a function of the number of summed and compared trials related to each display stimulus, and never reaches the near-perfect criterion level of 95% (Fig. 2B). This lack of ability to discriminate at the criterion level is reflected in Figure 2F by the absence of data points for either set size (i.e., no number of combined trials was sufficient to reach criterion). Later in the trial, 120 msec after stimulus presentation, the activity of the neuron is greater for the target than for distractors in its response field for the four-element display but not the six-element display. The neural selectivity at this time during presentation of the four-element display results in a considerable increase of the probability of target choice as more trials are combined by the simulation (Fig. 2C). The criterion level of target choice probability was reached when ∼14 trials were combined for each element in the four-element search array as shown in Figure2F. In contrast, at this time after presentation of the six-element array, the increase of target choice probability with increasing number of combined trials remained small and never reached the criterion level. After another 10 msec, the activity of the neuron discriminated the target even better in the four-element display, and it also started discriminating the target from distractors in the six-element display. The increase in selectivity during presentation of the four-element display is reflected in the sharper increase of the target choice probability function (Fig. 2D), which reached criterion with approximately five combined trials per display stimulus (Fig. 2F). The emergence of selectivity during presentation of the six-element display is reflected in the more substantial increase of the target choice probability function, which reached criterion with ∼35 combined trials per display stimulus. Finally, 160 msec after stimulus presentation, the neuron signaled very reliably the target of both size arrays, as shown by the rapidly increasing target choice probability functions in Figure2E. The criterion level was reached with slightly more than one trial for the four-element display and slightly more than three trials for the six-element display (Fig.2F).
The number of combined trials necessary to reach the criterion level is plotted in Figure 2F as a function of time from the presentation of the search array; the data points were fit with an exponential function (see Materials and Methods). These plots show that the time at which target discrimination first occurs at criterion level is earlier for search with four stimuli than for search with six stimuli (120 and 130 msec, respectively). This time, henceforth referred to as the time of target discrimination, was estimated at 111 msec for search with four stimuli and 127 msec for search with six stimuli from the equations of the exponential functions. The mean saccade latencies in these two conditions during recordings from this neuron were of 177 and 190 msec, respectively. Furthermore, during search with either set size, the reliability of the neuron improved as time progressed until it reached an asymptote. This level was estimated at 1.4 trials to reach criterion during search with four stimuli and 3.0 trials during search with six stimuli.
The measurements of reliability and time of target discrimination for the 45 neurons analyzed during conjunction search are summarized in Figure 3. The average number of trials that needed to be combined to reach the criterion level when the reliability of selection reached an asymptote was significantly less during the four-item search than during the six-item search (8.1 ± 0.8 vs 10.2 ± 0.9 trials; t44= 2.7; p < 0.01) (Fig. 3A). However, the correlation between the difference in trials to criterion and the difference in error rates across these two conditions was not significant (correlation coefficient r = 0.08;p > 0.05).
Fig. 3.

Summary of neuron-by neuron analysis during conjunction search. A, Distribution of the number of trials needed to reach the near-perfect performance criterion (95% target choice) when the quality of neural selection reached an asymptote. B, Distribution of the time at which neurons began to discriminate the target from distractors at the near-perfect criterion level. In both plots, gray bars represent data from conjunction search with four stimuli, and black bars represent data from conjunction search with six stimuli. The arrowheads under the abscissa mark the average of each distribution.
The average time of target discrimination determined from the exponential fit function was significantly earlier during search with four stimuli than during search with six stimuli (140.7 ± 3.6 vs 153.2 ± 3.2 msec; t44 = 5.5;p < 0.001) (Fig. 3B). The difference in the time of target discrimination (12.5 msec) accounted for the difference in mean saccade latencies in these two conditions (13.5 msec) (t44 = 0.4; p > 0.1), and the correlation between the difference in discrimination time and the difference in mean saccade latency across neurons was marginally significant (correlation coefficient r = 0.30;p < 0.05). We also compared the time of target discrimination estimated from the exponential fits with the time of target discrimination measured as the first time point at which discrimination occurred at criterion level (e.g., 120 and 130 msec for the neuron in Fig. 2 during search with four and six stimuli, respectively). The mean time of target discrimination was not significantly different when measured with either method during search with four stimuli (140.7 vs 142.7 msec; Wilcoxon signed ranks test:z = 1.6; p > 0.05) and search with six stimuli (153.2 vs 154.0 msec; z = 1.3;p > 0.05). However, the estimates of the time of target discrimination based on the exponential fits have the advantage of being continuous and more precise than the discrete (10 msec precision) estimates obtained with the alternative method. For this reason, we opted to use estimates of target discrimination time based on the exponential fit.
Reliability across neurons
The neuron-by-neuron analysis described above has clearly been useful in describing the relationship between behavior and neural activity. However, it is only a convenient approximation of the actual processing by the brain whereby the activity of multiple neurons over a single trial must be combined to make decisions. We evaluated whether the single-neuron—multiple-trial approach and the multiple-neuron—single-trial approach are computationally equivalent. Thus, we also measured neural reliability in the FEF during conjunction search by combining and comparing the activity of different neurons (Fig. 4). The results of the analysis in which a particular neuron could be selected more than once in a given iteration (i.e., with redundancy) are shown in Figure4A. The superimposed curves of target choice probability as a function of the number of combined neurons derived at each 10 msec interval after stimulus presentation are shown for conjunction search with four stimuli in Figure 4A1and for conjunction search with six stimuli in Figure4A2. Early in the trials when neural activity across the population was approximately the same whether the target or a distractor fell in the response field of the neurons, the target choice probability functions were nearly flat and ∼25% for search with four stimuli and ∼17% for search with six stimuli. These values correspond to the chance probability of choosing randomly one stimulus of four and one stimulus of six, respectively. As time progressed and target selection took place, the curves reached an asymptote sooner and at a higher level. Note that when the target was fully selected, the curves easily reached 100% target choice percentage.
Fig. 4.

Population analysis of selection reliability in the FEF during conjunction search. A3, The number of neurons required to reach the near-perfect performance criterion (95% target choice) is plotted as a function of time from stimulus presentation during search with four stimuli (●) and search with six stimuli (○). These values were derived from the curves of target choice probability as a function of the number of neurons the activity of which was combined by the simulation shown in the top inset for search with four stimuli (A1) and in the bottom inset for search with six stimuli (A2). These insets plot target choice probability as a function of the number of neurons contributing activity. The plots for successive times are superimposed, and these families of curves show the progression of selection reliability as in Figure 2B-E. In these simulations, neurons were selected with redundancy, entirely randomly on each iteration, resulting in the possibility that a given neuron was selected more than once (see Materials and Methods). B, Same asA except that neurons were chosen without redundancy and pseudorandomly on each iteration so that each neuron was not selected more than once.
The evolution of the reliability of the neural selection signals in the FEF during conjunction search is shown in Figure 4A3. At each time point, we determined the number of neurons that were needed to contribute activity for target choice probability to reach the criterion level of 95%. Early in the trials, the criterion level could not be reached during either search condition with any number of combined neurons. The beginning of target discrimination at criterion level was estimated at 132.4 msec for search with four stimuli and 143.9 msec for search with six stimuli. After a transition period that lasted ∼30–40 msec in both conditions, neural reliability reached an asymptote at a level that was estimated at 7.8 neurons for search with four stimuli and 10.3 neurons for search with six stimuli.
The results of the analysis without redundancy in which a particular neuron could only be selected once in a given iteration are shown in Figure 4B. Results were similar to those of the previous analysis, with an estimated time of target discrimination of 131.3 msec for search with four stimuli and 143.0 msec for search with six stimuli. The asymptotic neural reliability was estimated at 8.2 neurons for search with four stimuli and 10.4 neurons for search with six stimuli.
Feature search
Overall, monkeys performed feature search more efficiently when the target and distractors were of very different colors (i.e., green vs red) than when the target and distractors were of similar colors (i.e., green vs green/yellow). The difference in search difficulty was reflected in both the monkeys' error rates (easy: 6.1 ± 0.8%; difficult: 29.8 ± 0.9%; t49 = 25.5; p < 0.001) and saccade latencies during correct trials (easy: 200.1 ± 2.9 msec; difficult: 246.4 ± 4.8 msec; t49 = 17.7; p < 0.001).
Reliability across trials
We recorded from a total of 80 neurons during feature search, of which 50 showed significant task-related modulation and provided sufficient data for the analyses presented in this paper. Twelve neurons were recorded in separate sessions, two neurons were recorded simultaneously in 10 sessions, three neurons were recorded simultaneously in 2 sessions, and four neurons were recorded simultaneously in 3 sessions. None of these neurons was also recorded during conjunction search.
The computations of target location signaling reliability for one FEF neuron during feature search in both the easy and difficult conditions are shown in Figure 5. This neuron responded to the presentation of the search array with a latency of ∼50 msec, and the initial response did not discriminate target from distractors in the response field during search of either difficulty level (Fig. 5A). However, over time, the activity evolved to discriminate the target from distractors as evidenced by an attenuation of the activity related to distractors relative to the activity related to the target in the response field. Note also that the discrimination during easy search appears to start earlier and reach a greater magnitude than it does during difficult search.
Fig. 5.

Reliability of target selection by an FEF neuron during feature search. A, Spike density function of the neuron when the target (thick lines) or distractors (thin lines) of the search array fell in its receptive field during easy (solid lines) or difficult (dashed lines) feature search.B–F, Reliability calculations during easy search are represented by ●, and calculations during difficult search are represented by ○. All other conventions are as in Figure3.
The reliability calculations at four different time points (i.e., 60, 100, 120, and 180 msec) are shown in Figure5B–E. The results of these computations are similar to those described for the neuron in Figure 2. During easy search, target choice probability did not reach the criterion level during the initial response (Fig. 5B) but did so as time progressed (Fig. 5C–E). During difficult search, the neural discrimination process took longer with the target choice probability function not reaching the criterion level for the first two time points (Fig. 5B,C), and when it did for later time points, it reached the criterion level with more combined trials than during easy search (Fig.5D,E). The plot of the number of trials needed to reach the criterion level as a function of time after the presentation of the search array (Fig. 5F) shows that the time of target discrimination occurred earlier for easy search (estimated at 105 msec) than for difficult search (estimated at 124 msec). The mean saccade latencies in these two conditions during recordings from this neuron were 182 and 214 msec, respectively. Furthermore, during both easy and difficult search, the reliability of the neuron improved as time progressed until it reached an asymptote. This level was estimated at 1.8 trials to reach criterion during easy search and at 3.8 trials to reach criterion during difficult search.
The measurements of reliability and time of target discrimination for the 50 neurons analyzed during feature search are summarized in Figure 6. The average number of trials that needed to be combined to reach criterion level when neurons reached a steady state was significantly less during easy search than during difficult search (7.3 ± 0.8 vs 14.1 ± 1.4 trials;t49 = 6.7; p < 0.001) (Fig. 6A). However, the correlation between the difference in the number of trials to criterion and the difference in error rates across these two conditions was not significant (correlation coefficient r = 0.18; p > 0.05).
Fig. 6.

Summary of neuron-by neuron analysis during feature search. Gray bars represent data from the easy feature search, and black bars represent data from the difficult feature search. All other conventions are as in Figure4.
The average time of target discrimination determined from the exponential fit function was significantly earlier during easy search than during difficult search (132.2 ± 2.3 vs 173.7 ± 3.8 msec; t49 = 15.1;p < 0.001) (Fig. 6B). The difference in the time of target discrimination (41.5 msec) accounted for the difference in saccade latencies in these two conditions (46.3 msec;t49 = 1.6; p > 0.1), and the correlation between the difference in discrimination time and the difference in mean saccade latency across neurons was significant (correlation coefficient r = 0.39; p < 0.01). We also compared the time of target discrimination estimated from the exponential fits with the time of target discrimination measured as the first time point at which discrimination occurred at criterion level (e.g., 100 and 120 msec for the neuron in Fig. 5 during easy and difficult search, respectively). The mean time of target discrimination was not significantly different when measured with either method during difficult search (173.7 vs 169.6 msec; Wilcoxon signed ranks test: z = 1.8; p > 0.05) but was slightly different during easy search (132.2 vs 135.8 msec;z = 2.7; p < 0.01).
Reliability across neurons
We also measured neural reliability in the FEF during feature search by combining and comparing the activity of different neurons (Fig. 7). The results of the analysis in which a particular neuron could be selected more than once in a given iteration (with redundancy) are shown in Figure 7A. The superimposed curves of target choice probability as a function of the number of neurons contributing to the selection at each 10 msec time point after stimulus presentation are shown for easy search in Figure7A1, and for difficult search they are shown in Figure7A2. Early in the trials when neural activity across the population was approximately the same whether the target or a distractor fell in the response field of the neurons, the target choice probability functions were nearly flat and ∼12.5% for either search condition. This value corresponds to the chance probability of choosing randomly one stimulus of eight. As time progressed and target selection took place, the curves reached an asymptote sooner and at a higher level. Note that when the target was fully selected, the curves easily reached 100% target choice.
Fig. 7.
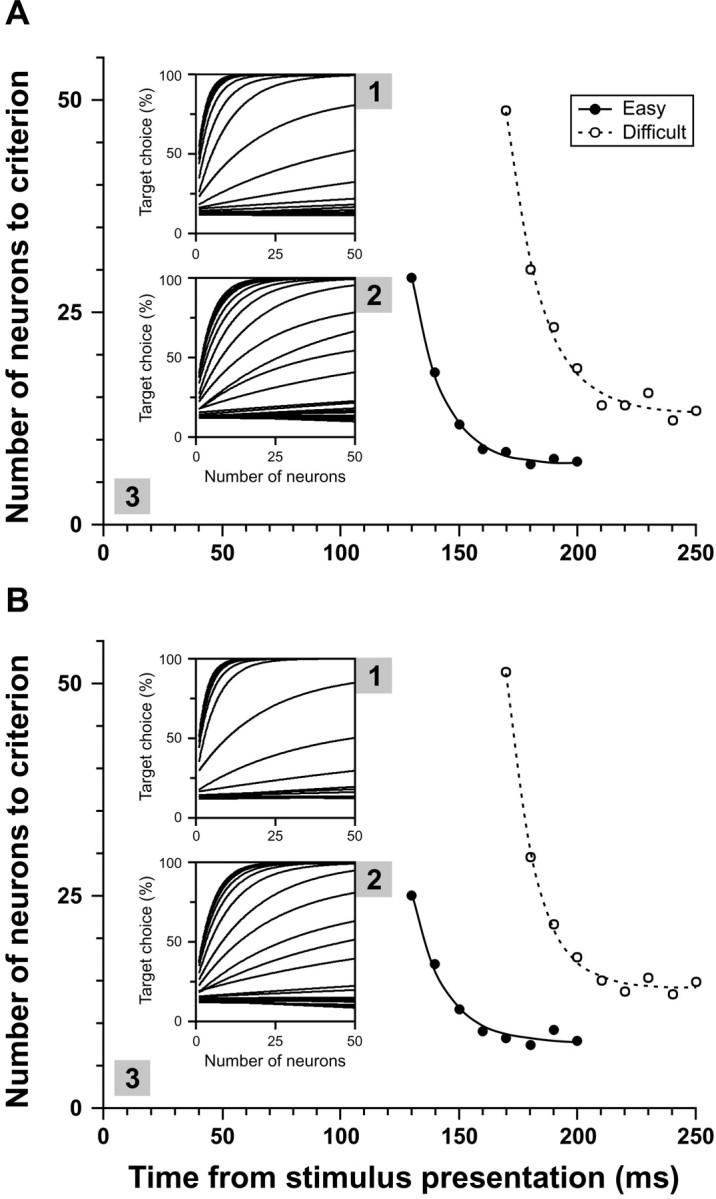
Population analysis of selection reliability in the FEF during feature search. A3, The number of neurons required to reach the near-perfect performance criterion (95% target choice) is plotted as a function of time from stimulus presentation during easy search (●) and difficult search (○). These values were derived from the curves of target choice probability as a function of the number of neurons the activity of which was combined by the simulation shown in the top inset for easy search (A1) and in the bottom inset for difficult search (A2). In these simulations, neurons were selected entirely randomly on each iteration, resulting in the possibility that a given neuron was selected more than once (see Materials and Methods). B, Same as Aexcept that neurons were chosen pseudorandomly on each iteration so that each neuron was not selected more than once.
The evolution of the reliability of the neural selection signals in the FEF during feature search is shown in Figure 7A3. At each time point, we determined the number of neurons that needed to be combined for target choice probability to reach the criterion level of 95%. The beginning of target discrimination at criterion level was estimated at 121.3 msec for easy search and 165.9 msec for difficult search. After a transition period that lasted ∼30 msec during easy search and ∼40 msec during difficult search, neural reliability reached an asymptote at 7.1 neurons for easy search and 13.1 neurons for difficult search.
The results of the analysis in which a particular neuron could only be selected once in a given iteration (i.e., without redundancy) are shown in Figure 7B. The results were similar to those of the previous analysis, with an estimated time of target discrimination of 119.5 msec for easy search and 167.1 msec for difficult search. The asymptotic neural reliability was estimated at 7.7 neurons for easy search and 14.1 neurons for difficult search.
Summary of results across search difficulty levels
On the basis of both speed and accuracy, monkeys performed best during easy feature search, followed by conjunction search with four stimuli and conjunction search with six stimuli, and performed worst during difficult feature search. Figure 8shows the relation between quantities derived from our simulations (plotted on the ordinates) and behavioral measurements (plotted on the abscissas) across all four search conditions and analysis procedures.
Fig. 8.

Summary of neural reliability and time course of target discrimination across visual search difficulty levels.A, The number of trials (■) and the number of neurons (▵) that needed to be combined to reach the near-perfect performance criterion (95% target choice) when neural selection reached a steady state is plotted against response error rates during each visual search task (i.e., conjunction search and feature search) and each level of difficulty within that task. B, The times of target discrimination derived from the neuron-by-neuron analysis (■) and from the population analysis (▵) are plotted against mean saccade latencies during each visual search task and level of difficulty within that task. The equation of the principal axis of the regression ellipse is shown in each plot. The results of the population analysis with and without redundancy were combined.
Average measures of neural reliability determined from the neuron-by-neuron analysis (i.e., trials to criterion) and the population analysis (i.e., neurons to criterion) for each search condition are plotted as a function of the frequency of errors in that search condition in Figure 8A. Clearly, more trials or neurons needed to be evaluated to reach the criterion level of 95% target choice probability as search difficulty increased. Our measures of reliability correlated well with the behavioral performance across search difficulty levels (r = 0.98; p< 0.001). On the basis of the slope of the principal axis of the regression ellipse, approximately one more trial or neuron had to be evaluated to compensate for a 4% increase in error rates across the range of search difficulty levels. Furthermore, across the four search tasks, the average number of trials of an individual neuron that needed to be pooled to reach the criterion (neuron-by-neuron analysis) was not significantly different from the average number of neurons that needed to be pooled within a trial to reach the criterion (population analysis) (t3 = 0.6; p> 0.05).
The time of target discrimination estimated by our calculations correlated well with the changes in mean saccade latency across search difficulty levels explored in this study (r = 0.94;p < 0.001) (Fig. 8B). The slope of the principal axis of the correlation showed that the time of target discrimination across search conditions increased by nearly the same amount of time as did saccade latencies (the slope of 0.99 was not significantly different from unity based on the 95% confidence interval). On average, the target was discriminated according to the measure used 78 msec before the mean saccade latency. Across the four search tasks, the time of target discrimination estimated on a neuron-by-neuron basis was ∼9.5 msec later than the time estimated from the population analysis (t3 = 9.7; p < 0.01). This difference may be attributable to increased variability in measurements conducted at the level of individual neurons and is not inconsistent with the precision of our analysis of neural reliability, which was conducted every 10 msec.
The summary of reliability calculations as a function of search accuracy in Figure 8A may be taken to suggest that target selection reliability in the FEF improves as search becomes easier. However, as can be seen from Figures 2 and 5, the difference between the neural representation of the target and that of a distractor increases as search difficulty decreases. In other words, the activity related to the target and the activity related to distractors became more distinct with less overlap as the search became easier. To determine whether this observation held true across the population, we measured average neural activity in a 50 msec time interval that extended until the average time of saccade initiation for each search condition and covered the time during which neural selection across the population was in an approximately steady state (Figs. 4, 7). As expected, the average difference between target and distractor neural activity was 45.1 and 41.9 spikes/sec during conjunction search with four and six elements, respectively, and was 33.1 and 25.3 spikes/sec during easy and difficult search, respectively. Thus, the increase in the number of combined trials or neurons is likely the result of the decreased discrimination ability of the neurons as search becomes more difficult. Similar decreases in neural sensitivity with increased discrimination difficulty have also been observed in area MT (Shadlen and Newsome, 1996) and the lateral intraparietal (LIP) area (Kim and Shadlen, 1999) using tasks requiring discrimination of motion in random-dot displays containing varying percentages of coherently moving dots. In other words, more trials or neurons would need to be evaluated to reach a fixed criterion with less discrimination ability.
To test this hypothesis, we repeated the reliability computations, but this time we calculated the number of trials or neurons required to reach the overall behavioral accuracy actually achieved in a particular search condition instead of the fixed 95% level. The result of this analysis is shown in Figure 9. As predicted, the number of trials or neurons required to match the overall behavioral accuracy did not increase as a function of search difficulty (F(1,6) = 5.1;p > 0.05). Instead, an average of six combined trials or neurons accounted for performance changes across the range of search difficulty levels that we investigated. In other words, with a neural network of fixed size, changes in neural modulation afforded by the visual stimulus and not neural reliability per se account for changes in performance.
Fig. 9.

This plot shows the number of trials (■) and neurons (▵) that needed to be combined to match the actual percentage of correctly performed trials in each task across levels of difficulty. The dotted line indicates the average across these points.
Relationship between spike variance and spike count
Another perspective on the reliability of FEF neurons is provided by the relationship between the variance of spike counts and mean spike count. The foregoing analysis was aimed at evaluating the hypothesis that the variability of discharges in the FEF is uniform across time through the selection process. For this analysis we combined the data from the 95 neurons recorded across both conjunction search and feature search and the two levels of difficulty within each task. However, two neurons were excluded because they did not fire any spikes during one of the intervals of analysis.
We analyzed the relationship between the variance and the mean of spike counts in two intervals. The first interval, which spanned 100 msec from the presentation of the search array, was designed to capture activity in the FEF before neurons discriminated target from distractors (Fig.10A). The average activation evoked by the target was only slightly greater than the average activation evoked by distractors (target: 23.4 spikes/sec; distractors: 22.2 spikes/sec; t185 = 4.3; p < 0.001). This small but significant difference happened because a few neurons began discriminating the target from distractors within 100 msec of the presentation of the search array (Figs. 3, 6). The relationship between spike variance and spike count was not significantly different when measured for trials during which the target was in the response field of the neurons compared with when measured for trials during which distractors were in the response field of the neurons (slope comparison: t368= 0.7; p > 0.05; coefficient/intercept comparison:t369 = 0.2; p > 0.05). The common power function (Fig. 10A) had a slope of 0.80 and a coefficient of 1.00.
Fig. 10.

Population response variance functions.A, Relationship between spike variance and spike counts when the target (●) or a distractor (xsymbols) was in the receptive field of a neuron during a time interval before target selection (0–100 msec after stimulus presentation). B, Same as A during a time interval in which neurons discriminated target from distractors (100–0 msec before saccade initiation). Data from conjunction search and feature search, as well as the levels of difficulty within each task, are shown combined. The equation of the best-fit power function is shown for each plot.
The second interval of the analysis was designed to capture activity in the FEF while neurons discriminated the target from distractors and extended from 100 to 0 msec before saccade initiation (Fig.10B). Accordingly, the average activation related to the target was more than twice the average activation related to distractors (target: 70.0 spikes/sec; distractors: 32.7 spikes/sec;t185 = 22.8; p < 0.001). Despite such a strong attentional modulation, the relationship between spike variance and spike count was still not significantly affected by whether the stimulus in the response field of the neurons was the target or distractors (slope comparison:t368 = 0.5; p > 0.05; coefficient/intercept comparison: t369= 1.9; p > 0.05). The common power function (Fig.10B) had a slope of 1.09 and a coefficient of 1.00. Note that the slope measured during this interval appears to be steeper than the slope measured during the previous interval. However, a meaningful comparison of these two slopes is precluded by the fact that variability in saccadic latencies would have unavoidably increased the measured variance of spike counts during the interval preceding saccade initiation.
Although simple least-squares linear regressions such as those computed above have been used commonly to assess the relationship between spike variance and mean spike count, such an analysis is biased because of the assumption that all the variability in the least-square error is caused by variation on the ordinate, which in this case plots the variance of spike counts. Because for data like these there is undoubtedly also variation in the abscissa (i.e., mean spike counts), we used an alternative regression analysis aimed at avoiding this bias. We computed the regression of the ratio of spike variance to mean spike count against mean spike count. The slopes and intercepts were still not significantly different during either analysis interval whether the target or distractors were in the response field of the neurons. The average ratio of spike variance to mean spike count in the FEF was 1.15 (SEM = 0.02).
DISCUSSION
We analyzed the reliability of FEF neurons signaling targets for saccades during two visual search tasks, a conjunction search that relies more on top-down selection and a feature search that relies more on bottom-up selection. The difficulty of the search for the target was manipulated by varying the number of distractors for conjunction search and the similarity between the target and distractors for feature search. This enabled us to examine neural signal reliability in the FEF over a wide range of search difficulty that was reflected in both the speed and accuracy of monkeys selecting the target. Several findings were made. First, using a model that selected the stimulus location with the highest activation based on a neuron—anti-neuron comparison, we found that as search difficulty increased, activity over more trials or neurons needed to be combined at each stimulus location to reach a near-perfect (95%) level of target selection. The number of trials or neurons that needed to be combined ranged from ∼7 (during the easy feature search) to ∼14 (during the difficult feature search). Second, when the target selection criterion was adjusted to reflect the accuracy actually achieved during each search condition, combining the activity of only about six trials or neurons at each stimulus location approximated performance accuracy across the entire range of search difficulty examined. Third, changes in reaction time across search conditions were entirely accounted for by changes in the time at which neurons started to discriminate the target from distractors. Fourth, the relationship between the variance of spikes and mean spike count in the FEF is similar to that observed in other visual areas and does not change with attentional selection, similar to what has recently been observed in area V4 (McAdams and Maunsell, 1999).
Neural reliability: relationship to previous studies, sources of error, and theoretical considerations
In our computations of neural reliability, we implemented a simple, winner-take-all architecture that compared the activity of pooled trials of one neuron or the activity of pooled neurons. The simulation simply selected the stimulus location that was associated with the highest activation, an approach consistent with our hypothesis that the FEF represents a salience map in which stimulus locations are tagged for behavioral relevance (Bichot, 2001; Thompson et al., 2001). Our findings show that pools of 7–14 neurons at each stimulus location were sufficient to signal the target location with near-perfect accuracy. An inspection of Figures 5 and 8 shows that even if the simulations were to match neural performance to perfect accuracy (i.e., 100% target choice probability), pools of ∼25 neurons per stimulus location in the most difficult search (i.e., difficult feature search) would be sufficient. Finally, when the simulation matched neural performance to overall accuracy in each search condition, we found that comparing the activity of pools of six neurons at each stimulus location approximated search performance over the entire range of search difficulty that we investigated.
The pool sizes obtained in our study are consistent with the findings of several studies of neural information coding conducted in various cortical areas, including area V1, areas of the inferior temporal cortex, areas of the parietal cortex, and the primary motor cortex, reporting neural pool sizes ranging from ∼5 to ∼40 neurons (Tolhurst et al., 1983; Optican and Richmond, 1987; Gawne and Richmond, 1993; Rolls et al., 1997; Lee et al., 1998; Prince et al., 2000) [also see Shadlen et al. (1996), their Appendix 4].
In contrast, the pool sizes that we determined are one or two orders of magnitude smaller than those determined by Shadlen et al. (1996) in their analysis of the relationship between neural and behavioral responses to visual motion. Several factors may contribute to this difference. First, they used a task that required monkeys to report a property—the direction of motion—of one stimulus; our task required monkeys to locate the target among multiple competing stimuli. Second, they recorded from neurons in extrastriate visual cortex selective for the properties of the stimulus; we recorded from neurons in frontal cortex that encode the relevance rather than the properties of stimuli. Third, they included neurons with optimal directions of motion different from the one being discriminated; in contrast, all of the FEF neurons in our sample contributed information about the location of the target and distractors. Finally, their model included correlation among neurons. This was done because of the small but significant relation between the variance of single neurons and the choices monkeys made (Britten et al., 1996) coupled with the finding that area MT neurons exhibit a modest correlation in discharge rates across trials (Zohary et al., 1994). This lack of statistical independence between neurons prevents averaging out noise completely.
The impact of a degree of statistical dependence between neurons on our analysis would be to reduce the rate of growth of the proportion of target choices as a function of number of trials or neurons pooled (Fig. 2B–E), thereby requiring more trials or neurons to reach criterion. The magnitude of this effect is proportional to the correlation coefficient. We have measured the degree of correlation between pairs of FEF neurons with overlapping response fields that were recorded simultaneously (predominantly on the same electrode) during feature search and found an average correlation value of 0.09 (SEM = 0.03). The correlation in the FEF appears to be smaller than that observed in MT (∼ 0.19) (Zohary et al., 1994) or in other areas (Lee et al., 1998). Thus, although our treatment of neurons as statistically independent in our simulations must have led to some underestimation of the neuronal pool size necessary for locating the target of a search array, the underestimation is only modest. Further work is needed to determine how much the weak correlation between FEF neurons affects target selection efficacy.
Finally, a recent series of studies by Hampson, Deadwyler, and colleagues (for review, see Hampson and Deadwyler, 1996, 1999) suggest that the content of information encoded by ensembles of neurons recorded simultaneously is greater than that encoded by ensembles of neurons reconstructed from single neuron recordings at different times. They attributed this difference to the “multiplexed” nature of task information encoded by the neurons. It is not clear from our data that such improvement of information encoding occurs with simultaneous recordings. First, we did not find a significant difference in the reliability of selection signals when we combined trials of a single neuron compared with when we combined trials from different neurons. Second, our population analysis results were not affected by whether a neuron contributed more than once to simulations within an iteration or whether all neurons selected in a given iteration were different from one another. Third, although all neurons were recorded in separate sessions during conjunction search, on average two neurons were recorded simultaneously during feature search, yet there is no obvious improvement of neural reliability for the feature search data compared with the conjunction search data. However, our study was not designed to address the possibility that spike correlations of simultaneously recorded neurons encode information beyond that derived from simple average firing rates. Such an analysis requires larger ensembles of simultaneously recorded neurons than our sample included, so we can make no strong claims about the potential advantage of information encoded in ways other than average firing rate.
Time course of target discrimination
The analyses that we have conducted show that small pools of neurons predicted not only the accuracy of responses but also the speed of responses. To our knowledge, our study is the first to examine the temporal dynamics of the reliability of neural decision signals. As discussed, the temporal dynamics of the selection process revealed important characteristics of the selection process (for review, seeSchall and Bichot, 1998; Schall and Thompson, 1999) and provided us with an additional independent dimension over which we evaluated the performance of our model.
We previously investigated the time course of target selection in the FEF during a pop-out visual search using an analysis adapted from signal detection theory (Thompson et al., 1996). In that study, it was concluded that the time at which FEF neurons discriminate the target does not predict the time of saccade initiation. This conclusion was based on the fact that when trials during a recording session were divided into groups of short, medium, and long saccade latencies, the time of target discrimination calculated for each group of trials did not reflect that group's range of saccade latencies. Thus, a more accurate description of the results of our earlier study is that the time of target discrimination in the FEF does not predict the variability of saccadic reaction times for a given search condition. These results do not address the issue of whether the time of target discrimination in the FEF predicts the mean saccade latency of a given search condition. Thus, the results of our previous study are not at odds with the present finding that the time of target discrimination in the FEF accounts for changes in overall saccade latency between search conditions over a wide range of search difficulty levels. Furthermore, the differences between the findings of these two studies are not methodological because a signal detection analysis of the feature search data presented here shows that the time of target discrimination in the FEF does indeed predict the average saccade latency during performance of a search task (Thompson et al., 1998).
One implication of the exponential improvement over time in neural reliability is that the accuracy of target detection should improve with a similar time course. This prediction is supported by experiments that have measured the time course of feature and conjunction search by varying stimulus duration (Nakayama and Mackeben, 1989), by requiring subjects to respond prematurely (McElree and Carrasco, 1999), or by making a pop-out search difficult by adding distractors to the displays after a variable delay (Olds et al., 2000). These studies found that target detection probability improved with time from stimulus presentation with a time course similar to the one derived from neural data in our study. A similar time course has been shown to characterize available perceptual information during a digit-recognition task (Loftus et al., 1992), with exponential performance curves best fit by an equation of the form that was used in our study.
Concluding remarks
In this study, we presented a simple approach to examine neural reliability in signaling a decision. We applied this approach to neural activity in the FEF during visuomotor decisions, which proved to be extremely robust in predicting both accuracy and speed over a range of visual search difficulty levels resulting from different types of tasks and manipulations. Overall, it appears that relatively small pools of selective neurons in prefrontal cortex are sufficient to form a decision. Such data are necessary for the design of more accurate models of visual selection and attention.
Footnotes
This work was supported by National Eye Institute Grant RO1-EY08890 to J.D.S. and Grants P30-EY08126 and T32-EY07135 to the Vanderbilt Vision Research Center, by the McKnight Endowment Fund for Neuroscience, and by the National Institute of Mental Health Intramural Research Program. J.D.S. is a Kennedy Center Investigator. We thank Drs. Robert Desimone, Barry Richmond, and Michael Shadlen for helpful discussion and comments on this manuscript.
Correspondence should be addressed to Dr. Narcisse P. Bichot, Laboratory of Neuropsychology, National Institute of Mental Health, National Institutes of Health, Building 49, Room 1B80, Bethesda, MD 20892-4415. E-mail:bichot@ln.nimh.nih.gov.
REFERENCES
- 1.Bichot NP. Attention, eye movements, and neurons: linking physiology and behavior. In: Harris LR, Jenkin MRM, editors. Vision and attention. Springer-Verlag; New York: 2001. [Google Scholar]
- 2.Bichot NP, Schall JD. Saccade target selection in macaque during feature and conjunction visual search. Vis Neurosci. 1999a;16:81–89. doi: 10.1017/s0952523899161042. [DOI] [PubMed] [Google Scholar]
- 3.Bichot NP, Schall JD. Effects of similarity and history on neural mechanisms of visual selection. Nat Neurosci. 1999b;2:549–554. doi: 10.1038/9205. [DOI] [PubMed] [Google Scholar]
- 4.Bichot NP, Schall JD, Thompson KG. Visual feature selectivity in frontal eye fields induced by experience in mature macaques. Nature. 1996;381:697–699. doi: 10.1038/381697a0. [DOI] [PubMed] [Google Scholar]
- 5.Britten KH, Shadlen MN, Newsome WT, Movshon JA. Responses of neurons in macaque MT to stochastic motion signals. Vis Neurosci. 1993;10:1157–1169. doi: 10.1017/s0952523800010269. [DOI] [PubMed] [Google Scholar]
- 6.Britten KH, Newsome WT, Shadlen MN, Celebrini S, Movshon JA. A relationship between behavioral choice and the visual responses of neurons in macaque MT. Vis Neurosci. 1996;13:87–100. doi: 10.1017/s095252380000715x. [DOI] [PubMed] [Google Scholar]
- 7.Bushnell MC, Goldberg ME, Robinson DL. Behavioral enhancement of visual responses in monkey cerebral cortex. I. Modulation in posterior parietal cortex related to selective visual attention. J Neurophysiol. 1981;46:755–772. doi: 10.1152/jn.1981.46.4.755. [DOI] [PubMed] [Google Scholar]
- 8.Desimone R, Duncan J. Neural mechanisms of selective visual attention. Annu Rev Neurosci. 1995;18:193–222. doi: 10.1146/annurev.ne.18.030195.001205. [DOI] [PubMed] [Google Scholar]
- 9.Gawne TJ, Richmond BJ. How independent are the messages carried by adjacent inferior temporal cortical neurons? J Neurosci. 1993;13:2758–2771. doi: 10.1523/JNEUROSCI.13-07-02758.1993. [DOI] [PMC free article] [PubMed] [Google Scholar]
- 10.Hampson RE, Deadwyler SA. LTP and LTD and the encoding of memory in small ensembles of hippocampal neurons. In: Baudry M, Davis J, editors. Long-term potentiation, Vol 3. MIT; Cambridge, MA: 1996. pp. 199–214. [Google Scholar]
- 11.Hampson RE, Deadwyler SA. Pitfalls and problems in the analysis of neuronal ensemble recordings during behavioral tasks. In: Nicolelis MAL, editor. Methods for neural ensemble recordings. CRC; Boca Raton, FL: 1999. pp. 229–248. [Google Scholar]
- 12.Henry GH, Bishop PO, Tupper RM, Dreher B. Orientation specificity and response variability of cells in the striate cortex. Vision Res. 1973;13:1771–1779. doi: 10.1016/0042-6989(73)90094-1. [DOI] [PubMed] [Google Scholar]
- 13.Kim JN, Shadlen MN. Neural correlates of a decision in the dorsolateral prefrontal cortex of the macaque. Nat Neurosci. 1999;2:176–185. doi: 10.1038/5739. [DOI] [PubMed] [Google Scholar]
- 14.Lee D, Port DL, Kruse W, Georgopoulos AP. Neuronal population coding: multielectrode recordings in primate cerebral cortex. In: Eichenbaum H, Davis J, editors. Neuronal ensembles: strategies for recording and decoding. Wiley; New York: 1998. pp. 117–136. [Google Scholar]
- 15.Loftus GR, Duncan J, Gehrig P. On the time course of perceptual information that results from a brief visual presentation. J Exp Psychol Hum Percept Perform. 1992;18:530–549. doi: 10.1037/0096-1523.18.2.530. [DOI] [PubMed] [Google Scholar]
- 16.Luck SJ, Chelazzi L, Hillyard SA, Desimone R. Neural mechanisms of spatial selective attention in areas V1, V2, and V4 of macaque visual cortex. J Neurophysiol. 1997;77:24–42. doi: 10.1152/jn.1997.77.1.24. [DOI] [PubMed] [Google Scholar]
- 17.Maunsell JHR. The brain's visual world: representation of visual targets in cerebral cortex. Science. 1995;270:764–769. doi: 10.1126/science.270.5237.764. [DOI] [PubMed] [Google Scholar]
- 18.McAdams CJ, Maunsell JHR. Effects of attention on the reliability of individual neurons in monkey visual cortex. Neuron. 1999;23:765–773. doi: 10.1016/s0896-6273(01)80034-9. [DOI] [PubMed] [Google Scholar]
- 19.McElree B, Carrasco M. The temporal dynamics of visual search: evidence for parallel processing in feature and conjunction searches. J Exp Psychol Hum Percept Perform. 1999;25:1517–1539. doi: 10.1037//0096-1523.25.6.1517. [DOI] [PMC free article] [PubMed] [Google Scholar]
- 20.Moran J, Desimone R. Selective attention gates visual processing in the extrastriate cortex. Science. 1985;229:782–784. doi: 10.1126/science.4023713. [DOI] [PubMed] [Google Scholar]
- 21.Motter BC. Focal attention produces spatially selective processing in visual cortical areas V1, V2, and V4 in the presence of competing stimuli. J Neurophysiol. 1993;70:909–919. doi: 10.1152/jn.1993.70.3.909. [DOI] [PubMed] [Google Scholar]
- 22.Mountcastle VB, Motter BC, Steinmetz MA, Sestokas AK. Common and differential effects of attentive fixation on the excitability of parietal and prestriate (V4) cortical visual neurons in the macaque monkey. J Neurosci. 1987;7:2239–2255. doi: 10.1523/JNEUROSCI.07-07-02239.1987. [DOI] [PMC free article] [PubMed] [Google Scholar]
- 23.Nakayama K, Mackeben M. Sustained and transient components of focal attention. Vision Res. 1989;29:1631–1647. doi: 10.1016/0042-6989(89)90144-2. [DOI] [PubMed] [Google Scholar]
- 24.Olds ES, Cowan WB, Jolicoeur P. The time-course of pop-out search. Vision Res. 2000;40:891–912. doi: 10.1016/s0042-6989(99)00248-5. [DOI] [PubMed] [Google Scholar]
- 25.Optican LM, Richmond BJ. Temporal encoding of two-dimensional patterns by single units in primate inferior temporal cortex. III. Information theoretic analysis. J Neurophysiol. 1987;57:162–178. doi: 10.1152/jn.1987.57.1.162. [DOI] [PubMed] [Google Scholar]
- 26.Prince SJD, Pointon AD, Cumming BG, Parker AJ. The precision of single neuron responses in cortical area V1 during stereoscopic depth judgments. J Neurosci. 2000;20:3387–3400. doi: 10.1523/JNEUROSCI.20-09-03387.2000. [DOI] [PMC free article] [PubMed] [Google Scholar]
- 27.Rolls ET, Treves A, Tovee MJ. The representational capacity of the distributed encoding of information provided by populations of neurons in primate temporal visual cortex. Exp Brain Res. 1997;114:149–162. doi: 10.1007/pl00005615. [DOI] [PubMed] [Google Scholar]
- 28.Sayer RJ, Friedlander MJ, Redman SJ. The time course and amplitude of EPSPs evoked at synapses between pairs of CA3/CA1 neurons in the hippocampal slice. J Neurosci. 1990;10:826–836. doi: 10.1523/JNEUROSCI.10-03-00826.1990. [DOI] [PMC free article] [PubMed] [Google Scholar]
- 29.Schall JD, Bichot NP. Neural correlates of visual and motor decision processes. Curr Opin Neurobiol. 1998;8:211–217. doi: 10.1016/s0959-4388(98)80142-6. [DOI] [PubMed] [Google Scholar]
- 30.Schall JD, Thompson KG. Neural selection and control of visually guided eye movements. Annu Rev Neurosci. 1999;22:241–259. doi: 10.1146/annurev.neuro.22.1.241. [DOI] [PubMed] [Google Scholar]
- 31.Schall JD, Hanes DP, Thompson KG, King DJ. Saccade target selection in frontal eye field of macaque. I. Visual and premovement activation. J Neurosci. 1995;15:6905–6918. doi: 10.1523/JNEUROSCI.15-10-06905.1995. [DOI] [PMC free article] [PubMed] [Google Scholar]
- 32.Shadlen MN, Newsome WT. Motion perception: seeing and deciding. Proc Natl Acad Sci USA. 1996;93:628–633. doi: 10.1073/pnas.93.2.628. [DOI] [PMC free article] [PubMed] [Google Scholar]
- 33.Shadlen MN, Britten KH, Newsome WT, Movshon JA. A computational analysis of the relationship between neuronal and behavioral responses to visual motion. J Neurosci. 1996;16:1486–1510. doi: 10.1523/JNEUROSCI.16-04-01486.1996. [DOI] [PMC free article] [PubMed] [Google Scholar]
- 34.Thompson KG, Schall JD. The detection of visual signals by macaque frontal eye field during masking. Nat Neurosci. 1999;2:283–288. doi: 10.1038/6398. [DOI] [PubMed] [Google Scholar]
- 35.Thompson KG, Hanes DP, Bichot NP, Schall JD. Perceptual and motor processing stages identified in the activity of macaque frontal eye field neurons during visual search. J Neurophysiol. 1996;76:4040–4054. doi: 10.1152/jn.1996.76.6.4040. [DOI] [PubMed] [Google Scholar]
- 36.Thompson KG, Bichot NP, Schall JD. Dissociation of visual discrimination from saccade programming in macaque frontal eye field. J Neurophysiol. 1997;77:1046–1050. doi: 10.1152/jn.1997.77.2.1046. [DOI] [PubMed] [Google Scholar]
- 37.Thompson KG, Rao SC, Schall JD. Effects of visual salience on target selection in the frontal eye field of macaque monkeys. Soc Neurosci Abstr. 1998;24:1146. [Google Scholar]
- 38. Thompson KG, Bichot NP, Schall JD. From attention to action in frontal cortex. Visual attention and cortical circuits Braun J, Koch C, Davies J. 2001. 137 157 MIT; Cambridge, MA, in press. [Google Scholar]
- 39.Tolhurst DJ, Movshon JA, Dean AF. The statistical reliability of signals in single neurons in cat and monkey visual cortex. Vision Res. 1983;23:775–785. doi: 10.1016/0042-6989(83)90200-6. [DOI] [PubMed] [Google Scholar]
- 40.Treisman AM, Gelade G. A feature-integration theory of attention. Cognit Psychol. 1980;12:97–136. doi: 10.1016/0010-0285(80)90005-5. [DOI] [PubMed] [Google Scholar]
- 41.Treue S, Maunsell JHR. Effects of attention on the processing of motion in macaque middle temporal and medial superior temporal visual cortical areas. J Neurosci. 1999;19:7591–7602. doi: 10.1523/JNEUROSCI.19-17-07591.1999. [DOI] [PMC free article] [PubMed] [Google Scholar]
- 42.Zar JH. Biostatistical analysis. Prentice Hall; Upper Saddle River, NJ: 1999. [Google Scholar]
- 43.Zipser K, Lamme VAF, Schiller PH. Contextual modulation in primary visual cortex. J Neurosci. 1996;16:7376–7389. doi: 10.1523/JNEUROSCI.16-22-07376.1996. [DOI] [PMC free article] [PubMed] [Google Scholar]
- 44.Zohary E, Shadlen MN, Newsome WT. Correlated neuronal discharge rate and its implications for psychophysical performance. Nature. 1994;370:140–143. doi: 10.1038/370140a0. [DOI] [PubMed] [Google Scholar]