

Abstract
Action potentials are a universal currency for fast information transfer in the nervous system, yet few studies address how some spikes carry more information than others. We focused on the transformation of sensory representations in the lemniscal (high-fidelity) auditory thalamocortical network. While stimulating with a complex sound, we recorded simultaneously from functionally connected cell pairs in the ventral medial geniculate body and primary auditory cortex. Thalamic action potentials that immediately preceded or potentially caused a cortical spike were more selective than the average thalamic spike for spectrotemporal stimulus features. This net improvement of thalamic signaling indicates that for some thalamic cells, spikes are not propagated through cortex independently but interact with other inputs onto the same target cell. We then developed a method to identify the spectrotemporal nature of these interactions and found that they could be cooperative or antagonistic to the average receptive field of the thalamic cell. The degree of cooperativity with the thalamic cell determined the increase in feature selectivity for potentially causal thalamic spikes. We therefore show how some thalamic spikes carry more receptive field information than average and how other inputs cooperate to constrain the information communicated through a cortical cell.
Keywords: convergence, information, receptive field, feature selectivity, medial geniculate, auditory cortex
Despite decades of research on receptive fields in anatomically connected regions, we have only a rudimentary understanding of how neurons transform information between stations and how cooperation influences the transformation. A detailed comparison of receptive fields between functionally connected thalamic inputs and their cortical targets illustrates the remarkable specificity of the thalamocortical transformation (Creutzfeldt et al., 1980; Tanaka, 1983; Reid and Alonso, 1995; Miller et al., 2000; Roy and Alloway, 2001). Although such comparisons provide essential constraints on the degree of functional convergence, they reveal only how all the spikes of an input cell relate to all those of its target. The next goal, therefore, has been to identify whether some spikes might be more important than others. For instance, action potentials from two thalamic cells that occur in tight synchrony can drive a cortical target much more effectively than nonsynchronous spikes (Alonso et al., 1996; Usrey et al., 2000; Roy and Alloway, 2001). Nevertheless, these latter studies did not characterize the functional role that synchronous or otherwise temporally unique spikes play in transmitting receptive field information to cortex.
The explicit relationship between timing among action potentials and the receptive field information carried by a neuron has been investigated within thalamus (Dan et al., 1998) and within cortex (Ghose et al., 1994; Reich et al., 2000) but not explicitly across the thalamocortical synapse. A crucial element of the thalamocortical transformation, therefore, has not been addressed: whether thalamic spikes that potentially cause cortical spikes carry more or less receptive field information than expected. The answer to this question is illustrative, because it suggests whether influences external to a given thalamic cell affect the information transmitted through cortex. Of all the thalamic spikes that impinge on a cortical cell, only a small proportion are transmitted. If potentially causal thalamic spikes tend to carry the same receptive field information as the average, then they are being propagated independently or at random with respect to the stimulus. No external influence is necessary to explain their success or failure at the thalamocortical synapse. If on the other hand they carry different receptive field information than average, then their propagation through cortex is not random. Other inputs must affect which input spikes are successful and which fail. We would like to describe, then, what functional, stimulus-specific role other inputs play to modulate the character of the contribution of a thalamic cell to cortex.
We introduce a novel approach to these questions, relying on simultaneous recordings of functionally connected neurons in the thalamus and cortex. Spectrotemporal receptive fields describe the neural responses to dynamic, wideband sounds. The selectivity of a neuron to stimulus features quantifies whether thalamic spikes that potentially cause cortical spikes carry more or less information than expected. We then estimate the spectrotemporal, stimulus-dependent conditioning influence of other cells on a given thalamic input. Finally we show how the degree of cooperation between conditioning influence and average thalamic input relates to the differences in feature selectivity between potentially causal and average thalamic spikes.
MATERIALS AND METHODS
Electrophysiology. A detailed account of our experimental methods has been reported previously (Miller and Schreiner, 2000). Young adult cats (n = 4) were given an initial dose of ketamine (22 mg/kg) and acepromazine (0.11 mg/kg) and then anesthetized with Nembutal (15–30 mg/kg) during the surgical procedure. The animal's temperature was maintained with a thermostatic heating pad. Bupivicaine was applied to incisions and pressure points. Surgery consisted of a tracheotomy, reflection of the soft tissues of the scalp, craniotomy over the primary auditory cortex (AI) and the suprasylvian gyrus (for the thalamic approach), and durotomy. After surgery, the animal was maintained in an unreflexive state with a continuous infusion of ketamine and diazepam (10 mg/kg ketamine and 0.5 mg/kg diazepam in lactated Ringer's solution). All procedures were in strict accordance with guidelines of the University of California San Francisco Committee for Animal Research and the Society for Neuroscience.
All recordings were made with the animal in a sound-shielded anechoic chamber (IAC, Bronx, NY), with stimuli delivered via a closed, binaural speaker system (diaphragms from Stax). Simultaneous extracellular recordings were made in the thalamorecipient layers (IIIb and IV) of AI and in the ventral division of the medial geniculate body. Electrodes were parylene-coated tungsten (Microprobe Inc., Potomac, MD) with impedances of 1–2 MΩ or 3–5 MΩ tungsten electrodes plated with platinum black. One or two electrodes were placed in each station with hydraulic microdrives on mechanical manipulators (Narishige, Tokyo, Japan), mounted on a stereotaxic frame (David Kopf Instruments, Tujunga, CA) or on supplementary supports. Localization of thalamic electrodes, which were stereotaxically advanced along the vertical, was confirmed with Nissl-stained sections. Spike trains were amplified and bandpass-filtered (500–10,000 Hz), recorded on a Cygnus Technology (Delaware Water Gap, PA) CDAT-16 recorder with a 24 kHz sampling rate, and sorted off-line with a Bayesian spike-sorting algorithm (Lewicki, 1994). Each electrode location yielded an average of 1.9 well-isolated single units. Spontaneous neural activity (in silence) was recorded for ∼35 min, and stimulus-driven activity was recorded for ∼20 min.
Stimulus. The dynamic ripple stimulus (Schreiner and Calhoun, 1994; Kowalski et al., 1996; Escabí et al., 1998;Miller and Schreiner, 2000) is a temporally varying broadband sound composed of 230 sinusoidal carriers (500–20,000 Hz) with randomized phase. The magnitude of any carrier at any time is modulated by the spectrotemporal envelope, consisting of sinusoidal amplitude peaks (“ripples”) on a logarithmic frequency axis that change through time. Two parameters define the envelope: the number of spectral peaks per octave, or ripple density, and the speed and direction of the changes of the peaks, or temporal frequency modulation. Both ripple density and temporal frequency modulation rate were varied randomly and independently during the 20 min nonrepeating stimulus. Ripple density varied slowly (maximal rate of change, 1 Hz) between zero and four cycles per octave; the temporal frequency modulation parameter varied between 0 and 100 Hz (maximal rate of change, 3 Hz). Both parameters were statistically independent and unbiased within those ranges. In one experiment, however, the temporal modulation spectrum decayed slightly; all evidence of this mild bias was readily abolished while thresholding the spectrotemporal receptive fields (STRFs; see below). Maximum modulation depth of the spectrotemporal envelope was 45 dB. Mean intensity was set ∼20–30 dB above the thresholds of the neurons to best frequency pure tones of 50 msec duration and 5 msec linear rise–fall envelope; thalamic and cortical thresholds were typically very similar.
Cross-correlation. Data analysis was performed in Matlab (Mathworks Inc., Natick, MA). Spike trains were cross-correlated (Perkel et al., 1967) with a 1 msec bin width, and significant bins (p < 0.01) were determined with respect to an independent, Poisson assumption. Functionally connected pairs of neurons (n = 29 from a total of 741) were chosen by a strict set of criteria. Most pairs, including those in Figures 4 and 5, showed a maximum and significant correlogram peak within a 1–5 msec lag time, thalamus leading cortex, under both spontaneous and stimulus-driven conditions. It is important to use spontaneous activity when possible, because it indicates functional connectivity when the auditory system is at rest, in terms of representing stimuli. Thus, by requiring monosynaptic-like peaks under both spontaneous and driven conditions, we select particularly stable functional connections. There are, however, two potential difficulties with using spontaneous activity. The first is that a widespread, oscillatory state in the 7–14 Hz range may obscure fast correlation features (Eggermont 1992;Cotillon et al. 2000; Miller and Schreiner, 2000). Therefore, when thalamocortical oscillations were present under the spontaneous condition, as indicated by a significant peak in the power spectrum between 7 and 14 Hz, the correlogram was highpass-filtered at >25 Hz. This eliminates broad, unspecific correlation peaks and leaves intact the narrow, specific peaks that reflect direct functional connectivity. The significance level was then adjusted accordingly, and the 1–5 msec peak criterion was applied. The second challenge in using spontaneous activity is that the spike rates of some neurons are so low in silence that their correlograms are too noisy to show significant features. To avoid biasing our sample toward neurons with high spontaneous rates, we applied an additional, more conservative criterion. We looked more closely at recording locations where some pairs showed the significant maximum 1–5 msec peak in both conditions and considered thalamocortical pairs for which the coefficient of variation of the spontaneous correlograms exceeded 1 for the presumably featureless regions of ±300–3000 msec lag time. If those pairs also had a very fast (3 msec width at half-height), short-latency (1–5 msec lag) peak under the driven condition, they were included in the analysis (n = 6). Given intrinsic response variability to the dynamic ripple stimulus in thalamus and cortex, this criterion is strict enough that pairs with solely stimulus-driven correlations are rejected; with typical quasilinear responses, the peak width is so brief that our maximum driving rate of 100 Hz is too slow to account for it. Thus in finding functionally connected pairs, we usually used both spontaneous and driven activity and otherwise applied an even more stringent criterion to the driven activity to rule out solely stimulus-driven correlogram features. Two pairs were excluded from the analysis because either the cortical unit (n = 1) or the thalamic unit (n = 1) had an STRF too weak to characterize. Finally, one pair was removed because a cell was so bursty as to preclude our analysis, and three pairs were excluded because the receptive field features extended beyond our frequency-sampling range (500–20,000 Hz).
Fig. 4.
Absence of conditioning influence.a, In the thalamocortical correlogram, red bins are the peak thalamic spikes, those that presumably caused a cortical spike. (See Fig. 1 legend for other correlogram details.)b, Thalamic STRF. c, Cortical STRF. To aid interpretation, only the significant (p< 0.002) STRFs are plotted. In deriving the peak and conditioning STRFs, however, all operations were performed on the raw, nonthresholded signals. The STRFs in d–f are plotted with the same color scale for comparison. d, The peak STRF (spike-normalized) estimates the response properties of only the thalamic spikes that caused a cortical spike. e, The thalamic STRF is replotted but here is spike-normalized for direct comparison with the peak STRF. In this case, the peak STRF is similar in location and magnitude to the average thalamic STRF.f, Stimulus-related conditioning influence on whether thalamic spikes are propagated through the cortical cell. For this thalamic neuron, when the average STRF is subtracted from the peak STRF, only noise remains, so that no significant conditioning influence is observed; the presumed causal spikes are not unique in the way they represent stimuli. For visual reference in c,d, and f, a green contourindicates the location of the high-energy peak of the thalamic STRF.Freq., Frequency; Norm., normalized.
Fig. 5.

a–f, Cooperative conditioning influence. a, In the thalamocortical correlogram,red bins are the peak thalamic spikes, those that presumably caused a cortical spike. (See Fig. 1 legend for other correlogram details.) b, Thalamic STRF.c, Cortical STRF. To aid interpretation, only the significant (p < 0.002) STRFs are plotted. In deriving the peak and conditioning STRFs, however, all operations were performed on the raw, non-thresholded signals. The STRFs ind–f are plotted with the same color scale for comparison. d, The peak STRF (spike-normalized) estimates the response properties of only the thalamic spikes that caused a cortical spike. e, The thalamic STRF is replotted but here is spike-normalized for direct comparison with the peak STRF. In this case, the peak STRF has considerably greater magnitude than the average thalamic STRF. Its excitatory region, moreover, overlaps only the lower-frequency portion of the average thalamic excitatory subfield. f, Stimulus-related conditioning influence on whether thalamic spikes are propagated through the cortical cell. For this thalamic neuron, the conditioning influence is cooperative. For thalamic spikes to cause a cortical spike, both excitatory and inhibitory regions must be of greater average magnitude and of slightly different frequency content than typically causes the thalamic cell to fire. For visual reference inc, d, and f, agreen contour indicates the location of the high-energy peak of the thalamic STRF. g–l, Antagonistic conditioning influence. g, Thalamocortical correlogram.h, Thalamic STRF. i, Cortical STRF. The STRFs in j–l are plotted with the same color scale for comparison. j, The peak STRF (spike-normalized) estimates the response properties of only the thalamic spikes that caused a cortical spike. k, The thalamic STRF is replotted but here is spike-normalized for direct comparison with the peak STRF. In this case, the peak STRF is similar in magnitude but more limited in spectrotemporal extent than the average thalamic STRF.l, Stimulus-related conditioning influence on whether thalamic spikes are propagated through the cortical cell. For this thalamic neuron, the conditioning influence is antagonistic. For thalamic spikes to cause a cortical spike, the stimulus must contain less energy, on average, in regions that typically excite the thalamic cell. For visual reference in i, j, andl, a green contour indicates the location of the high-energy peak of the thalamic STRF. Freq., Frequency; Norm., normalized.
Spectrotemporal receptive fields. For each neuron, the reverse correlation method was used to estimate the STRF by averaging the spectrotemporal stimulus envelopes immediately preceding each spike (Aertsen et al., 1980; Escabí et al., 1998; Klein et al., 2000). Positive regions of the STRF indicate that stimulus energy at that frequency and time tends to increase the firing rate of the neuron, and negative regions indicate where the stimulus envelope induces a decrease in firing rate. In this report, only STRFs derived from the typically dominant, contralateral ear were used. For display, the STRFs were thresholded to show significant regions (p < 0.002). For visual reference in some figures, the high-energy peak of an STRF is indicated by a contour at 1/e times its maximum magnitude; such a contour typically circumscribes ∼90% of the energy in the STRF feature. In all figures, plots are bounded to show details of the main excitatory peak and any areas that show a peak or conditioning influence. The entire STRFs will be covered in another report (L. M. Miller, unpublished data).
Similarity index. STRFs were compared with each other by a similarity index (DeAngelis et al., 1999; Reich et al., 2000) related to a correlation coefficient. The two significant STRFs were treated as vectors rather than arrays in time and frequency. The similarity index is then the inner product of the vectorized STRFs, divided by both of their vector norms. A vector norm is the square root of the inner product of a vector with itself. Therefore, STRFs that are similar in shape and sign have a similarity index near 1, those of similar shape but opposite sign have an index near −1, and those that are orthogonal have an index of 0.
Feature selectivity index. The relative amount of information a neuron transmits reflects the degree to which it fires selectively to certain stimulus features. The features of the dynamic ripple stimulus most relevant to a neuron, on average, are those embodied in its STRF. We can therefore calculate how selectively a neuron responds by comparing its STRF with all the stimuli that preceded action potentials. If a neuron is highly selective, it fires only when the features in the stimulus exactly match the STRF. If a neuron has low selectivity, it fires to stimuli bearing little overall resemblance to the STRF.
Just as a similarity index (see Similarity index above) quantifies the resemblance between two STRFs, it can be used to compare an STRF and a prespike spectrotemporal stimulus envelope. Each spike, then, has a similarity index associated with it. In this context, a similarity index near 1 means the spike was very selective, and a similarity index near 0 means the spike was random with respect to the stimulus. The typically thousands of spikes from a given cell yield a range of similarity indices, distributed from ∼0 to 1. The more the distribution is biased toward 1, the more selective the cell is for features in the ripple stimulus. The feature selectivity index (FSI) measures this bias; an ideal feature selector has an FSI of 1, and a random neuron has an FSI of 0.
Details of the FSI procedure have been reported previously (Escabí et al., 2000). Briefly, the FSI is computed from the cumulative distribution function (CDF) of the STRF-versus-stimulus similarity index distribution. The area under the CDF of a neuron is compared with that of an ideal feature selector and that from a theoretically random neuron. Because all the similarity indices from an ideal feature selector are equal to 1, its CDF has the value 0 everywhere except 1. The area under the CDF of a feature-selective cell is thus 0. The CDF for a theoretically random neuron is constructed from the similarity indices of the actual STRF versus the stimulus preceding 12,000 random, fabricated spikes; this accounts for variability solely from STRF idiosyncrasies. Because the similarity indices for a random neuron are clustered near 0, its CDF rises near 0 and reaches its maximum at a low similarity index. The area under the random CDF is thus large and ∼1. The area under the actual CDF, calculated with the same spikes used to construct the STRF, lies somewhere between the extremes of large (random neuron) and 0 (ideal feature selector). The FSI is therefore the difference in area between the random CDF versus the actual CDF, divided by the area under the random CDF: FSI = (Arand −Aactual)/Arand. An FSI of 0 means the neuron fires randomly with respect to the stimulus, and an FSI of 1 means the neuron is perfectly selective for a certain stimulus feature contained in the dynamic ripple.
Correlation-dependent STRFs. Typically, STRFs are derived using all the spikes of a cell. We were interested in the STRF from only those thalamic spikes that caused a cortical spike. The following procedure is described in Results and graphically in Figure 3. The first step was to isolate the subset of thalamic spikes that potentially caused cortical spikes. These thalamic spikes that precede a cortical spike by 1–10 msec are labeled time-locked. The time-locked STRF was derived from these spikes alone.
Fig. 3.
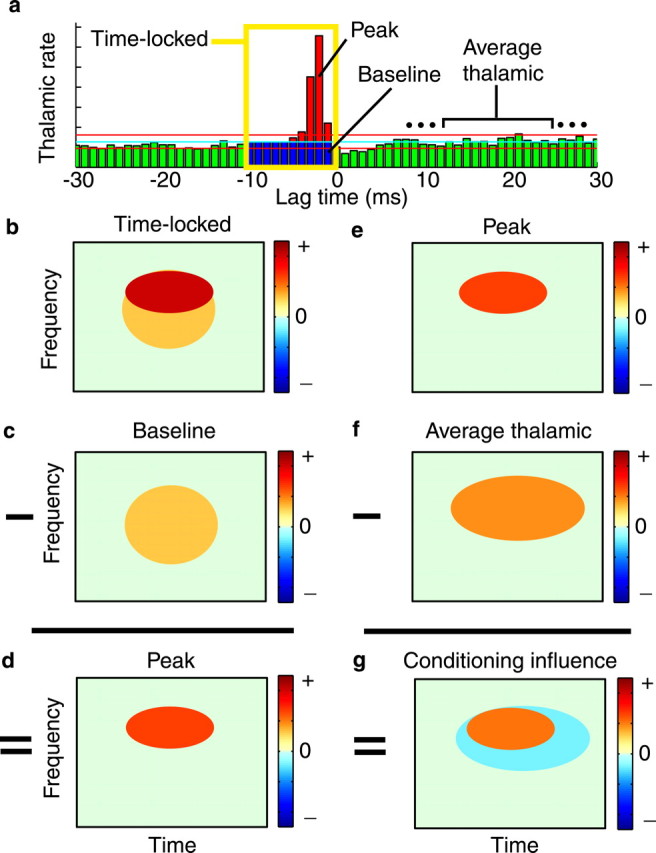
Schematic of methods to identify the stimulus-dependent influence that conditions whether the spikes of a thalamic cell are propagated by the target cortical cell.a, The cross-correlogram can be conceptually divided into subsets of thalamic spikes. Time-locked spikes (yellow box) are those that precede a cortical spike by 1–10 msec. Of the time-locked spikes, the baseline spikes (blue) would have occurred even in the absence of a functional connection. Peak spikes (red) are those that actually caused the cortical cell to fire. The cyan lineis the mean, and the red lines are the 99% confidence intervals, under an assumption of independent, Poisson spike trains. In this figure only, STRFs are simulated for clarity (b–g). The time-locked STRF (b) minus the baseline STRF (c; see Materials and Methods) gives an estimate of the peak, causal STRF (d). The degree to which the peak STRF differs from the average thalamic STRF is the degree to which other influences condition whether the thalamic spikes are propagated by cortex. Therefore, the peak STRF (e) minus the average thalamic STRF (f) gives a spectrotemporal description of the conditioning influence (g). Positive regions in the conditioning influence mean that for the spikes of this thalamic cell to be propagated through cortex, there must be more average energy in that region than typically drives the thalamic cell. Negative regions require that for spikes to be propagated, there must be less average energy in that region than usually drives the thalamic cell.
In the description below, it is helpful to use different notation for conventionally valued STRFs and spike-normalized STRFs. Conventional STRFs (in units of spikes per second) are denoted only with a subscript identifying the set of contributing spikes, e.g., STRFtime-locked. A conventional STRF can be normalized by the number of contributing spikes, e.g.,ntime-locked, to give a per-spike STRF distinguished with a superscript n, as in STRFntime-locked. Therefore, the conventional STRF is equal to the number of contributing spikes times the normalized STRF: STRFtime-locked =ntime-locked × STRFntime-locked.
Time-locked spikes are conceptually of two types: those that actually caused a cortical spike and those that would have occurred anyway, in the absence of any functional connection. In reference to the correlogram features with which they are associated (Fig.3a), the former are termed peak spikes, and the latter are termed baseline spikes. Although we had no independent means of identifying which time-locked spikes were peak and which were baseline, we knew, however, how many of each there were (nthal.peak andnbaseline), and we could estimate their STRFs. Because STRF derivation is a linear operation, the time-locked STRF minus an estimate of the baseline STRF yields the peak STRF.
An estimate for the baseline STRF must reflect the properties of such time-locked but noncausal spikes. First, baseline spikes are very similar to the average thalamic spikes. Therefore, one contribution to the baseline STRF is simply the average thalamic STRF. But baseline spikes have additional properties by virtue of their temporal proximity to cortical spikes and may consequently represent the cortical STRF to varying degrees. To approximate these characteristics, a control STRF was constructed from fabricated thalamic spikes, randomly timed to precede actual non-time-locked cortical spikes by the same interspike interval range as the time-locked thalamic spikes (1–10 msec). The control STRF thus takes into account response variability, temporal modulation preference, and other firing properties of the cortical cell that can affect how much of the cortical STRF is parasitically represented by time-locked thalamic spikes. Because each baseline spike combines the properties of both an average thalamic spike and a control spike, and because these effects are independent, a baseline spike is characterized simply by the spike-normalized addition of the two effects. We therefore estimate the baseline STRF by adding a spike-normalized average thalamic STRF to a spike-normalized control STRF: STRFnbaseline = STRFnthalamus + STRFncontrol. This yields a spike-normalized baseline STRF, which when multiplied by the number of baseline spikes gives an estimate for the total baseline STRF: STRFbaseline =nbaseline × STRFnbaseline. When we tested this procedure in several functionally unconnected pairs that have no peak, the baseline estimate tended to match the time-locked STRF extremely well, thereby corroborating the method.
The peak STRF is simply the time-locked STRF minus the baseline STRF: STRFthal.peak = STRFtime-locked − STRFbaseline. It describes the response properties of those thalamic spikes that presumably caused cortical spikes, and it may or may not be the same as the average thalamic STRF. The difference between the two, on a spike-normalized basis, is the conditioning influence STRF: STRFnconditioning = STRFnthal.peak − STRFnthalamus.
Cortical peak STRFs were computed for STRF-based contribution (see Contribution below) in exactly the same manner as thalamic peak STRFs, except with cortical rather than thalamic spikes.
Contribution. Intuitively, contribution approximates the proportion of the activity of a cortical cell that is caused by a thalamic input. Traditional contribution (Levick et al., 1972) was computed under driven conditions as the percentage of cortical spikes immediately preceded by a thalamic spike (1–10 msec lag, for consistency with the analysis above), greater than expected by chance. Receptive-field-based contribution is the proportion of cortical STRF (STRFcortex) energy provided by the cortical peak STRF (STRFctx.peak), i.e., presumably caused by the thalamic cell (see Correlation-dependent STRFs above). Only the significant and non-spike-normalized STRFs were used for this procedure. Moreover, all sums are over the absolute magnitude of the STRF pixels, whether they are excitatory or inhibitory; this captures STRF energy regardless of sign. To derive STRF-based contribution, we summed all pixels in STRFctx.peak with the same sign as the corresponding pixels in STRFcortex (a sum abbreviated here as Σsame). We then summed all pixels in STRFctx.peak with the opposite sign as those in STRFcortex(Σopp). Finally, subtracting the opposite-sign sum from the same-sign sum and dividing by the total pixel sum of STRFcortex (Σall) gives the STRF-based contribution: ContributionSTRF = (Σsame ‖ STRFctx.peak‖ − Σopp ‖ STRFctx.peak ‖)/Σall‖ STRFcortex ‖. Thus, we essentially add all positive input, subtract all negative input, and divide by the total output to give the proportion of cortical STRF presumably caused by the thalamic cell. STRF-based contribution could therefore be negative if strong overlap of opposite sign occurs.
Unlike the traditional measure, we can also evaluate the specific contribution of those STRF regions where both STRFctx.peak and STRFcortexare excitatory or where they are both inhibitory. Again, the sums are over the absolute magnitude of pixels, whether they are excitatory or inhibitory. This isolates the amount of contribution only where the input has matching sign and matching spectrotemporal extent as the output (a sum denoted by Σsame+ for excitatory subfields). Thus, STRF-based excitatory-only contribution for this restricted spectrotemporal range is ContributionSTRF+ = Σsame+ ‖ STRFctx.peak‖/Σsame+ ‖ STRFcortex‖. The inhibitory contribution is evaluated in the same way, with the corresponding range of inhibitory overlap.
RESULTS
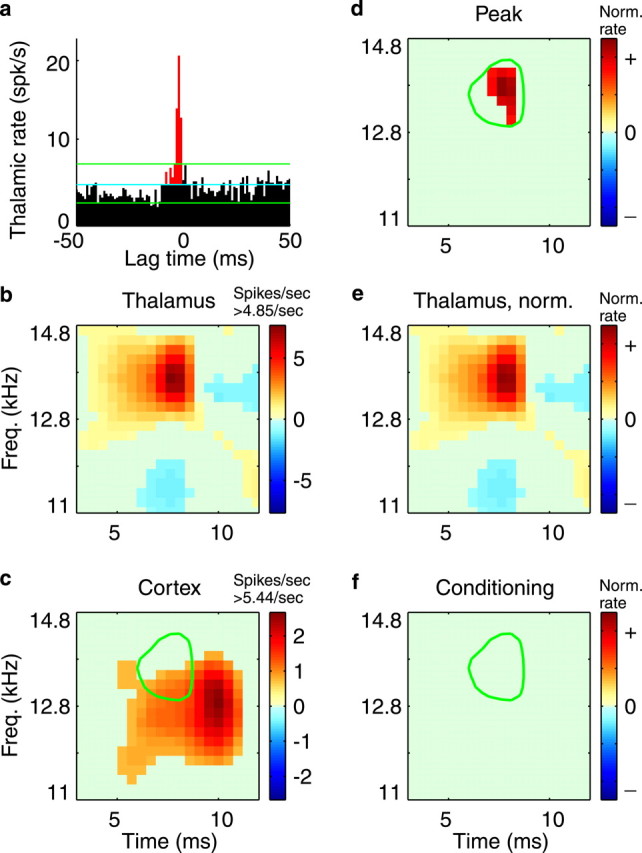
Functionally connected thalamocortical cell pairs are characterized by a sharp, short-latency peak in the cross-correlogram of their action potentials (Fig.1a). Their STRFs always show some degree of overlap in frequency and time (Fig. 1b,c). The correlogram expresses the thalamic firing rate as a function of its temporal relationship to a cortical spike. For instance, the sharp peak at −2 msec (Fig. 1a) means that the thalamic cell fires 2 msec before a cortical spike much more often than expected. Conversely, whenever the thalamic cell fires, the cortical cell is more likely to fire 2 msec later. From the correlogram, we can identify the subset of thalamic spikes that could have caused a cortical spike. Considering axonal delays and synaptic integration (Usrey et al., 2000), the potentially causal thalamic spikes are those preceding a cortical spike by ∼1–10 msec (Fig. 1a, yellow box), labeledTime-locked spikes.
Fig. 1.

Functionally connected thalamocortical pair.a, The cross-correlogram is normalized to express the thalamic firing rate relative to a cortical spike occurring at time lag 0. The brief, short-latency peak, with thalamic spikes leading cortical (2 msec), is indicative of a monosynaptic-like functional connection. The yellow box denotes the time-locked thalamic spikes that precede a cortical spike by 1–10 msec. The cyan line is the mean, and the green lines are the 99% confidence intervals, under an assumption of independent, Poisson spike trains. b, Thalamic STRF. Thex-axis represents time preceding a spike, and they-axis represents stimulus frequency. STRFcolor indicates a differential change in firing rate from the occurrence of stimulus energy in a particular spectrotemporal location. Warm colors mean that stimulus energy at that location tends to increase firing rate above the mean (4.85 spikes/sec), and cool colors indicate a decrease in firing rate. This cell, for instance, fires maximally 7.5 msec after stimulus energy occurs at 13–14 kHz. c, Cortical STRF. Overlying the cortical STRF, for comparison, is a green contour circumscribing the high-energy peak of the thalamic STRF. If one would shift the green contour by the 2 msec lag seen in the correlogram, these STRFs would overlap very well.
Feature selectivity
Conceivably the time-locked, potentially causal thalamic spikes could represent stimuli in an average way. Alternately, they may carry more or less information than the average spikes. One way to establish how much information a set of spikes transmits is to determine how selective the spikes are for stimulus features. Therefore, to evaluate any differences in information carried by time-locked versus average thalamic spikes, we computed an FSI for each set. The FSI measures feature selectivity by quantifying the variability of stimulus features that caused cortical or thalamic spikes. Presumably, a neuron that is perfectly selective for a particular stimulus feature responds if and only if the stimulus perfectly matches the STRF of the neuron. Therefore, the shape of the stimulus patterns that would activate such a neuron is consistently preserved from spike to spike. Such a neuron has zero variability and an FSI of 1; a randomly firing neuron, on the other hand, has an FSI equal to 0. FSIs for real neurons fall somewhere between these extremes. Overall, time-locked thalamic spikes have a higher FSI than the average spikes (0.37 vs 0.28; paired ttest, p = 0.011). The relative difference in FSI can be expressed as percent change, and the distribution is shown as a histogram (Fig. 2). Many cells are grouped near 0, indicating no difference in feature selectivity; a few show a decreased FSI; and many more show increased selectivity, up to fourfold in magnitude. Time-locked spikes have a 65% greater mean feature selectivity than average spikes (paired t test,p = 0.013). Potentially causal thalamic spikes tend to be significantly more selective than average spikes for spectrotemporal stimulus features contained in the dynamic ripple sound.
Fig. 2.

Potentially causal thalamic spikes are more selective for stimulus features than expected. The differences in FSI for all thalamic cells between time-locked and average spikes are summarized in a histogram. Positive differences indicate that time-locked spikes have a greater FSI than average. Many cells show very little difference; a few have a negative difference, indicating that time-locked spikes are less selective than average; and many show a positive difference, up to fourfold greater. The mean difference of 65% is significantly different from 0 (paired t test,p = 0.013); that is, time-locked thalamic spikes tend to be more selective than average for spectrotemporal stimulus features.
Conditioning influence
The increase in feature selectivity for time-locked spikes suggests that other inputs influence whether a the spikes of a thalamic cell are propagated by the cortical cell. Although all the thalamic spikes impinge on the cortical cell, only some are propagated. If thalamic spikes were passed through cortex randomly with respect to the stimulus, there would be no difference in FSI for the time-locked subset. Evidently for many cells, however, spikes are not propagated at random. Rather, they are passed through cortex in a unique, stimulus-dependent manner. Other inputs must interact with the cortical cells to set stimulus-dependent conditions on whether thalamic spikes are propagated.
We can determine the spectrotemporal nature of these net conditioning inputs by comparing the estimated STRF for thalamic spikes that cause a cortical spike with the average thalamic STRF (Fig.3). Time-locked, potentially causal thalamic spikes are conceptually of two types: those that cause a cortical cell to fire and those that occur at random. The causal spikes would be found in the peak of the cross-correlogram, and the random or baseline spikes would be found below the peak (Fig. 3a). Baseline spikes would have occurred in temporal proximity to cortical spikes even in the absence of a functional connection. Although we cannot determine which particular spikes belong in the peak and which belong in the baseline, we can estimate net STRFs for each subset. By subtracting a weighted estimate of the baseline STRF (Fig.3c; see Materials and Methods) from the time-locked STRF (Fig. 3b), we obtain an estimate of the peak, or causal STRF (Fig. 3d). The degree to which the peak STRF (Fig.3e) differs from the average thalamic STRF (Fig.3f) shows the stimulus-dependent conditions that must be satisfied for a thalamic spike to be propagated by the cortical cell; that is, it shows the net spectrotemporal conditioning influence of other inputs on whether the spikes of this thalamic cell cause a cortical spike (Fig. 3g). A positive region in the conditioning STRF indicates that for a thalamic spike to be propagated by cortex, there must be more energy at that spectrotemporal location than would, on average, cause the thalamic cell to fire. Negative energy in the conditioning STRF means that for a thalamic spike to be propagated, there must be less stimulus energy than would, on average, cause the thalamic cell to fire.
The conditioning influence is derived for a functionally connected thalamocortical pair in Figure 4. This thalamic cell appears to contribute to the upper frequency region of the cortical STRF (Fig. 4b,c). To aid interpretation, only the significant (p < 0.002) STRFs are plotted. In deriving the peak and conditioning STRFs, however, all operations were performed on the raw, nonthresholded signals. In this case, the peak, or causal STRF (Fig. 4d) is of similar magnitude and spectrotemporal location as the rate-normalized, average thalamic STRF (Fig. 4e). The two are similar enough that when the average STRF is subtracted from the peak, only noise remains, so no significant features result in the conditioning STRF (Fig. 4f). For this thalamic cell, there is no conditioning influence; i.e., the thalamic spikes cause cortical spikes at random with respect to the stimulus. No stimulus-related conditions affect whether the thalamic spikes are propagated.
When conditioning influence is present, it may be specifically cooperative (Fig.5a–f). For this cell, the peak STRF (Fig. 5d) is considerably stronger but of the same sign as the average thalamic STRF (Fig. 5e). Therefore the conditioning influence (Fig. 5f) potentiates what the thalamic cell represents on average. The conditioning is not perfectly matched, because its influence increases the thalamic input in the lower range of its excitatory frequencies, at the expense of higher frequencies. Nevertheless, for the spikes of this thalamic cell to cause a spike in the cortex, both excitatory and inhibitory stimulus features must be increased in average magnitude. In other words, not only do conditioning inputs demand a narrower range of excitatory stimulus frequencies, but over the course of the stimulus their influence helps a thalamic STRF of effectively greater contrast propagate through cortex.
The conditioning influence need not cooperate with the average receptive field of the thalamic unit. Sometimes the conditioning is thoroughly antagonistic (Fig. 5g–l). In this case, the peak STRF (Fig. 5j) is much more limited in spectrotemporal extent than the average thalamic STRF (Fig.5k), and the conditioning influence (Fig.5l) has a negative, or opposite-signed, influence on the thalamic input. This net inhibitory influence on the thalamic STRF pares it down to a more restricted spectrotemporal range. The negative region of the conditioning does not mean that there must be a lack of energy in the stimulus for thalamic spikes to be propagated. It is a relative measure; for spikes to pass through cortex, there must be less average energy at that spectrotemporal location than the average stimulus that causes the thalamic cell to fire. The conditioning works against or antagonizes what the thalamic cell is doing independently.
Conditioning influence versus feature selectivity
If conditioning influences, as hypothesized, affect the feature selectivity of time-locked spikes, then there may be a systematic relationship between the cooperativity of conditioning and change in FSI. For example, cooperation might tend to smear thalamic spectrotemporal inputs, thereby degrading their FSI, whereas antagonism may increase FSI through selective culling, or perhaps cooperative and antagonistic conditioning both increase FSI.
To quantify the net conditioning effect on the thalamic input, we computed a correlation coefficient, the similarity index (DeAngelis et al., 1999), between the conditioning STRF and the original thalamic STRF. The similarity index compares only the shapes of the STRFs, not their absolute magnitudes. STRFs with identical shapes and signs have a similarity index of 1; those with identical shapes but opposite signs have a similarity index equal to −1; and STRFs that are uncorrelated have a similarity index of 0. In terms of conditioning influence, then, positive similarity indices indicate cooperation, and negative indices indicate antagonism. For each cell, we compared the similarity index with the difference in FSI between time-locked and average thalamic spikes (Fig.6). Most cells show little net conditioning influence. Some of these had no conditioning STRF, and others had a non-zero conditioning STRF uncorrelated with that of the thalamic cell. Approximately one-fourth to one-third of cells show conspicuous (∼0.2 or greater in similarity index magnitude) net conditioning effects, with antagonism almost as likely as cooperation. The net conditioning effect is uncorrelated with the firing rates of the cells, as measured within a neural station (thalamic rate mean, 10.3 spikes/sec; cortical rate mean, 4.8 spikes/sec; each uncorrelated with conditioning, p > 0.5) or in relative terms (thalamic divided by cortical rates; uncorrelated with conditioning,p > 0.2). There is, however, a positive correlation between the similarity index and the difference in FSI (r = 0.50 ± 0.19 SE; 0.01 <p < 0.02). Cooperative conditioning tends to increase the feature selectivity of the thalamic spikes that are propagated through cortex, and antagonistic conditioning tends to decrease it.
Fig. 6.

Relationship between the cooperativity of conditioning influence and the difference in feature selectivity for potentially causal spikes. The similarity index for the conditioning influence and the average thalamic STRF indicates the degree of cooperation (positive values) or antagonism (negative values). The FSI difference between time-locked, potentially causal spikes and average spikes quantifies how much more or less stimulus information the time-locked spikes carry. Similarity index and FSI differences are significantly and positively correlated (r = 0.50; 0.01 <p < 0.02). The dashed line is the best fit in a least mean squares sense. Asterisks are pairs from Figures 4 and 5. Cooperative conditioning influences tend to increase the feature selectivity of time-locked spikes, and antagonistic conditioning tends to decrease it.
Thalamocortical contribution
With STRFs from distinct subsets of spikes, we can estimate the strength of functional thalamic input to a particular cortical cell. Traditionally, one would use a measure called contribution, the percentage of cortical spikes preceded by the spikes of a thalamic cell, above that expected. This spike-based contribution ideally has no relationship to the stimulus-response properties of the cells and thus simply estimates how many inputs it would take to make the cortical cell fire. In contrast, an STRF-based measure of contribution estimates what proportion of the receptive field of the cortical cell can be attributed to a given thalamic cell (for details, see Materials and Methods).
Overall, the traditional and receptive-field-based contributions are similar in mean (traditional, 4.5%; STRF-based, 3.4%) but less so in median (traditional, 2.6%; STRF-based, 0.9%). They are not significantly correlated (r = 0.28 ± 0.21 SE;p > 0.1); therefore, for each thalamocortical pair, the traditional contribution may differ substantially from the STRF-based measure. In addition to revealing the amount of functional, as opposed to numerical, input a cortical cell receives, STRF-based contribution can be evaluated for excitatory and inhibitory stimulus–response features separately. In this way, we can isolate only those areas where the cortical peak (caused by thalamus) and average cortical STRFs overlap and have the same sign. Excitatory thalamic subfields contribute twice as much as inhibitory subfields (mean, 5.3 vs 2.7%; paired t test, p = 0.025) to overlapping, sign-matched cortical STRF regions.
DISCUSSION
By evaluating spikes on the basis of their fine temporal relationships, we demonstrate that potentially causal thalamic spikes may differ from average spikes in their selectivity for spectrotemporal stimulus features. We also illustrate for the first time how receptive field information passed from thalamic to cortical cells is modified by other inputs. The spectrotemporal cooperativity or antagonism of these conditioning inputs partly accounts for the difference in feature selectivity between potentially causal and average thalamic spikes.
Previous work shows that thalamic activity can be more efficacious in causing cortical spikes when it occurs synchronously with other thalamic inputs (Alonso et al., 1996; Usrey et al., 2000; Roy and Alloway, 2001). Our report builds on those observations by quantifying whether potentially causal thalamic activity, time-locked to cortical spikes, transmits more or less information about the stimulus than average. We assess this difference for each thalamic cell by comparing the feature selectivity indices for potentially causal versus average spikes. Although many cells show no difference in FSI, and a few show a decrease, across all thalamic cells there is a greater mean feature selectivity for potentially causal spikes; that is, potentially causal thalamic spikes tend to carry more receptive field information than average. This is a significant conceptual extension of previous studies, which considered time-locked spikes for their efficacy rather than their role in transmitting information.
As described in the introductory remarks, differences in feature selectivity suggest that additional, stimulus-conditioned inputs influence whether the spikes of a thalamic cell are propagated through cortex. Because feature selectivity depends on receptive field idiosyncrasies, these conditioning influences should differ spectrotemporally from the preferences of the thalamic cell. We therefore developed a method to identify the spectrotemporal nature of these near-simultaneous conditioning inputs, based on receptive field shapes. Some have little in common with the response properties of the thalamic cell, some are cooperative, and some are antagonistic. One cannot predict solely from the overlap between thalamic and cortical STRFs which sort of influence is present. Our results therefore provide a key complement to work within thalamus (Dan et al., 1998) and within cortex (Ghose et al., 1994; Reich et al., 2000) on the relationship between action potential timing and specific receptive field properties.
To demonstrate a relationship between conditioning influence and feature selectivity, we compared the cooperativity of the influence with the FSI difference between potentially causal and average spikes. They are significantly correlated; cooperative conditioning tends to increase the feature selectivity, and antagonistic conditioning tends to decrease it. We thus explain not only how much more or less information potentially causal spikes carry but also for exactly what stimulus-related purpose.
A related way to view these results is in terms of the signal-to-noise ratio at the cortical level. Cortical cells average the inputs of many thalamic cells, only one of which we recorded during a given experimental epoch. Our observations show that the conditioning influence of other inputs may be functionally associated with the response preferences of this thalamic cell. Cooperation among functionally related inputs leads to an increase in the signal-to-noise ratio at the cortical neuron, and antagonism leads to a decrease.
A topic closely related to conditioning influence is the degree of functional thalamocortical convergence. Traditional and STRF-based measures of contribution estimate the amount of activity and the receptive field of a cortical cell, respectively, that can be attributed to a given input. Contribution thereby enables estimates of thalamocortical convergence, or how many thalamic cells might synapse strongly onto a cortical cell. A contribution of 5%, say, would lead one to estimate that 20 thalamic cells could fully activate a cortical cell. Traditional contribution (mean, 4.5%; median, 2.6%) would thus lead to an estimate of ∼20–40 thalamic inputs per cortical cell, and STRF-based contribution (mean, 3.4%; median, 0.9%) would lead to an estimate of ∼30–100. Because cooperation exists among inputs, however, both traditional and STRF-based methods tend to overestimate contribution and therefore underestimate the degree of convergence. Nevertheless, our estimates of traditional convergence based on spike numbers alone agree with those in the visual system, in which ∼30 thalamic cells significantly affect the activity of a cortical cell (Reid and Alonso, 1995). Our estimates based on STRF contribution, on the other hand, are considerably higher. The traditional and STRF-based measures, moreover, are uncorrelated. Because some spikes carry more information than others, one cannot determine from spike numbers alone how much receptive field energy a given input contributes. Unlike the traditional measure, STRF-based contribution can also compare excitatory and inhibitory receptive field inputs. Considering only areas where input–output STRF overlaps have the same sign, a profound imbalance exists, because excitatory subfields contribute twice as much as inhibitory subfields. The typical thalamic inputs, therefore, need to be supplemented by additional inhibition to create a full cortical STRF. This additional inhibition would presumably be fast feedforward and intracortical in origin (Swadlow and Gusev, 2000).
Several factors qualify the interpretation of our data. First, the STRF is a linear descriptor with respect to the spectrotemporal envelope of the stimulus. Therefore, the STRF-based measures we used, including the FSI and similarity index, may be insensitive to certain stimulus–response nonlinearities. The strong and consistent relationship, however, between STRFs and functional thalamocortical connectivity suggests that if stimulus–response nonlinearities play a role, it is relatively minor (Miller et al., 2000). We would also emphasize that we recorded in the anesthetized animal. Thalamocortical interactions may differ in the awake animal, especially with regard to the dynamic state and corticothalamic feedback of the brain (Fanselow and Nicolelis, 1999; Suga et al., 2000; Wörgötter and Eysel, 2000). Nevertheless, because the conditioning influence we report is virtually simultaneous with short-latency monosynaptic thalamic input, it is unlikely that multisynaptic feedback would have a large effect on our results.
Our observations point to a number of directions for further study. For instance, we treated only a composite of presumed causal spikes, expressed in the peak STRF. It would be illuminating to distinguish precisely which time-locked thalamic spikes caused cortical spikes. Also, our conditioning influences are net effects of unknown origin. Other methods could help identify the sources of conditioning influence, whether thalamic or intracortical, and perhaps discriminate how spike patterns among inputs or within a single input (Usrey et al., 2000; Swadlow and Gusev, 2001) affect receptive field construction. Finally, it would be interesting to reveal whether and how behavioral state changes affect the degree or type of conditioning influence. The present report provides a basis for future work by introducing novel methods to quantify the detailed, functional transformation from one neuron to another.
Footnotes
This work was supported by National Institutes of Health Grants DC02260 and NS34835, National Science Foundation Grant NSF97203398, and the Whitaker Foundation.
Correspondence should be addressed to Lee M. Miller, 3210 Tolman Hall #1650, Department of Psychology, University of California, Berkeley, CA 94720-1650. E-mail: lmiller@socrates.berkeley.edu.
REFERENCES
- 1.Aertsen AMHJ, Johannesma PIM. Spectro-temporal receptive fields of auditory neurons in the grassfrog. Biol Cybern. 1980;38:223–234. doi: 10.1007/BF00342772. [DOI] [PubMed] [Google Scholar]
- 2.Alonso JM, Usrey WM, Reid RC. Precisely correlated firing in cells of the lateral geniculate nucleus. Nature. 1996;383:815–819. doi: 10.1038/383815a0. [DOI] [PubMed] [Google Scholar]
- 3.Cotillon N, Nafati M, Edeline JM. Characteristics of reliable tone-evoked oscillations in the rat thalamo-cortical auditory system. Hear Res. 2000;142:113–130. doi: 10.1016/s0378-5955(00)00016-2. [DOI] [PubMed] [Google Scholar]
- 4.Creutzfeldt O, Hellweg FC, Schreiner CE. Thalamocortical transformation of responses to complex auditory stimuli. Exp Brain Res. 1980;39:87–104. doi: 10.1007/BF00237072. [DOI] [PubMed] [Google Scholar]
- 5.Dan Y, Alonso JM, Usrey WM, Reid RC. Coding of visual information by precisely correlated spikes in the lateral geniculate nucleus. Nat Neurosci. 1998;1:501–507. doi: 10.1038/2217. [DOI] [PubMed] [Google Scholar]
- 6.DeAngelis GC, Ghose GM, Ohzawa I, Freeman RD. Functional micro-organization of primary visual cortex: receptive field analysis of nearby neurons. J Neurosci. 1999;19:4046–4064. doi: 10.1523/JNEUROSCI.19-10-04046.1999. [DOI] [PMC free article] [PubMed] [Google Scholar]
- 7.Eggermont JJ. Stimulus induced and spontaneous rhythmic firing of single units in cat primary auditory cortex. Hear Res. 1992;61:1–11. doi: 10.1016/0378-5955(92)90029-m. [DOI] [PubMed] [Google Scholar]
- 8.Escabí MA, Schreiner CE, Miller LM. Dynamic time-frequency processing in the cat auditory midbrain, thalamus, and auditory cortex: spectrotemporal receptive fields obtained using dynamic ripple spectra. Soc Neurosci Abstr. 1998;24:1879. [Google Scholar]
- 9.Escabí MA, Miller LM, Read HL, Osborne LC, Schreiner CE. Response specificity to dynamic ripple and ripple noise stimuli: neuronal selectivity in the auditory midbrain, thalamus, and cortex. Soc Neurosci Abstr. 2000;26:358.2. [Google Scholar]
- 10.Fanselow EE, Nicolelis MA. Behavioral modulation of tactile responses in the rat somatosensory system. J Neurosci. 1999;19:7603–7616. doi: 10.1523/JNEUROSCI.19-17-07603.1999. [DOI] [PMC free article] [PubMed] [Google Scholar]
- 11.Ghose GM, Ohzawa I, Freeman RD. Receptive-field maps of correlated discharge between pairs of neurons in the cat's visual cortex. J Neurophysiol. 1994;71:330–346. doi: 10.1152/jn.1994.71.1.330. [DOI] [PubMed] [Google Scholar]
- 12.Klein DJ, Depireux DA, Simon JZ, Shamma SA. Robust spectrotemporal reverse correlation for the auditory system: optimizing stimulus design. J Comp Neurosci. 2000;9:85–111. doi: 10.1023/a:1008990412183. [DOI] [PubMed] [Google Scholar]
- 13.Kowalski N, Depireux DA, Shamma SA. Analysis of dynamic spectra in ferret primary auditory cortex. I. Characteristics of single-unit responses to moving ripple spectra. J Neurophysiol. 1996;76:3503–3523. doi: 10.1152/jn.1996.76.5.3503. [DOI] [PubMed] [Google Scholar]
- 14.Levick WR, Cleland BG, Dubin MW. Lateral geniculate neurons of cat: retinal inputs and physiology. Invest Ophthalmol. 1972;11:302–311. [PubMed] [Google Scholar]
- 15.Lewicki MS. Bayesian modeling and classification of neural signals. Neural Comput. 1994;6:1005–1030. [Google Scholar]
- 16.Miller LM, Schreiner CE. Stimulus-based state control in the thalamocortical system. J Neurosci. 2000;20:7011–7016. doi: 10.1523/JNEUROSCI.20-18-07011.2000. [DOI] [PMC free article] [PubMed] [Google Scholar]
- 17.Miller LM, Escabí MA, Read HL, Schreiner CE. Functional convergence and divergence in the auditory thalamocortical system. Soc Neurosci Abstr. 2000;26:358.3. [Google Scholar]
- 18.Perkel DH, Gerstein GL, Moore GP. Neuronal spike trains and stochastic point processes. II. Simultaneous spike trains. Biophys J. 1967;7:419–440. doi: 10.1016/S0006-3495(67)86597-4. [DOI] [PMC free article] [PubMed] [Google Scholar]
- 19.Reich DS, Mechler F, Purpura KP, Victor JD. Interspike intervals, receptive fields, and information encoding in primary visual cortex. J Neurosci. 2000;20:1964–1974. doi: 10.1523/JNEUROSCI.20-05-01964.2000. [DOI] [PMC free article] [PubMed] [Google Scholar]
- 20.Reid RC, Alonso J-M. Specificity of monosynaptic connections from thalamus to visual cortex. Nature. 1995;378:281–284. doi: 10.1038/378281a0. [DOI] [PubMed] [Google Scholar]
- 21.Roy SA, Alloway KD. Coincidence detection or temporal integration? What the neurons in somatosensory cortex are doing. J Neurosci. 2001;21:2462–2473. doi: 10.1523/JNEUROSCI.21-07-02462.2001. [DOI] [PMC free article] [PubMed] [Google Scholar]
- 22.Schreiner CE, Calhoun BM. Spectral envelope coding in cat primary auditory cortex: properties of ripple transfer functions. Aud Neurosci. 1994;1:39–61. [Google Scholar]
- 23.Suga N, Gao E, Zhang Y, Ma X, Olsen JF. The corticofugal system for hearing: recent progress. Proc Natl Acad Sci USA. 2000;97:11807–11814. doi: 10.1073/pnas.97.22.11807. [DOI] [PMC free article] [PubMed] [Google Scholar]
- 24.Swadlow HA, Gusev AG. The influence of single VB thalamocortical impulses on barrel columns of rabbit somatosensory cortex. J Neurophysiol. 2000;83:2802–2813. doi: 10.1152/jn.2000.83.5.2802. [DOI] [PubMed] [Google Scholar]
- 25.Swadlow HA, Gusev AG. The impact of “bursting” thalamic impulses at a neocortical synapse. Nat Neurosci. 2001;4:402–408. doi: 10.1038/86054. [DOI] [PubMed] [Google Scholar]
- 26.Tanaka K. Cross-correlation analysis of geniculostriate neuronal relationships in cats. J Neurophysiol. 1983;49:1303–1318. doi: 10.1152/jn.1983.49.6.1303. [DOI] [PubMed] [Google Scholar]
- 27.Usrey WM, Alonso JM, Reid RC. Synaptic interactions between thalamic inputs to simple cells in cat visual cortex. J Neurosci. 2000;20:5461–5467. doi: 10.1523/JNEUROSCI.20-14-05461.2000. [DOI] [PMC free article] [PubMed] [Google Scholar]
- 28.Wörgötter F, Eysel UT. Context, state and the receptive fields of striatal cortex cells. Trends Neurosci. 2000;23:497–503. doi: 10.1016/s0166-2236(00)01632-5. [DOI] [PubMed] [Google Scholar]