

Abstract
In most manipulations, we use our fingertips to apply time-varying forces to the target object in controlled directions. Here we used microneurography to assess how single tactile afferents encode the direction of fingertip forces at magnitudes, rates, and directions comparable to those arising in everyday manipulations. Using a flat stimulus surface, we applied forces to a standard site on the fingertip while recording impulse activity in 196 tactile afferents with receptive fields distributed over the entire terminal phalanx. Forces were applied in one of five directions: normal force and forces at a 20° angle from the normal in the radial, distal, ulnar, or proximal directions. Nearly all afferents responded, and the responses in most slowly adapting (SA)-I, SA-II, and fast adapting (FA)-I afferents were broadly tuned to a preferred direction of force. Among afferents of each type, the preferred directions were distributed in all angular directions with reference to the stimulation site, but not uniformly. The SA-I population was biased for tangential force components in the distal direction, the SA-II population was biased in the proximal direction, and the FA-I population was biased in the proximal and radial directions. Anisotropic mechanical properties of the fingertip and the spatial relationship between the receptive field center of the afferent and the stimulus site appeared to influence the preferred direction in a manner dependent on afferent type. We conclude that tactile afferents from the whole terminal phalanx potentially contribute to the encoding of direction of fingertip forces similar to those that occur when subjects manipulate objects under natural conditions.
Keywords: microneurography, human hand, cutaneous mechanoreceptors, fingertip force, directional sensitivity, tactile afferents
In dexterous manipulation, humans apply fingertip forces to target objects with precisely controlled directions and intensities. Although signals in tactile afferents from the fingertips play a crucial role in the control of manipulative actions (Mott and Sherrington, 1895; Moberg, 1962; Johansson and Westling, 1984, 1987; Johansson et al., 1992; Jenmalm and Johansson, 1997; Jenmalm et al. 2000), little is known about the encoding of fingertip forces by tactile sensors. Most previous studies of tactile sensibility in humans and other primates have focused on issues related to sensory perception in the context of exploratory tactile tasks. These studies typically addressed the spatiotemporal encoding of fine tactile patterns that indented the skin or were scanned across the fingertips with low contact forces. Stimuli that have been used include curved surfaces, Braille-like patterns, and raised dot arrays, gratings, and brush stimuli (Vallbo and Johansson, 1984; Srinivasan et al., 1990; Johnson and Hsiao, 1992; Edin et al., 1995; Goodwin et al., 1997). The contact forces applied in these studies were generally an order of magnitude lower than forces applied during common manipulations. Previous studies directly concerned with manipulation primarily addressed responses in human tactile afferents in relation to discrete motor control events and did not systematically address the capacity of the afferents to encode fingertip forces. Nevertheless, observations were made suggesting that tactile afferents can encode the direction of fingertip force (Westling and Johansson, 1987;Macefield et al., 1996). Furthermore, it has also been shown that when stimuli move across the receptive fields of tactile afferents, the responses are different depending on the direction of movement (Goodwin and Morley, 1987; LaMotte and Srinivasan 1987; Srinivasan et al., 1990;Edin et al., 1995). Directionality of tactile afferent responses most likely results from different strains produced at the receptor site when forces are applied in different directions. In the case of the fingertip, its geometry and composite material properties may account for widespread complex patterns of strain changes that depend on the direction of the applied force (Maeno et al., 1998). Consequently, the site of stimulation, the location of the receptor in the fingertip per se as well as in relation to the stimulation site, and possible inherent directional preferences of the end-organ attributable to its microanatomy, all could contribute to the directionality of an afferent.
In the present study, we examined the encoding of direction of fingertip force by the various types of tactile afferents using forces comparable to those arising during natural manipulations. We applied forces in different directions to a standard site at the fingertip and obtained a picture of the population response by recording signals in a representative sample of afferents innervating the entire phalanx (Johnson, 1974; Khalsa et al., 1998). Our study primarily addressed the fingertip as a sensory organ without the immediate goal of explaining mechanisms involved in encoding of force stimuli. We do report, however, some observations regarding relationships between directionality and the spatial relationship between receptor locations and the stimulus site and between directionality and anisotropic properties of the fingertip.
MATERIALS AND METHODS
Subjects and general procedure
Thirty-three healthy human subjects (21 females and 12 males; ages 19–30 years) participated in the experiments. The study was approved by the local ethics committee at Umeå University, and subjects gave their informed consent in accordance with the Declaration of Helsinki. Each subject reclined comfortably in a dentist's chair with the right upper arm abducted ∼30°, the elbow extended to ∼120°, and the hand supinated (Fig.1A). A vacuum cast immobilized the forearm, and Velcro strips around the wrist provided additional fixation. The fingers of the right hand were splayed, and the dorsal aspect of the hand was embedded in plasticine up to the midlevel of the middle phalanges of the digits. To stabilize the distal phalanges, the nails of the index, middle, and ring fingers were glued to metal plates, each of which was firmly fixed to a post sunk into the plasticine. The skin of the distal phalanges of these three digits did not contact the plasticine, thereby allowing the fingertip to deform as it might if it were actively pressed against a surface (see further below). For additional stability, the thumb and little finger were immobilized by U-shaped aluminum clamps anchored to the plasticine.
Fig. 1.

Electromechanical stimulator. A, The supporting frame, with one rotational and three linear stepping motors, allowed the stimulus surface to be positioned at the chosen stimulation points on the digits. B, The stimulator was built on three linear motors coupled via rods and a common rotational joint to a force/torque transducer terminating in the stimulus surface.C, Details of one of the linear motors and its position transducer.
Nerve recordings
Impulses were recorded from single tactile afferents with tungsten needle electrodes inserted percutaneously into the median nerve, ∼10 cm proximal to the elbow (Vallbo and Hagbarth, 1968). To guide the recording electrode toward tactile afferents innervating the distal phalanges of the right index, middle, or ring fingers, one experimenter continuously stimulated the distal phalanges of these fingers by gently stroking and pressing the skin. Once an afferent was isolated, calibrated nylon filaments (von Frey hairs) were used to outline its receptive field, defined as the region of skin from which a response could be elicited by a force four times the threshold force at the most sensitive zone in the receptive field (Johansson et al., 1980). For spontaneously active afferents, the threshold force was defined as the smallest value that produced a clear modulation of the ongoing activity.
The afferents were classified as fast adapting type I (FA-I), fast adapting type II (FA-II), slowly adapting type I (SA-I), and slowly adapting type II (SA-II) according to criteria described previously (Johansson and Vallbo, 1983; Vallbo and Johansson, 1984). Briefly, FA afferents responded only to changes in skin deformation, whereas the SA afferents showed an ongoing response during periods of static skin deformation. The type I afferents (FA-I and SA-I) possessed small and well delineated receptive fields, whereas the receptive fields of the type II afferents (FA-II and SA-II) were large and poorly defined. FA-II afferents were excited by remote mechanical stimulation, such as percussion of adjacent digits, and SA-II afferents responded to planar skin stretch applied at sites remote from the receptive field as defined by point indentations of the skin. Moreover, the SA-II afferents often exhibited an ongoing discharge in the absence of externally applied tactile stimuli.
Apparatus
Mechanical stimuli were delivered to the tip of the receptor-bearing finger (i.e., right index, middle, or ring finger) using a custom-built computer-controlled stimulator (Fig.1A,B) that allowed control of force or position in three dimensions. The surface that contacted the fingertip was flat and circular (diameter 30 mm) and was coated with silicon carbide grains (50–100 μm) covered with a thin layer of cyanoacrylate; the finish was similar to that of smooth sandpaper (grit ∼400). This stimulus surface was chosen to obtain sufficiently high and stable friction between the contact surface and the skin to avoid slips when the force stimuli included tangential components (see further below). The same contact surface has been used in behavioral studies addressing the control of the magnitudes and directions of fingertip forces during manipulation (Jenmalm et al., 2000).
The stimulator was built on three linear electromagnetic motors with shafts oriented in parallel (Fig. 1B). Each shaft was connected, via a two-dimensional hinge and a stiff rod, to one common connecting point. A six-axis force/torque transducer (Nano F/T transducer; ATI Industrial Automation, Garner, NC) was attached to the connecting point via a one-dimensional rotational joint that could be locked at any given angle. This rotational joint was coupled to a potentiometer that signaled the elevation angle with an accuracy of ±0.5°. The stimulus surface that contacted the skin was attached to the other end of the force/torque transducer.
The range of movement of the stimulus surface was 16 mm in the vertical plane and 35 mm in the horizontal plane, and the maximum force output in any direction was 30 N. A linear optical position transducer attached to the shaft of each motor (Fig. 1C) allowed the position of the force transducer joint to be measured with a resolution <0.6 μm (RMS). To improve the resolution and bandwidth of the force measurements, we substituted custom-made electronics for those delivered with the Nano F/T transducer, resulting in a resolution <0.9 mN (RMS) in all directions and a bandwidth of 0–2.9 kHz. The signals from the transducers were used for feedback control of position or force in three dimensions, realized by a software-based control algorithm.
To position the stimulus surface at any desired location on the hand, the supporting frame of the stimulator was built on stepping motor-controlled guides, three linear and one rotational, designed for numerically controlled milling machines (ISEL Automation KG, Eiterfeld, Germany) (Fig. 1A). The stepping motors were controlled by a microprocessor operated by the experimenter via joysticks. Ten stimulation sites could be stored in the memory of the microprocessor. The rotational stepping motor and the force transducer joint (that allowed us to tilt the stimulus surface) provided the degrees of freedom necessary to align the stimulus surface parallel to the contacted skin surface. When operated in the position control mode, the stiffness of the system, measured between the stimulus surface and the hand support, was >40 N/mm regardless of the load direction and regardless of the position of the support frame.
Stimulation site
Regardless of the location of the receptive field of the afferent recorded from, we applied the stimulus to a standard test site on the tip of the receptor-bearing finger. For each of the potential receptor-bearing fingers (index, middle, and ring finger), we defined the primary site of stimulation by the midpoint of a line extending in the proximal–distal direction from the whorl of the papillary ridges to the distal end of the fingertip (Fig.2B). This point is located approximately in the center of the flat portion of the volar surface of the fingertip. This flat portion, which can be recognized in a side projection of most fingertips (Fig. 2A), serves as a primary target for object contact in goal-directed fine manipulation of small objects and is engaged in 65–98% of “tip-to-tip” precision grips (Christel et al., 1998). Before the microelectrodes were inserted, we positioned the stimulator at each of the three standard stimulation sites and stored the stepping motor settings for rapid restoration of these positions once afferents were isolated. We oriented the stimulus surface such that it was centered at each stimulation site and was parallel to the skin surface.
Fig. 2.
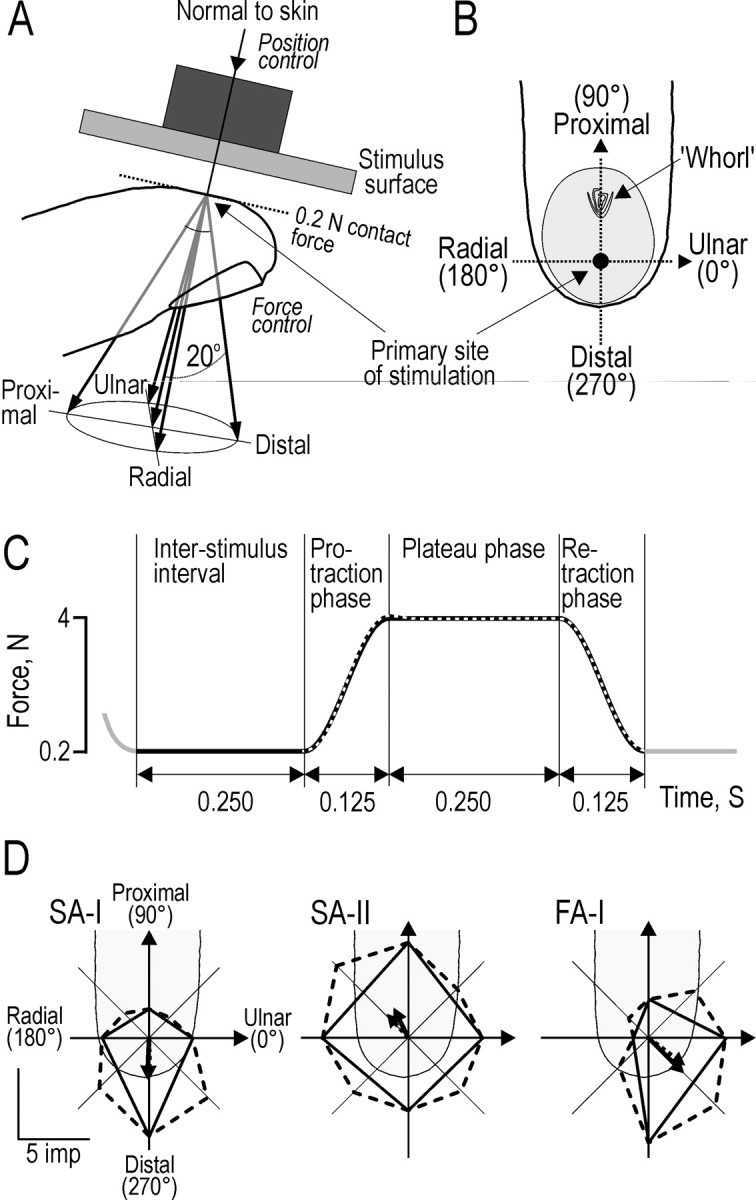
Forces applied to the fingertip in five different directions and vectorial estimation of the preferred directions of the afferents. A, The stimulus surface was oriented parallel to the flat portion of skin at the fingertip and was advanced, under position control, to contact the skin with a force of 0.2 N. Force stimuli were superimposed on this background contact force and delivered in the normal direction and at an angle 20° to the normal with tangential components in the distal, radial, proximal, and ulnar directions as indicated by the five arrows; the normal force was always 4 N. B, Outline of a generic finger showing the stimulation point (●) and the approximate skin area (shaded) in contact with the stimulus surface for a 4 N normal force. Note the polar coordinate conventions:Ulnar (0°), Proximal(90°), Radial (180°), and Distal (270°). C, Temporal profile of the applied forces. Each stimulus consisted of a protraction phase, a plateau phase, and a retraction phase. Thesolid and superimposed dashed curvesindicate the desired and actual resultant force, respectively, exemplified for a stimulus applied in the normal direction.D, Vectorial estimation of the preferred direction of afferents illustrated on polar plots for one typical afferent of each type stimulated in eight directions 45° apart (broken lines) and corresponding plots (solid lines) for only the stimuli in the distal, proximal, ulnar, and radial directions. The polar plot, overlaid on the outline of the generic finger, consists of straight lines joining the response magnitudes in each direction of stimulation measured as number of impulses during the protraction phase; the origin of the coordinate system is at the primary site of stimulation. The dashed and solid arrows indicate the preferred direction computed as the vector sum of the responses to eight and four forces, respectively.
Forces and displacements were programmed and measured in a three-dimensional Cartesian coordinate system referred to the fingertip. Normal force (Fn) and position (Pn) were measured along the axis perpendicular to the stimulus surface at its center. The other two orthogonal axes were oriented in the plane of the stimulus surface, one in the distal-proximal direction of the fingertip (Fd-p,Pd-p) and one transverse to the long axis of the finger in the radial–ulnar direction (Fr-u,Pr-u) (Fig. 2). The Cartesian coordinate transformations used angular information provided by potentiometers at the force traducer joint and at the rotational stepping motor located between the supporting frame and the stimulator (Fig. 1A,B).
Force stimuli
Our aim was to use parameters of force stimulation that were comparable to those that occur in natural manipulations. We chose forces similar to those that subjects apply when using a precision grip to lift an object weighing 250–300 gm with flat vertical grip surfaces (Johansson and Westling, 1984; Westling and Johansson, 1984). That is, at plateau phases of stimulation, the tangential load at each fingertip was ∼1.4 N, and the normal force (that corresponds to the grip force in the active task) was 4 N. Furthermore, the normal and tangential force components were constrained to change in parallel with a time course typical of force changes during the active lifting task. Importantly, in virtually all types of manipulations that require grasp stability, frictional limits require a parallel change in normal and tangential fingertip forces such that the direction of force is maintained at an approximately constant angle from the normal (Johansson and Westling, 1984; Edin et al., 1992; Flanagan and Tresilian, 1994; Flanagan et al., 1999; Johansson et al., 1999;Flanagan and Lolley, 2001).
Starting above the fingertip, the manipulator moved the stimulus surface perpendicularly, under position control, toward the stimulation site, i.e., along the Pn axis (Fig.2A). The velocity of the linear motion was constant at 10 mm/sec. After the surface contacted the skin and the normal force reached 0.2 N, the servo switched from position control to force control. Force stimuli were superimposed on this 0.2 N background contact force, and the background tangential forces were held at 0. Each stimulus consisted of a force protraction phase lasting 125 msec, a plateau phase of constant force for 250 msec, and a force retraction phase lasting 125 msec (Fig. 2C). During the protraction and retraction phases, the time course of force change followed a half-sinusoid (sine wave frequency of 4 Hz). The interval between two successive stimuli (250 msec) was equal to the duration of the plateau phase.
Two distinct stimulus sequences, with different orders of stimuli, were used; we term them the “regular sequence” and the “irregular sequence,” respectively. The regular sequence included force stimuli in five different directions. All stimuli had a plateau normal force of 4 N. Four stimuli included a tangential force component in the radial (R), distal (D), ulnar (U), or proximal (P) direction, respectively, that resulted in a force angle of 20° relative to the normal (Fig.2A). These were followed by a stimulus in the normal (N) direction only. This sequence of stimulation was repeated (n = 6). The first sequence was not analyzed so that the stimulation history was the same for all analyzed sequences (n = 5). The force angle of 20° was well within the limits of friction between the material of the stimulus surface and the skin so that there were no slips. We did not use larger angles because force angles >30° are rarely compatible with stable grasps during manipulation (Jenmalm and Johansson, 1997; Johansson and Westling, 1984). After the regular sequences, the irregular sequences were delivered to explore the effect of changes in the immediate stimulation history. The above five stimuli (R, D, U, P, N) were presented five times each in such a way that each stimulus was preceded once by each of the five stimuli. The precision (reproducibility) of the force control system was >0.08 N (RMS) for any direction of stimulation in each of the phases. During the protraction and retraction phases, the dynamics of the feedback control system introduced some systematic deviation from the half-sinusoid. At any force level, the actual force differed from the desired value by a maximum of 12%, and the nature of this difference was similar for stimuli in each force direction. The solid curve and superimposed dashed curve in Figure 2C indicate the desired and actual resultant force trajectory, respectively. Force trajectories shown in Figures 3-16 all represent actual forces.
Fig. 3.

X-ray analysis of fingertip deformations during active and passive application of fingertip forces to a flat surface.A, The fingertip contacted a horizontal lead plate, attached to a force transducer, at an angle of ∼30°. A thin lead plate, with an attached Plexiglas platform, was glued to the fingernail. In the top panel, the subject actively applied a vertical force of either 1 or 4 N, guided by visual feedback from a moving coil voltmeter display of the force transducer output. In the bottom panel, the subject relaxed while weights placed on the Plexiglas platform passively generated a vertical contact force of 1 or 4 N. Two contours of the fingertip are superimposed. Thedashed lines show the fingertip when held in the air, and the solid lines show the skin contour when contacting the plate with a force of 4 N. B, X-ray image for a second subject at a contact force of 4 N applied actively. Thelines with arrows, perpendicular to the contact surface, indicate the distances measured for analysis. The dorsal distance was measured between the proximal edge of the upper lead plate and the upper contour of the phalangeal bone. The volar distance was measured along the same vertical linebetween the lower contour of the phalangeal bone and the top edge of the lower lead plate. C, Changes in the dorsal and volar distances caused by contact forces of 1 and 4 N applied both actively and passively. Data are from two subjects.
Fig. 4.

Distribution of the receptive fields of the afferents projected on the generic fingertip (73 SA-I, 41 SA-II, and 72 FA-I). A, The center of thecircle shows the location of the receptive field center, and the area represents the number of impulses evoked during the protraction phase, averaged across all stimuli delivered during the regular sequence. Crosses indicate the location of receptive fields of afferents that did not respond. The shaded area of skin represents an estimate of the area of contact between the stimulus surface and the fingertip at a contact force of 4 N. B, Scatter plots show the relationship between responsiveness (number of impulses during the protraction phase averaged across all stimuli delivered during the regular sequence) and the shortest (straight line) distance between the primary site of stimulation and the center of the receptive field.
Fig. 5.

Responses of SA-I afferents to forces applied in the five principal directions. A, Responses of a single SA-I afferent with the receptive field shown on the generic finger outlines at the top left. Impulse ensembles show responses to the stimuli repeated during the regular sequence (n = 5), and histograms show the instantaneous frequency averaged over the five trials.Solid and broken lines show the forces and positions of the stimulus, respectively, averaged over the five trials. B, The generic finger outlineshows a polar plot for the afferent illustrated in A. The polar plot consists of four straight lines joining the response magnitudes in the distal, radial, proximal, and ulnar directions measured as number of impulses during the protraction phase; the origin of the coordinate system is at the primary site of stimulation. C, Overlaid polar plots, superimposed on the generic finger, for the 27 afferents for which response was greatest when the tangential component of force was in the distal direction. D, Instantaneous firing rates, averaged over the five trials, for the same 27 afferents as in C, shown for forces with tangential components in the four directions and for normal force stimulation. E, For each of the 27 afferents in C, lines join three data points representing the response, averaged over the five trials, to forces in the proximal (P), normal (N), and distal (D) directions. Broken and solid lines show afferents for which tangential force components showed a net effect determined by the Mann–Whitney U test (n = 9) and those for which there was no significant net effect (n = 18), respectively.
Fig. 6.

Preferred directions of the SA-I afferents estimated from the responses evoked during the protraction phases of the four stimuli with tangential force components. A,Arrows (unit vectors) show the preferred directions of the 68 directionally sensitive SA-I afferents. The mean of the 68 vectors is shown by the white arrow. Solid circles on contours of the generic fingertip indicate the location of the receptive field centers of afferents showing greatest responses in the distal, radial, proximal, and ulnar quadrants. Thefine dots (same on each finger) indicate the receptive field centers of all the directionally sensitive SA-I afferents.B, The overall responsiveness of the afferents (the average number of impulses evoked during the protraction phase of the four stimuli with tangential force components) as a function of the preferred direction of the afferent.
Fig. 7.

Directional sensitivity of the same 68 SA-I afferents as displayed in Figure 6. A, Directional sensitivity vectors superimposed on the generic finger.B, Magnitude of the vector, the directional sensitivity index, as a function of the preferred direction of the afferent.C, Directional sensitivity of afferents as a function of the responsiveness of the afferent, measured as the number of impulses evoked during the protraction phase. D, Relationship between the distance from the stimulation site to the receptive field center and the directional sensitivity of the afferent.
Fig. 8.

Responses of SA-II afferents to forces applied in the five principal directions. A, Responses of a single SA-II afferent. B, The generic finger outline shows a polar plot for the afferent illustrated inA. C–E, Data from 15 afferents for which response was greatest when the tangential component of force was in the proximal direction. For explanation, see legend to Figure 5.
Fig. 9.

Preferred directions of the 32 directionally sensitive SA-II afferents. For explanation, see legend to Figure6.
Fig. 10.

Directional sensitivity of the same 32 SA-II afferents displayed in Figure 9. For explanation, see legend to Figure7.
Fig. 11.

Responses of FA-I afferents to forces applied in the five principal directions. A, Responses of a single FA-I afferent with the receptive field shown on the generic finger outlines at the top left.B, The generic finger outline shows a polar plot for the afferent illustrated in A.C, Overlaid polar plots of the protraction phase, superimposed on the generic finger outline, for the 21 afferents for which the response was greatest when the tangential component of force was in the proximal direction. D, Instantaneous firing rates during the protraction phase (left), averaged over the five trials, for the same 21 afferents as in C, shown for forces with tangential components in the four directions and for normal force stimulation. On the right, the average instantaneous firing rates during the retraction phase are shown for a different sample of 16 FA-I afferents that responded best to stimuli in the proximal direction during the retraction phase. The sample is different from the sample on the left because FA-I afferents had different directional preferences during the protraction and retraction phases.E, For each of the 21 afferents illustrated inC, lines join three data points representing the response, averaged over the five trials, to forces in the proximal (P), normal (N), and distal (D) directions. For further explanation, see legend to Figure 5.
Fig. 12.

Preferred directions of the 50 directionally sensitive FA-I afferents. For explanation, see legend to Figure6.
Fig. 13.

Directional sensitivity of the same 50 FA-I afferents displayed in Figure 12. For explanation, see legend to Figure7.
Fig. 14.

Comparison of directionality during different phases of the stimulus. A, Open bars show the number of afferents that responded during that phase of the stimulus. Solid bars show the number of afferents that were directionally sensitive. Dotted lines indicate the total number of afferents of each type recorded from. B, Scatter plots displaying the relationship between the preferred direction during the protraction phase and that during the plateau phase for 61 SA-I and 31 SA-II afferents, and during the protraction and retraction phases for 29 FA-I afferents. Data are from afferents that were directionally sensitive during both phases of the regular sequence. Data outside the thin solid lines represent afferents for which the preferred directions for the two phases of stimulation differed by >90°. Data on the dotted lines would correspond to a 180° difference, which represents a reversal of the preferred direction.
Fig. 15.

Comparison of preferred directions calculated for the regular sequence with those calculated for the irregular sequence. Data points show afferents (67 SA-I, 30 SA-II, and 45 FA-I) that had a statistically significant preferred direction for both modes of stimulus presentation.
Fig. 16.
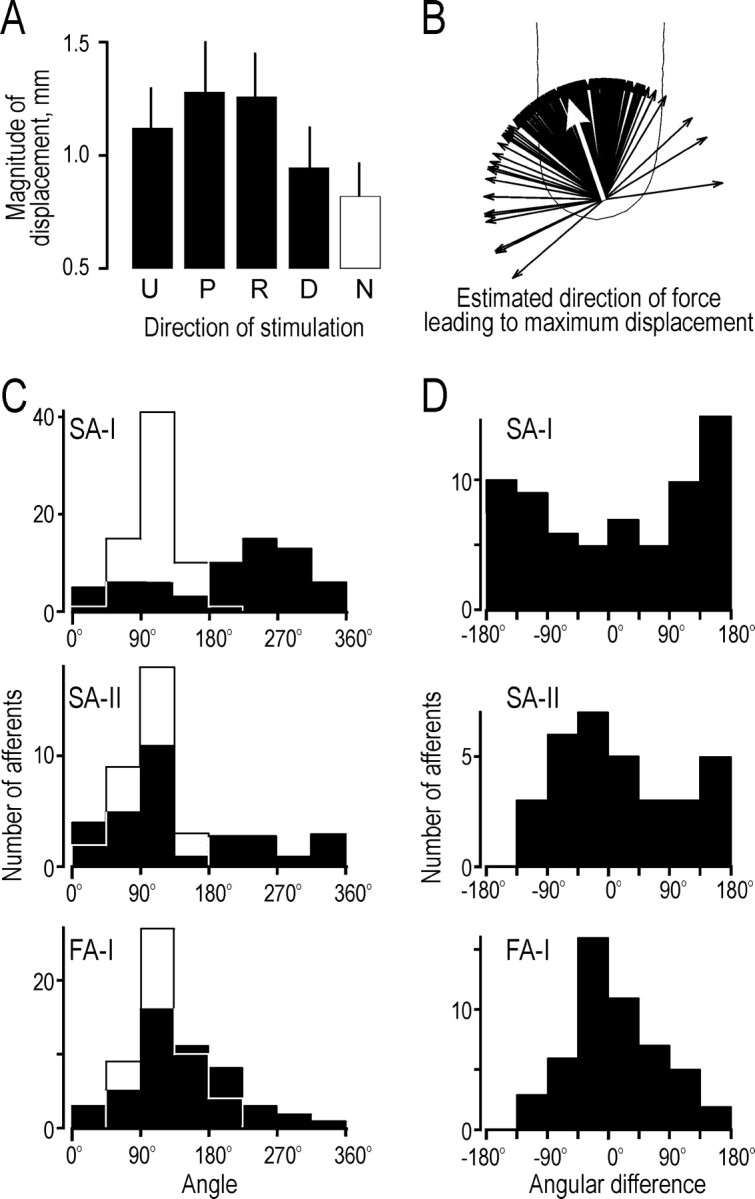
Displacement of the stimulus surface resulting from the four tangential force components during the regular sequence.A, Bars show the mean magnitude of the total displacement of the stimulus surface when forces were applied with tangential components in the ulnar (U), proximal (P), radial (R), and distal (D) directions. Vertical lines indicate 1 SD. B, Unit vectors for all afferents (n = 186) show the estimated direction of force that resulted in maximum displacement of the stimulus. Thewhite arrow shows the mean vector. C, Filled histograms show distributions of the preferred directions of the afferents, and open histograms show distributions of the directions of force producing maximum displacement in the tangential plane for the same afferents (73 SA-I, 41 SA-II, and 72 FA-I afferents).D, Angular differences between the preferred direction and the direction producing maximum displacement for data shown inC.
Data collection and analysis
The force and position signals were digitized at 400 Hz (16 bits resolution) and stored using a flexible laboratory computer system (SC/ZOOM, Physiology Section, Department of Integrative Medical Biology, University of Umeå). The displacement of the stimulus surface was defined as the difference between its positions at the end and the beginning of the protraction phase. The neural signals (bandwidth 0.5–5 kHz; 10 bits resolution) were sampled at 12.8 kHz. Action potentials were detected using an algorithm based on differences in spike morphology, which was verified for each action potential off-line (Edin et al., 1988). The instantaneous frequency of the action potentials was defined as the inverse of the interval between consecutive impulses for the duration of the interval. This calculated rate was then “sampled” at 800 Hz to obtain a time-series that could be treated in the same way as the sampled force and position signals.
For each stimulus, we calculated four measures of the response of the afferent, given by the number of nerve impulses recorded during (1) the protraction phase, (2) the plateau phase, (3) the retraction phase, and (4) all three phases together. Because of the delay between the application of a mechanical stimulus at the fingertip and the arrival of the afferent response at the recording site at the midlevel of the upper arm, we included in the protraction phase response impulses recorded during the first 20 msec of the plateau phase. The rationale behind choosing this time was based on stimulus–response latencies measured during application of suprathreshold mechanical stimuli to the glabrous skin while recording fiber responses in the median nerve at the level of the upper arm (Knibestöl, 1973) [for axonal conduction velocities, see Johansson and Vallbo (1983) and Mackel (1988)]. Similarly, for the retraction phase response, we included impulses recorded during the first 20 msec of the following interstimulus interval.
Statistical analysis. In most cases we used nonparametric statistics (Siegel and Castellan, 1988). For each afferent and each stimulus sequence, we used the Kruskal–Wallis one-way ANOVA by ranks to test whether the direction of the tangential force component influenced the response (n = 5 for stimuli in each of the radial, distal, ulnar, and proximal directions). For each directionally sensitive afferent, we estimated the preferred direction of the afferent using the vector sum of the four mean responses obtained for each of the stimulation directions with a tangential force component (R, D, U, P). This approach requires, however, that the response magnitude is broadly tuned to the direction of stimulation and varies smoothly with direction. To test this assumption, we studied 27 directionally sensitive afferents (10 SA-I, 10 FA-I, and 7 SA-II afferents) using 8 directions of stimulation at an angular spacing of 45°. All afferents were indeed tuned broadly toward one preferred direction of stimulation, and none of the afferents showed multimodal tuning. Figure 2D shows the results from one afferent of each type. Solid and broken lines show polar plots for responses in the four and the eight directions, andsolid and broken arrows show their vector sum, respectively. For all 27 afferents tested, the preferred direction estimated using only the four directions differed by less than ±20° from the preferred direction computed using all eight directions.
To assess whether the afferent was sensitive to tangential force as such, the responses to normal force stimulation (5 trials) were compared with the responses to force stimulation with tangential components in all four directions (20 trials) using the Mann–Whitney test for two independent samples. As a nonparametric measure of correlation, we used the Spearman rank correlation coefficient (rs) and a nonparametric angular–angular correlation test (raa) (Zar, 1996). The Rayleigh test was used for analyses of vector data (Batschelet, 1981; Zar, 1996). In addition to nonparametric statistics, we used angular–linear correlation analysis for correlating an angular variable with a linear variable (Zar, 1996). In all tests, the level of probability selected as significant was p < 0.05.
Generic terminal phalanx. To combine data obtained from receptor-bearing fingertips in different subjects and digits, the data were normalized to a generic fingertip. We thus created a generic distal phalanx on which we overlaid all data concerning the locations of the receptive fields of the afferents and the primary sites of stimulation. To create the generic fingertip, we made a mold of the right index finger and the right middle finger of one subject whose fingers were considered representative of the population of subjects studied. The mold was made in impression alginate (Zelgan De Trey, Visbaden, Germany) that was filled with acrylic dental base (Pro Base Cold, Ivoclar, Liechtenstein) polymerized under a pressure of 2 bar for 10 min. The distal phalanges of the acrylic fingers were cut in transverse serial sections at 0.8 mm intervals, and the contours of these sections were digitized. The two acrylic fingers (index and middle finger) were reconstructed numerically, and their contours were averaged.
For each subject recorded from, a digital camera was used to photograph the three distal phalanges, with the receptive fields outlined in ink, in five standard views (the volar, radial, ulnar, distal, and dorsal aspects). A final generic fingertip was obtained by scaling the size of the averaged acrylic finger to the mean value of the width, depth, and length of the photographed phalanges (the three dimensions were scaled independently). Finally, the coordinates of the receptive field centers of all the afferents recorded from were transposed to the surface of the generic finger. To that end, we normalized the contours obtained from the digital images of the individual fingertips independently in three dimensions (width, depth, and length) to obtain a best fit with the generic finger; the receptive fields depicted on the photos and their spatial relations to the site of stimulation were thus subjected to the same scaling procedure.
To obtain an estimate of the area of contact between the stimulus surface and the fingertip, we took fingerprint measurements at a contact force of 4 N in six subjects. The contact areas were scaled to the generic finger and averaged. At the 0.2 N contact force present during the interstimulus intervals, the area in contact with the skin would have been approximately one-half of that measured at 4 N as estimated from previously reported relationships between magnitude of contact force and contact area (Westling and Johansson, 1987;Vega-Bermudez and Johnson, 1999). Thus, the average radius of the area of contact during the interstimulus intervals would have been some 70% of that at the force plateau under the assumptions that the area was circular and grew concentrically (actually it was slightly oval) (Fig.2B).
Comparison of active and passive fingertip deformation
In our experiments, the subject was passive, and the stimulator applied forces between the volar skin surface and the nail. In contrast, when humans actively exert fingertip forces during real manipulations, forces operate essentially between the phalangeal bone and the volar skin surface. Therefore, the encoding behavior of the afferents observed in the present experiments is representative of that during natural tasks only if the deformational changes in the fingertip are similar under the two conditions. This requires a stiff coupling between the nail and the phalangeal bone.
To address this issue, we used a dental x-ray apparatus to study deformational changes in the terminal phalanx of the index finger during both active and passive generation of fingertip forces. We obtained side views of the terminal phalanx of two subjects (one of whom was used to generate the template of the generic finger), first with no applied force and second with static normal forces of ∼1 and 4 N applied both actively and passively (Fig.3A,B). There was virtually no compression of tissues between the nail and the bone regardless of the mode of force application; all deformation occurred between the bone and the volar surface (Fig. 3C). Furthermore, the overall tissue deformations were practically identical during the two modes of force application. Finally, in agreement with previous findings, we observed that the fingertip is highly compliant at normal contact forces of ∼1 N and becomes increasingly incompressible at higher forces (Westling and Johansson, 1987; Pawluk and Howe, 1999; Vega-Bermudez and Johnson, 1999). In conclusion, we found that for our experimental paradigm, the fingertip deformed as if the subjects were actively applying force against a stationary object.
RESULTS
First, we will describe the sample of afferents and the location of their receptive fields. Second, we will analyze the extent to which responses during the protraction phase of the regular sequence were influenced by the direction of the tangential components of force. We commence with the protraction phase because all three afferent types responded substantially during this phase. In the third section, we compare the directional preferences of the afferents based on responses during the different phases of the stimulus, i.e., protraction, plateau, and retraction phases. Then we compare data from the regular and irregular sequences to assess whether the previous stimulus history influenced the directional properties of the afferents. Finally, we seek possible relationships between the preferred directions of the afferents and the anisotropic mechanical properties of the fingertip.
Sample of afferents
We recorded from 196 low-threshold mechanoreceptive afferents with receptive fields located on the terminal phalanx of the index (n = 73), middle (n = 89), or ring finger (n = 34) of the right hand. Seventy-three afferents were classified as SA-I, 72 as FA-I, 41 as SA-II, and 10 as FA-II. This sample was intentionally biased toward slowly adapting afferents (cf. Johansson and Vallbo, 1979) because we wished to obtain a reasonably large number of SA-I and SA-II afferents, which have a lower density in the fingertips than the FA-I afferents. We did not concentrate on FA-II (Pacinian) afferents, because our stimuli did not excite them reliably. Thus, FA-II afferents will not be considered in the present account.
All SA-I afferents, all SA-II afferents except one, and 85% of the FA-I afferents responded to force applied in at least one of the five directions. In Figure4A, the locations of the receptive fields, projected on the generic fingertip, are shown bycircles for the responding afferents and bycrosses for the nonresponding afferents. The center of the circle marks the center of the receptive field, and the area represents the number of impulses evoked during the protraction phase, averaged across all stimuli delivered during the regular sequence. Receptive fields of afferents with large and small responses were intermingled on the skin surface, and receptive fields of responding and nonresponding FA-I afferents were also intermingled. Note that afferents with receptive field centers remote from the skin area contacted by our stimulus surface could discharge at substantial rates. Despite the intermingling of receptive fields, the intensity of the response of an afferent was influenced by the location of its receptive field on the fingertip (Fig. 4B). That is, for all three types of afferent there was a significant inverse correlation between the response intensity during the protraction phase and the shortest distance between the primary site of stimulation and the center of the receptive field (rs = −0.45, −0.45, and −0.35 for the SA-I, SA-II, and FA-I afferents, respectively; allp < 0.05).
The spatial distributions on the terminal phalanx of receptive fields of the various types of afferent were consistent with those described previously (Johansson and Vallbo, 1979). Most FA-I (66%) and SA-I (87%) afferent receptive field centers were located distal to the papillary whorl, i.e., on the distal half of the terminal phalanx. In contrast, the fields of the SA-II afferents were more evenly distributed over the phalanx. Likewise, the fields were distributed approximately evenly in the radial–ulnar direction (Johansson and Vallbo, 1979); for each type of afferent, approximately one-half of the afferents terminated on each side of a line through the primary site of stimulation dividing the phalanx into radial and ulnar halves. The sizes and shapes of the receptive fields defined by the von Frey hairs corresponded to those reported previously (Johansson and Vallbo, 1980). Thus, we have no reason to believe that our sample was subject to any important bias with reference to the parent population of tactile afferents.
Afferents influenced by the direction of fingertip forces
In this section, we analyze the influence of the direction of the tangential force component on the responses of the afferents as measured by the number of impulses evoked during the protraction phase of the regular sequence of stimuli. The direction of the tangential force component influenced the vast majority of the responding afferents, i.e., 93, 80, and 83% of the SA-I, SA-II, and FA-I afferents, respectively.
SA-I afferents
Figure 5A shows the responses of an SA-I afferent that was markedly influenced by the direction of the applied force. This afferent responded to force in the normal direction but responded most vigorously to stimuli with a tangential force component in the distal direction. The response was greater for forces with a tangential component in the distal direction than for forces with a tangential component in the proximal direction and greater for a tangential component in the radial than in the ulnar direction. The impulse ensembles show the low variability of responses during the protraction phase for the five identical stimuli delivered during the regular sequence. This low variability was a characteristic of all SA-I afferents and also of the FA-I and SA-II afferents (see Figs. 8A, 11A). In addition to a dynamic response during the protraction phase, the SA-I afferents typically exhibited a maintained discharge during the plateau phase. However, the magnitude of the plateau phase response also depended on the direction of force (see Directionality of responses during different phases of the stimulus in Results) and could be absent for some directions of stimulation, for example the ulnar direction in Figure 5A. The 0.2 N background contact force excited six SA-I afferents (8%), which discharged at low rates in the interstimulus interval, mainly during the later part of the interval.
The effect of the direction of the tangential component of force was different for different SA-I afferents. Using the Kruskal–Wallis one-way ANOVA by ranks, we tested each afferent to see whether the direction of the tangential force component reliably influenced the intensity of the response to the protraction phase. Sixty-eight of the 73 SA-I afferents exhibited significant directional sensitivity with maximum responses in one of the distal, radial, proximal, or ulnar directions. A polar plot of the responses to forces with tangential components in the four directions is shown, for the afferent illustrated in Figure 5A, on the generic finger outline in Figure 5B. Figure 5C shows superimposed polar plots for the 27 SA-I afferents that showed the greatest responses to distally directed forces. Note that all of these afferents were broadly tuned to the direction of stimulation, and the ratio of responses for the four directions is not the same for all afferents. Figure5D shows the averaged instantaneous firing rates of the same 27 afferents for the four directions of stimulation. The averaged firing rate was nearly twice as great for forces in the distal direction as for forces in the opposite (proximal) direction and was midway between for forces in the radial and ulnar directions. Furthermore, the averaged response to the normally directed force (Fig.5D, shaded area) was approximately equal to the responses to forces with radial or ulnar components. Figure5D also indicates that the direction of force influenced the averaged afferent response early in the protraction phase, i.e., at low stimulation forces.
For most SA-I afferents, regardless of the direction of force evoking the greatest response, the response intensity appeared to fall steadily from (1) stimulation in the direction evoking the greatest response to (2) stimulation in the normal direction and to (3) stimulation in the direction opposite to that evoking the maximum response. Thesolid lines in Figure 5E illustrate this pattern for afferents that exhibited a maximum response to tangential force component in the distal direction. For some afferents, however, the response to the normal force stimulation appeared weaker than the responses evoked when tangential force components were involved (Fig.5E, broken lines). To assess a possible net stimulatory effect of tangential force components on the responses of an individual afferent, we compared the response to normal force (5 trials) with the responses to forces with tangential components in each of the four directions (20 trials) (Mann–Whitney U test for two independent samples). Tangential force, defined in this way, significantly excited 21 of the 68 directionally sensitive SA-I afferents, including 9 of the 27 afferents for which response was greatest in the distal direction (Fig. 5E, broken lines).
Preferred direction. For each of the 68 directionally sensitive SA-I afferents, we used the vector sum of mean responses in each of the four stimulation directions as an estimate of the preferred direction of the afferent (see Materials and Methods). In Figure6A, the preferred directions of the afferents are represented by unit vectors that originate from the primary site of stimulation. The preferred directions were scattered, but their angular distribution was not uniform (p < 0.01; Rayleigh test). The directional preferences were markedly biased for force components in an ∼180° sector oriented toward the distal and ulnar directions. The mean angle of preferred directions for the SA-I afferents was 269° (angle of the mean vector shown by the white arrow in Fig. 6A), and the length of the mean vector was 0.27. This length represents a measure of concentration that may vary from 1.0 (when all the data are concentrated in the same direction) to 0 (when there is complete dispersion of the vectors) (Zar, 1996).
To visualize any relationship between the preferred direction of an afferent and the location of its receptive field, the generic fingertips in Figure 6A show the location of the receptive field centers of afferents with preferred directions in the distal, radial, proximal, and ulnar quadrants. There is a tendency for afferents with a preferred direction in the distal quadrant to have a receptive field center distal to the site of stimulation, and receptive fields of afferents with preferred directions in the proximal quadrant tended to be located more proximally. Thus, the SA-I afferents seemed to be excited most efficiently by stimuli directed toward the receptive field centers. To test the significance of this general proposal, we calculated the difference between the preferred direction and the direction from the stimulation point to the receptive field center for each afferent. The mean difference was small (−4°), but there was no reliable concentration of this angular difference based on the Rayleigh test (p = 0.1).
The overall responsiveness of the individual SA-I afferents was measured by the response, during the protraction phase, averaged across all four directions of stimulation in which the force had a tangential component. Responsiveness did not vary with the preferred direction of the afferent (Fig. 6B) (p = 0.28; r = 0.20; angular–linear correlation).
Directional sensitivity. The unit vectors in Figure6A show the preferred directions of the SA-I afferents but do not give any indication of how broadly tuned each afferent was. This is shown by the directional sensitivity, which we define as the vector sum of the responses to forces with tangential components in the four directions divided by the scalar sum of the response magnitudes in the four directions (Fig.7A). The magnitude of this directional sensitivity vector gives an index, ranging between 0 and 1, which is a measure of tuning that is independent of the responsiveness of the afferent. An index of 0 indicates that the response of the afferent was the same in all four directions, whereas a value of 1 indicates that the afferent responded to only one direction of force.
The directional sensitivity index of the 68 SA-I afferents illustrated in Figure 7A had a mean ± SD of 0.23 ± 0.18. This index did not vary with the preferred direction of the afferent (Fig. 7B) (r = 0.04; p = 0.9; angular–linear correlation) or with the distance between the primary site of stimulation and the receptive field center (Fig.7D) (rs = 0.19;p = 0.13). However, there was a significant decrease in directional sensitivity with the increase in overall responsiveness of the afferent (Fig. 7C) (rs= −0.32; p < 0.01).
SA-II afferents
Fourteen of the 41 SA-II afferents (34%) were spontaneously active; i.e., when encountered they responded with discharge rates ranging from 3.7 to 30 impulses per second in the absence of externally applied mechanical stimuli. Like the SA-I afferents, the SA-II afferents exhibited a maintained discharge during the plateau phase of the stimulus, in addition to a dynamic response to the protraction phase. Thirteen (32%) SA-II afferents discharged during the interstimulus intervals; they were all in the spontaneously active group. Figure 8A shows the responses of a single directionally sensitive SA-II afferent, and Figure 8B shows the polar plot for the same afferent. For this afferent, the background discharge is clearly visible during the interstimulus intervals (Fig. 8A). The illustrated afferent was excited by forces in the normal direction but responded more vigorously to stimuli with tangential components in the proximal or radial directions. Forces with tangential components in the distal or ulnar directions did not excite this afferent convincingly, and in fact the discharge declined below the background rate for tangential force in the distal direction. Note also that the afferent was subject to a marked post-excitatory depression; i.e., the background discharge was absent early in the interstimulus intervals that followed stimuli with tangential components in the proximal or radial directions.
As for the SA-I afferents, the direction of the tangential force component that elicited the strongest response varied among the SA-II afferents. Figure 8C shows the polar plots for the 15 SA-II afferents that were excited maximally by forces with tangential components in the proximal direction. The average instantaneous firing rates of these afferents clearly reflected the direction of stimulation (Fig. 8D), with the strongest response to forces in the proximal direction and the weakest response to forces in the opposite, distal, direction.
The overall effect of tangential force components can be gauged from the fact that for only 4 of the 32 directionally sensitive SA-II afferents was the response to the normal force significantly less than the average responses to the four forces with tangential components (Mann–Whitney U test); none of afferents exemplified in Figure 8E was influenced significantly by tangential force per se. Thus, for most SA-II afferents the response intensity appeared to fall steadily from (1) stimulation in the direction resulting in the greatest response to (2) stimulation in the normal direction and to (3) stimulation in the direction opposite to that evoking the greatest response (Fig. 8E, solid lines). All of the 15 SA-II afferents that were maximally excited by force with a component in the proximal direction showed this pattern.
Preferred directions. The preferred directions of the SA-II afferents, estimated by vectorial addition of the responses to the four forces with tangential components, were distributed all around the angular space (Fig. 9A), but not uniformly (p < 0.05; Rayleigh test). The directional preferences were biased toward a sector oriented approximately in the proximal direction. The mean angle of the preferred directions, determined by the mean angle of the unit vectors, was 79°, and the length of the mean vector (a measure of concentration) was 0.34. There was no obvious relationship between the preferred direction of an afferent and the location of its receptive field shown on the generic fingertips (p = 0.32; Rayleigh test) (see details in SA-I section above). This is in agreement with the complex patterns of directional preferences of SA-II afferents observed when lateral skin stretch is applied to the skin of the fingertips (Johansson, 1978). Furthermore, there was no clear relationship between the preferred direction of an afferent and its overall responsiveness (Fig.9B) (r = 0.18; p = 0.58; angular–linear correlation).
Directional sensitivity. The mean value ± SD of the directional sensitivity index of the SA-II afferents (Fig.10) was 0.24 ± 0.20. The index did not vary with the preferred direction of the afferent (r = 0.40; p = 0.07; angular–linear correlation) or with the distance between the stimulation site and the receptive field center (rs = 0.24;p = 0.20). There was a significant decrease in the directional sensitivity index with an increase in the overall responsiveness of the afferent (rs = −0.50; p < 0.01).
FA-I afferents
The FA-I afferents responded to both dynamic components of the force, i.e., the protraction and the retraction component. Of the 61 FA-I afferents that responded to at least one dynamic component, 48 responded during both the protraction and retraction phases, 12 responded during protraction only, and 1 responded during retraction only. The afferent exemplified in Figure11, A and B, responded to both dynamic phases and was influenced by the direction of the tangential force component. The response of this afferent during the protraction phase was greatest for forces with a tangential component in the proximal direction.
As with the slowly adapting afferents, the direction of the tangential force component that elicited the greatest response varied among the FA-I afferents. Polar plots of responses during the protraction phase are shown in Figure 11C for the 21 FA-I afferents that exhibited a maximum response to forces with a tangential component in the proximal direction. The average instantaneous firing rates during the protraction phase for the five directions of force are shown in Figure 11D (left) for these 21 afferents. During the protraction phase, the direction of the tangential force component had a marginal influence on the development of the average response and its peak firing rate, whereas it markedly influenced the duration of the response. The response duration was greatest for forces in the proximal direction and least for forces in the distal direction.
In 24 of the 50 FA-I afferents that were directionally sensitive during the protraction phase, the response to the normal force was significantly weaker than the average response to the four forces with tangential components (Mann–Whitney U test). This effect is clearly seen in Figure 11, D (left) andE, for the 21 afferents shown in Figure 11C that exhibited a maximum response to forces with a tangential component in the proximal direction.
Preferred directions. The distribution of preferred directions for the directionally sensitive FA-I afferents, shown by the unit vectors in Figure12A, was significantly different from a uniform distribution (p < 0.0001; Rayleigh test). The directional preferences were markedly biased for force components in an ∼180° sector oriented toward the proximal and radial directions. The mean angle of preferred direction (angle of the mean vector) was 129°, and the concentration (size of the mean vector) was 0.51. The receptive field locations marked on the generic finger outlines indicate a tendency for the preferred direction to match the direction from the primary site of stimulation to the receptive field center. To test this more rigorously, we calculated the difference between these two angles; their distribution, with a mean of −7°, showed a significant concentration (0.58; p < 0.0001; Rayleigh test). There was no significant relationship between the preferred directions of the afferents and their overall responsiveness (Fig. 12B) (r = 0.34;p = 0.06; angular–linear correlation).
Directional sensitivity. The directional sensitivity index for the FA-I afferents (Fig. 13) had a mean ± SD of 0.24 ± 0.18. The index did not depend on the preferred direction of the afferent (r = 0.23;p = 0.27; angular–linear correlation) but correlated inversely with the overall responsiveness of the afferent (rs = −0.65; p < 0.0001) and positively with the distance from the primary site of stimulation to the receptive field center (rs = 0.42; p < 0.005).
Afferents indifferent to the direction of tangential force components
Relatively few afferents that responded during the protraction phase were indifferent to the direction of the tangential force component. This applied to 5 (7%), 8 (20%), and 10 (17%) of the SA-I, SA-II, and FA-I afferents, respectively. The receptive fields of these afferents, which all showed similar responses to forces with tangential components in all four directions, were intermingled with those of the directionally sensitive afferents. For some of the indifferent afferents (two SA-I, two FA-I, and one SA-II), the response to the normal force differed significantly from the average response to forces with tangential components in all four directions as determined by the Mann–Whitney U test. With the exception of one FA-I afferent, the response to the normal force was weaker than the responses to forces with tangential components.
Directionality of responses during different phases of the stimulus
We investigated whether the directional characteristics of the afferents measured during the protraction phase of the stimulus were representative of the responses during other phases of the stimulus. For each afferent type, we focused on the two phases during which responses were most consistent, namely the protraction and plateau phases for the slowly adapting afferents and the protraction and retraction phases for the FA-I afferents (Figs. 5, 8, 11).
Slowly adapting afferents
For the SA-I and SA-II afferents, the proportion of afferents that were directionally sensitive was similar whether assessed from responses during the protraction phase, the plateau phase, or the entire stimulus (Fig.14A, solid bars). For the 61 SA-I afferents that were directionally sensitive during both the protraction and plateau phases, there was a significant positive correlation between the preferred directions calculated for the two phases (Fig. 14B) (raa = 0.5; p < 0.01; angular–angular correlation). The absolute difference between the two preferred directions had a mean of 25° and a SD of 31° and was <45° for all but 11 afferents. The situation was similar for the 31 SA-II afferents that were directionally sensitive during the two phases (Fig. 14B) (raa = 0.69; p < 0.01). The mean difference between the two preferred directions for the SA-II afferents was 15° and the SD was 16°, and with only two afferents the difference was >45°.
FA-I afferents
Forty-eight FA-I afferents responded during both the protraction and retraction phases, 12 responded during protraction only, and 1 responded during retraction only. The proportion of responding afferents influenced by the direction of force was similar for the protraction and retraction phases (Fig. 14A) but was higher if assessed from responses during the entire stimulus. During the protraction phase, the direction of stimulation affected mainly the duration of the response, but during the retraction phase it affected both the peak rate and the duration (Figs.11A,D).
For the 29 FA-I afferents that were directionally sensitive in both the protraction and retraction phases, preferred directions calculated for the two phases did not correlate (Fig. 14B) (raa = 0.05; p > 0.05). The absolute differences in preferred directions had a mean of 67° and a SD of 54°, with more than half (n = 16) of the afferents having a difference >45°. Importantly, the difference in directional preference during the protraction and retraction phases could not be explained by the reversal in the direction of movement of the stimulus. That is, shifts in the preferred direction during the protraction phase (“on-response”) and during the retraction phase (“off-response”) were close to 180° for only a few of the afferents (Fig. 14B).
Direction sensitivity compared for regular and irregular sequences
We stimulated the fingertips at a relatively high repetition rate (∼1.3 stimuli per second) to replicate forces that occur during many natural manipulations (Kunesch et al., 1989). The viscoelastic properties of the fingertip (Pubols, 1982a; Serina et al., 1998; Pawluk and Howe, 1999; Jenmalm et al. 2000) resulted in creep and hysteresis that was most pronounced in the tangential plane during our force stimuli. This is evident from comparison between the force and displacement records in Figures 5A, 8A, and 11A (Fd-p vsPd-p andFr-u vsPr-u). Furthermore, the time course of these viscoelastic effects implied that the mechanical state of the fingertip before each stimulus was influenced by the nature of the preceding stimuli. Thus, it is possible that the directional sensitivity of the afferents measured in the regular sequence was partly the result of the order of the stimuli; all five repetitions of the stimulus in a given direction were preceded by the same stimulus history, and the order of presentation was always R, D, U, P, N. To address this issue, we compared the directionality of afferent responses during the protraction phase of the regular sequence with the corresponding directionality obtained during the irregular sequence. In the irregular sequence, the stimulus directions were intermingled so that the history was different for each of the five repetitions of the stimulus in a given direction.
The number of afferents with responses influenced by the direction of the tangential component of force was similar during the two modes of stimulus presentation. Only one SA-I afferent, two SA-II afferents, and five FA-I afferents were influenced during the regular sequence but not during the irregular sequence. Conversely, only two SA-I afferents and one SA-II afferent were influenced during the irregular sequence but not during the regular sequence. There was a high concordance of preferred directions for the two modes of stimulus presentation, as shown by the scatter plots in Figure 15(raa = 0.86 for SA-I;raa = 0.91 for SA-II;raa = 0.85 for FA-I; p< 0.01 in all instances). The mean absolute angular difference was 12, 10, and 13° for the SA-I, SA-II, and FA-I afferents, respectively, and the SDs were 14, 8, and 19°, respectively. For all but five afferents, the angles differed by <45°. Thus, we conclude that the sequence of stimulus presentation substantially influenced neither the occurrence of directional sensitivity nor the preferred directions of the afferents.
Relationship between the preferred direction of an afferent and the compliance of the fingertip
In agreement with recent observations by Nakazawa et al. (2000), we noted that the compliance of the fingertip differed in the four tangential directions. Although all four tangential force components had a magnitude of 1.38 N, the magnitude of the resultant total displacement of the stimulus surface varied with the direction of the force (p < 0.001; Kruskal–Wallis). It was greatest for forces with a proximal tangential component and least for forces with a distal component (Fig.16A); as expected, the displacement was even smaller for normal force stimulation alone.
As an estimate of the direction of the tangential force that produced the maximum displacement, we adopted the following procedure. For each afferent we computed four vectors, with direction determined by the angle of the tangential force component (0, 90, 180, or 270°) and magnitudes given by the magnitude of the displacement resulting from that force. We used average values over the five repetitions in the regular sequence. The direction of the result of these four vectors gives an estimate of the direction of force leading to maximum displacement. The unit vectors in Figure 16Brepresent the direction of maximum displacement based on the mechanical data obtained during recording from all afferents, i.e., one vector for each afferent. These vectors are unevenly distributed (p < 0.0001; Rayleigh test), pointing predominantly in the proximal direction with some radial bias. The angle of the mean vector was 109° (concentration = 0.87), indicating that the fingertips were most compliant for tangential force components in approximately the proximal direction.
In Figure 16C, two distributions are superimposed for each afferent type. The first distribution (open histogram) shows the angles of the forces leading to maximum displacement, calculated as above, and the second distribution shows the preferred directions of the afferents (filled histogram). There was a striking correspondence between the two distributions for the FA-I afferents. To test the correspondence, we computed the difference between these two angles for each afferent. The distribution of differences (Fig. 16D) was significantly concentrated (0.56; p < 0.0001; Rayleigh test), with a mean angle of 6°. The SA-II afferents showed a similar correspondence in distributions, but the angular difference distribution was not significantly concentrated (p = 0.13). In contrast to the FA-I and SA-II afferents, the preferred direction of the SA-I afferents tended to be inversely related to the direction of force producing maximum tangential displacement. The difference distribution was significantly concentrated (0.24; p < 0.05) with a mean of 168°.
DISCUSSION
X-ray analysis of deformations in the terminal phalanx of the digit indicated that the force stimuli in our experiments simulated the situation that occurs when subjects manipulate an object under natural conditions. Nearly all SA-I, FA-I, and SA-II afferents that innervated the terminal phalanx responded to the applied forces. Consequently, virtually all tactile afferents from the fingertip potentially contribute to the encoding of mechanical events when the fingertips manipulate objects under natural conditions. Furthermore, the direction of fingertip forces influenced the responses in most afferents. Accordingly, the vast majority of the ∼2000 afferents from each terminal phalanx (Johansson and Vallbo, 1979) would show directionally dependent responses and thus provide the CNS with rich information regarding the direction of fingertip forces.
Significant responses occurred not only in afferents terminating in skin areas that directly contacted the stimulus surface but also in afferents that terminated on the sides and end of the digit [see alsoBisley et al. (2000)]. Thus, the receptive fields of tactile afferents during stimuli occurring in common use of the hand are much larger than those reported on the basis of localized weak tactile stimuli (Knibestöl and Vallbo, 1970; Johansson and Vallbo, 1980; Phillips et al., 1992). The extensive excitation of afferents apparently results from a widespread distribution of complex stresses and strains over the phalanx, reflected in the marked deformations on the sides and end of the finger remote from the contact area.
Effect of the direction of fingertip force
Most of the responding afferents were sensitive to the direction of the tangential force component. During the protraction phase, the directional sensitivity index was similar for the SA-I, SA-II, and FA-I afferents, with a mean ± SD of 0.23 ± 0.18, 0.24 ± 0.20, and 0.24 ± 0.18, respectively. For both types of slowly adapting afferents there was a high correspondence between the directional preference during the protraction and plateau phases, suggesting that SA dynamic and static responses are driven primarily by mechanical events with common spatial properties. For the FA-I afferents, the preferred direction during the protraction and retraction phases could be markedly different. However, the reversal in the direction of movement of the stimulus during the two phases could not explain this difference.
As indicated in the introductory remarks, several factors may contribute to the directional behavior of an afferent. Depending on the geometry and material properties of the fingertip, stimuli in different directions produce different patterns of strain/stress in the fingertip. For our directional-sensitive afferents, different amounts and patterns of strain at the receptor could thus have contributed to their directional behavior. However, it is unlikely that this fully explains the directionality that we observed, because afferents of the same type with adjacent receptive field centers could show quite different preferred directions. This strongly suggests that inherent directionality of the receptors, related to their microanatomy, influenced the directional preferences of afferents in addition to the general mechanical properties of the fingertip.
For the FA-I afferents, the preferred direction tended to be oriented toward the center of the receptive field, and a similar trend was observed for the SA-I afferents. Although SA-II afferents show directional preferences to tangential skin stretch (Knibestöl and Vallbo, 1970; Knibestöl, 1975; Johansson, 1978; Olausson et al., 2000), there was no relationship between the preferred direction and the location of the receptive field center in our sample. This can be explained by the combination of the longitudinal anchoring of the Ruffini-like receptors in dermal fibrous strands (Chambers et al., 1972) and the complexity of dermal tissue in the fingertips with fibrous strands running in various directions (Jones, 1946; Johansson, 1978).
In agreement with Nakazawa et al. (2000), we found that the stiffness of the fingerpad was greatest for stimuli with distal components. Several factors may have contributed to this. These include anchoring at the distal interphalangeal crease, the curvature of the fingertip at the distal end, the disk-shaped terminal of the phalangeal bone, and secure connections between the distal part of the fingerpad and the stiff periungual tissue. The preferred directions of the FA-I afferents were biased toward the direction of maximum compliance, i.e., in approximately the proximal direction. This suggests that the magnitude (and rate of change) of fingertip deformation constitutes one important factor in driving the FA-I afferents. A similar tendency was observed for the SA-II afferents. In contrast, the preferred directions of the SA-I afferents were biased in the opposite, distal, direction. This suggests that changes in stress rather than in fingertip deformation as such determined their excitation. There is evidence in the monkey that FA-I and SA-I responses depend on different strain and stress components (Phillips and Johnson, 1981; Srinivasan and LaMotte, 1987; Vega-Bermudez and Johnson, 1999). Rolling movements of the finger-pulp with respect to the phalangeal bone may also have influenced the directional behavior of the afferents. That is, such rolling caused by tangential force components partly changes the skin area contacted by the stimulus surface. However, this area effect was small in relation to the total contact area, as evident from the modest change in the tangential position of the stimulus surface with changes in force direction (Fig. 5, Pd-pandPr-u).
The considerable variation in the relationship between preferred directions and receptive field locations for all types of afferents suggests that inherent directional properties of the receptors influenced the directionality in addition to general fingertip mechanics. This is consistent with the observation of Goodwin and Morley (1987) concerning responses in SA-I and FA-I afferents stimulated by gratings moving tangentially across the monkey fingertip. Additional evidence for inherent directional behavior of tactile receptors has been obtained both in humans (Knibestöl and Vallbo, 1970; Edin et al., 1995; Olausson et al. 2000) and in animals (Chambers et al., 1972; LaMotte and Srinivasan, 1987). Several factors may contribute to the inherent directional behavior of a receptor including the terminal branching patterns of the afferent, the structure of the end-organs, and sensitivity properties of the nerve endings.
Use of directional information about fingertip forces
Control of the direction of fingertip forces is critical in dexterous manipulation. Subjects regulate the balance between normal and tangential forces for grasp stability under various frictional conditions between the skin and contacted surfaces (Johansson and Westling, 1984; Edin et al., 1992; Birznieks et al., 1998; Burstedt et al., 1999). Likewise, the control of force direction is critical in multi-digit manipulation to maintain the desired orientation of the object and at the same time ensure that grasp stability is preserved without excessive fingertip forces (Flanagan et al., 1999). Furthermore, when we handle objects with curved surfaces or irregular shapes, fingertip force directions must be appropriate to the local geometry of the object at the grasp sites (Jenmalm and Johansson, 1997;Goodwin et al., 1998). This requirement may explain why populations of tactile afferents also have a remarkable ability to discriminate small differences in surface curvature and small differences in the position of contact at the fingertips (Srinivasan and LaMotte, 1987; Goodwin et al., 1995, 1997; Wheat et al., 1995; LaMotte and Srinivasan, 1996;Dodson et al., 1998; Khalsa et al., 1998). The CNS presumably uses directional information from tactile afferents in both predictive and reactive control of fingertip actions in manipulation. In predictive control, the CNS operates on internal models in planning manipulatory actions (Johansson and Cole, 1992; Flanagan and Wing, 1997; Blakemore et al., 1998; Johansson, 1998; Witney et al., 1999). Such models are dependent on sensory updating about the current state of both the effector system and environmental objects with which subjects interact (Miall and Wolpert, 1996; Wolpert, 1997; Johansson, 1998; Kawato, 1999). The tactile directional information would thus signal critical sensory consequences of performed manipulatory actions, contributing to the tuning of such models. Concerning reactive control, when humans use a precision grip to restrain objects subject to unpredictable tangential load forces, tactile afferent input triggers muscle activation with patterns appropriate for the direction of the load (Häger-Ross et al., 1996).
There are several conceivable mechanisms for extracting directional information from tactile afferents innervating the fingertip. For example, directional cues concerning tangential forces in the distal and proximal directions could be obtained by monitoring the balance between the input across the population of SA-I afferents and that across the SA-II and FA-I afferents. Moreover, directional preferences of individual afferents of specific types could be combined in population models such as the centroid model used by Goodwin and Wheat (1999) for the position of an object on the fingertip, or the vector model of direction used by Georgopoulos et al. (1986) for neurons in the motor cortex and by Trulsson et al. (1992) for encoding the direction of tooth loads by periodontal mechanoreceptors. This kind of processing would be robust against factors that may change the overall discharge rates of the afferents, e.g., the magnitude and rate of change of the contact force, the temperature of the fingertip, and changes in viscoelastic properties of the fingertip related to previous interactions with objects and to skin hydration (Duclaux and Kenshalo, 1972; Green, 1977; Pubols, 1982b). Computational modeling is required to assess how the response bias in different force directions of each afferent population could affect their ability to extract directional information. Such modeling may reveal that these biases reflect a peripheral organization optimized for various natural perceptual and manipulative tasks that require precise control of fingertip forces.
Footnotes
This study was supported by the Swedish Medical Research Council (project 08667) and the Göran Gustafsson Foundation for Research in Natural Sciences and Medicine. We thank Dr. G. Westling and L. Bäckström for designing and assembling the electromechanical stimulator.
Correspondence should be addressed to Ingvars Birznieks, Department of Integrative Medical Biology, Physiology Section, University of Umeå, SE-901 87 Umeå, Sweden. E-mail:ingvars.birznieks@physiol.umu.se.
REFERENCES
- 1.Batschelet E. Circular statistics in biology. Academic; New York: 1981. [Google Scholar]
- 2.Birznieks I, Burstedt MKO, Edin BB, Johansson RS. Mechanisms for force adjustments to unpredictable frictional changes at individual digits during two-fingered manipulation. J Neurophysiol. 1998;80:1989–2002. doi: 10.1152/jn.1998.80.4.1989. [DOI] [PubMed] [Google Scholar]
- 3.Bisley JW, Goodwin AW, Wheat HE. Responses of slowly adapting type I afferents from the sides and end of the finger to stimuli applied to the central part of the fingerpad. J Neurophysiol. 2000;84:57–64. doi: 10.1152/jn.2000.84.1.57. [DOI] [PubMed] [Google Scholar]
- 4.Blakemore SJ, Goodbody SJ, Wolpert DM. Predicting the consequences of our own actions: the role of sensorimotor context estimation. J Neurosci. 1998;18:7511–7518. doi: 10.1523/JNEUROSCI.18-18-07511.1998. [DOI] [PMC free article] [PubMed] [Google Scholar]
- 5.Burstedt MKO, Flanagan R, Johansson RS. Control of grasp stability in humans under different frictional conditions during multi-digit manipulation. J Neurophysiol. 1999;82:2393–2405. doi: 10.1152/jn.1999.82.5.2393. [DOI] [PubMed] [Google Scholar]
- 6.Chambers MR, Andres KH, von Duering M, Iggo A. The structure and function of the slowly adapting type II mechanoreceptor in hairy skin. J Exp Physiol. 1972;57:417–445. doi: 10.1113/expphysiol.1972.sp002177. [DOI] [PubMed] [Google Scholar]
- 7.Christel MI, Kitzel S, Niemitz C. How precisely do bonobos (Pan Paniscus) grasp small objects. Int J Primatol. 1998;19:165–194. [Google Scholar]
- 8.Dodson MJ, Goodwin AW, Browning AS, Gehring HM. Peripheral neural mechanisms determining the orientation of cylinders grasped by the digits. J Neurosci. 1998;18:521–530. doi: 10.1523/JNEUROSCI.18-01-00521.1998. [DOI] [PMC free article] [PubMed] [Google Scholar]
- 9.Duclaux R, Kenshalo DR. The temperature sensitivity of the type I slowly adapting mechanoreceptors in cats and monkeys. J Physiol (Lond) 1972;224:647–664. doi: 10.1113/jphysiol.1972.sp009917. [DOI] [PMC free article] [PubMed] [Google Scholar]
- 10.Edin BB, Bäckström PA, Bäckström LO. Single unit retrieval in microneurography: a microprocessor-based device controlled by an operator. J Neurosci Methods. 1988;24:137–144. doi: 10.1016/0165-0270(88)90057-x. [DOI] [PubMed] [Google Scholar]
- 11.Edin BB, Westling G, Johansson RS. Independent control of fingertip forces at individual digits during precision lifting in humans. J Physiol (Lond) 1992;450:547–564. doi: 10.1113/jphysiol.1992.sp019142. [DOI] [PMC free article] [PubMed] [Google Scholar]
- 12.Edin BB, Essick GK, Trulsson M, Olsson KA. Receptor encoding of moving tactile stimuli in humans. I. Temporal pattern of discharge of individual low-threshold mechanoreceptors. J Neurosci. 1995;15:830–847. doi: 10.1523/JNEUROSCI.15-01-00830.1995. [DOI] [PMC free article] [PubMed] [Google Scholar]
- 13.Flanagan JR, Lolley S. The inertial anisotropy of the arm is accurately predicted during movement planning. J Neurosci. 2001;21:1361–1369. doi: 10.1523/JNEUROSCI.21-04-01361.2001. [DOI] [PMC free article] [PubMed] [Google Scholar]
- 14.Flanagan JR, Tresilian JR. Grip load force coupling: a general control strategy for transporting objects. J Exp Psychol Hum Percept Perform. 1994;20:944–957. doi: 10.1037//0096-1523.20.5.944. [DOI] [PubMed] [Google Scholar]
- 15.Flanagan JR, Wing AM. The role of internal models in motion planning and control: evidence from grip force adjustments during movements of hand-held loads. J Neurosci. 1997;17:1519–1528. doi: 10.1523/JNEUROSCI.17-04-01519.1997. [DOI] [PMC free article] [PubMed] [Google Scholar]
- 16.Flanagan JR, Burstedt MKO, Johansson RS. Control of fingertip forces in multi-digit manipulation. J Neurophysiol. 1999;81:1706–1717. doi: 10.1152/jn.1999.81.4.1706. [DOI] [PubMed] [Google Scholar]
- 17.Georgopoulos AP, Schwartz AB, Kettner RE. Neuronal population coding of movement direction. Science. 1986;233:1416–1419. doi: 10.1126/science.3749885. [DOI] [PubMed] [Google Scholar]
- 18.Goodwin AW, Morley JW. Sinusoidal movement of a grating across the monkey's fingerpad: effect of contact angle and force of the grating on afferent fiber responses. J Neurosci. 1987;7:2192–2202. doi: 10.1523/JNEUROSCI.07-07-02192.1987. [DOI] [PMC free article] [PubMed] [Google Scholar]
- 19.Goodwin AW, Wheat HE. Effects of nonuniform fiber sensitivity, innervation geometry, and noise on information relayed by a population of slowly adapting type I primary afferents from the fingerpad. J Neurosci. 1999;19:8057–8070. doi: 10.1523/JNEUROSCI.19-18-08057.1999. [DOI] [PMC free article] [PubMed] [Google Scholar]
- 20.Goodwin AW, Browning AS, Wheat HE. Representation of curved surfaces in responses of mechanoreceptive afferent fibers innervating the monkey's fingerpad. J Neurosci. 1995;15:798–810. doi: 10.1523/JNEUROSCI.15-01-00798.1995. [DOI] [PMC free article] [PubMed] [Google Scholar]
- 21.Goodwin AW, Macefield VG, Bisley JW. Encoding of object curvature by tactile afferents from human fingers. J Neurophysiol. 1997;78:2881–2888. doi: 10.1152/jn.1997.78.6.2881. [DOI] [PubMed] [Google Scholar]
- 22.Goodwin AW, Jenmalm P, Johansson RS. Control of grip force when tilting objects: effect of curvature of grasped surfaces and of applied tangential torque. J Neurosci. 1998;18:10724–10734. doi: 10.1523/JNEUROSCI.18-24-10724.1998. [DOI] [PMC free article] [PubMed] [Google Scholar]
- 23.Green BG. Effect of skin temperature on vibrotactile sensitivity. Percept Psychophys. 1977;21:243–248. [Google Scholar]
- 24.Häger-Ross C, Cole KJ, Johansson RS. Grip force responses to unanticipated object loading: load direction reveals body- and gravity-referenced intrinsic task variables. Exp Brain Res. 1996;110:142–150. doi: 10.1007/BF00241383. [DOI] [PubMed] [Google Scholar]
- 25.Jenmalm P, Johansson RS. Visual and somatosensory information about object shape control manipulative finger tip forces. J Neurosci. 1997;17:4486–4499. doi: 10.1523/JNEUROSCI.17-11-04486.1997. [DOI] [PMC free article] [PubMed] [Google Scholar]
- 26.Jenmalm P, Dahlstedt S, Johansson RS. Visual and tactile information about object-curvature control fingertip forces and grasp kinematics in human dexterous manipulation. J Neurophysiol. 2000;84:2984–2997. doi: 10.1152/jn.2000.84.6.2984. [DOI] [PubMed] [Google Scholar]
- 27.Johansson RS. Tactile sensibility in the human hand: receptive field characteristics of mechanoreceptive units in the glabrous skin area. J Physiol (Lond) 1978;281:101–125. doi: 10.1113/jphysiol.1978.sp012411. [DOI] [PMC free article] [PubMed] [Google Scholar]
- 28.Johansson RS. Anonymous sensory guidance of movement. Novartis Foundation Symposium 218. Wiley; Chichester: 1998. Sensory input and control of grip. pp. 45–59. [DOI] [PubMed] [Google Scholar]
- 29.Johansson RS, Cole KJ. Sensory-motor coordination during grasping and manipulative actions. Curr Opin Neurobiol. 1992;2:815–823. doi: 10.1016/0959-4388(92)90139-c. [DOI] [PubMed] [Google Scholar]
- 30.Johansson RS, Vallbo AB. Tactile sensibility in the human hand: relative and absolute densities of four types of mechanoreceptive units in glabrous skin. J Physiol (Lond) 1979;286:283–300. doi: 10.1113/jphysiol.1979.sp012619. [DOI] [PMC free article] [PubMed] [Google Scholar]
- 31.Johansson RS, Vallbo AB. Spatial properties of the population of mechanoreceptive units in the glabrous skin of the human hand. Brain Res. 1980;184:353–366. doi: 10.1016/0006-8993(80)90804-5. [DOI] [PubMed] [Google Scholar]
- 32.Johansson RS, Vallbo ÅB. Tactile sensory coding in the glabrous skin of the human hand. Trends Neurosci. 1983;6:27–31. [Google Scholar]
- 33.Johansson RS, Westling G. Roles of glabrous skin receptors and sensorimotor memory in automatic control of precision grip when lifting rougher or more slippery objects. Exp Brain Res. 1984;56:550–564. doi: 10.1007/BF00237997. [DOI] [PubMed] [Google Scholar]
- 34.Johansson RS, Westling G. Signals in tactile afferents from the fingers eliciting adaptive motor responses during precision grip. Exp Brain Res. 1987;66:141–154. doi: 10.1007/BF00236210. [DOI] [PubMed] [Google Scholar]
- 35.Johansson RS, Vallbo AB, Westling G. Thresholds of mechanosensitive afferents in the human hand as measured with von Frey hairs. Brain Res. 1980;184:343–351. doi: 10.1016/0006-8993(80)90803-3. [DOI] [PubMed] [Google Scholar]
- 36.Johansson RS, Häger C, Bäckström L. Somatosensory control of precision grip during unpredictable pulling loads. III. Impairments during digital anesthesia. Exp Brain Res. 1992;89:204–213. doi: 10.1007/BF00229017. [DOI] [PubMed] [Google Scholar]
- 37.Johansson RS, Backlin JL, Burstedt MKO. Control of grasp stability during pronation and supination movements. Exp Brain Res. 1999;128:20–30. doi: 10.1007/s002210050813. [DOI] [PubMed] [Google Scholar]
- 38.Johnson KO. Reconstruction of population response to a vibratory stimulus in quickly adapting mechanoreceptive afferent fiber population innervating glabrous skin of the monkey. J Neurophysiol. 1974;37:48–72. doi: 10.1152/jn.1974.37.1.48. [DOI] [PubMed] [Google Scholar]
- 39.Johnson KO, Hsiao SS. Neural mechanisms of tactual form and texture perception. Annu Rev Neurosci. 1992;15:227–250. doi: 10.1146/annurev.ne.15.030192.001303. [DOI] [PubMed] [Google Scholar]
- 40.Jones FW. The principles of anatomy as seen in the hand. Bailliére; London: 1946. [Google Scholar]
- 41.Kawato M. Internal models for motor control and trajectory planning. Curr Opin Neurobiol. 1999;9:718–727. doi: 10.1016/s0959-4388(99)00028-8. [DOI] [PubMed] [Google Scholar]
- 42.Khalsa PS, Friedman RM, Srinivasan MA, LaMotte RH. Encoding of shape and orientation of objects indented into the monkey fingerpad by populations of slowly and rapidly adapting mechanoreceptors. J Neurophysiol. 1998;79:3238–3251. doi: 10.1152/jn.1998.79.6.3238. [DOI] [PubMed] [Google Scholar]
- 43.Knibestöl M. Stimulus-response functions of rapidly adapting mechanoreceptors in human glabrous skin area. J Physiol (Lond) 1973;232:427–452. doi: 10.1113/jphysiol.1973.sp010279. [DOI] [PMC free article] [PubMed] [Google Scholar]
- 44.Knibestöl M. Stimulus-response functions of slowly adapting mechanoreceptors in the human glabrous skin area. J Physiol (Lond) 1975;245:63–80. doi: 10.1113/jphysiol.1975.sp010835. [DOI] [PMC free article] [PubMed] [Google Scholar]
- 45.Knibestöl M, Vallbo AB. Single unit analysis of mechanoreceptor activity from the human glabrous skin. Acta Physiol Scand. 1970;80:178–195. doi: 10.1111/j.1748-1716.1970.tb04783.x. [DOI] [PubMed] [Google Scholar]
- 46.Kunesch E, Binkofski F, Freund H-J. Invariant temporal characteristics of manipulative hand movements. Exp Brain Res. 1989;78:539–546. doi: 10.1007/BF00230241. [DOI] [PubMed] [Google Scholar]
- 47.LaMotte RH, Srinivasan MA. Tactile discrimination of shape: responses of slowly adapting mechanoreceptive afferents to a step stroked across the monkey fingerpad. J Neurosci. 1987;7:1655–1671. doi: 10.1523/JNEUROSCI.07-06-01655.1987. [DOI] [PMC free article] [PubMed] [Google Scholar]
- 48.LaMotte RH, Srinivasan MA. Neural encoding of shape: responses of cutaneous mechanoreceptors to a wavy surface stroked across the monkey fingerpad. J Neurophysiol. 1996;76:3787–3797. doi: 10.1152/jn.1996.76.6.3787. [DOI] [PubMed] [Google Scholar]
- 49.Macefield VG, Hager-Ross C, Johansson RS. Control of grip force during restraint of an object held between finger and thumb: responses of cutaneous afferents from the digits. Exp Brain Res. 1996;108:155–171. doi: 10.1007/BF00242913. [DOI] [PubMed] [Google Scholar]
- 50.Mackel R. Conduction of neural impulses in human mechanoreceptive cutaneous afferents. J Physiol (Lond) 1988;401:597–615. doi: 10.1113/jphysiol.1988.sp017182. [DOI] [PMC free article] [PubMed] [Google Scholar]
- 51.Maeno T, Kobay-Ashi K, Yamazaki N. Relationship between the structure of human finger tissue and the location of tactile receptors. JSME Int J. 1998;41:94–100. [Google Scholar]
- 52.Miall RC, Wolpert DM. Forward models for physiological motor control. Neural Networks. 1996;9:1265–1279. doi: 10.1016/s0893-6080(96)00035-4. [DOI] [PubMed] [Google Scholar]
- 53.Moberg E. Criticism and study of methods for examining sensibility in the hand. Neurology. 1962;12:8–19. doi: 10.1212/wnl.12.1.8. [DOI] [PubMed] [Google Scholar]
- 54.Mott FW, Sherrington CS. Experiments upon the influence of sensory nerves upon movement and nutrition of the limbs. Preliminary communication. Proc R Soc Lond B Biol Sci. 1895;57:481–488. [Google Scholar]
- 55.Nakazawa N, Ikeura R, Inooka H. Characteristics of human fingertips in the shearing direction. Biol Cybern. 2000;82:207–214. doi: 10.1007/s004220050020. [DOI] [PubMed] [Google Scholar]
- 56.Olausson H, Wessberg J, Kakuda N. Tactile directional sensibility: peripheral neural mechanisms in man. Brain Res. 2000;866:178–187. doi: 10.1016/s0006-8993(00)02278-2. [DOI] [PubMed] [Google Scholar]
- 57.Pawluk DT, Howe RD. Dynamic lumped element response of the human fingerpad. J Biomech Eng. 1999;121:178–183. doi: 10.1115/1.2835100. [DOI] [PubMed] [Google Scholar]
- 58.Phillips JR, Johnson KO. Tactile spatial resolution. III. A continuum mechanics model of skin predicting mechanoreceptor responses to bars, edges, and gratings. J Neurophysiol. 1981;46:1204–1225. doi: 10.1152/jn.1981.46.6.1204. [DOI] [PubMed] [Google Scholar]
- 59.Phillips JR, Johansson RS, Johnson KO. Responses of human mechanoreceptive afferents to embossed dot arrays scanned across fingerpad skin. J Neurosci. 1992;12:827–839. doi: 10.1523/JNEUROSCI.12-03-00827.1992. [DOI] [PMC free article] [PubMed] [Google Scholar]
- 60.Pubols BH., Jr Factors affecting cutaneous mechanoreceptor response: I. Constant force versus constant displacement stimulation. J Neurophysiol. 1982a;47:515–529. doi: 10.1152/jn.1982.47.3.515. [DOI] [PubMed] [Google Scholar]
- 61.Pubols BH., Jr Factors affecting cutaneous mechanoreceptor response: II. Changes in mechanical properties of skin with repeated stimulation. J Neurophysiol. 1982b;47:530–542. doi: 10.1152/jn.1982.47.3.530. [DOI] [PubMed] [Google Scholar]
- 62.Serina ER, Mockensturm E, Mote CD, Jr, Rempel D. A structural model of the forced compression of the fingertip pulp. J Biomech. 1998;31:639–646. doi: 10.1016/s0021-9290(98)00067-0. [DOI] [PubMed] [Google Scholar]
- 63.Siegel S, Castellan NJ. Nonparametric statistics for the behavioral sciences, Ed 2. McGraw-Hill; New York: 1988. [Google Scholar]
- 64.Srinivasan MA, LaMotte RH. Tactile discrimination of shape: responses of slowly and rapidly adapting mechanoreceptive afferents to a step indented into the monkey fingerpad. J Neurosci. 1987;7:1682–1697. doi: 10.1523/JNEUROSCI.07-06-01682.1987. [DOI] [PMC free article] [PubMed] [Google Scholar]
- 65.Srinivasan MA, Whitehouse JM, LaMotte RH. Tactile detection of slip: surface microgeometry and peripheral neural codes. J Neurophysiol. 1990;63:1323–1332. doi: 10.1152/jn.1990.63.6.1323. [DOI] [PubMed] [Google Scholar]
- 66.Trulsson M, Johansson RS, Olsson K. Directional sensitivity of human periodontal mechanoreceptive afferents to forces applied to the teeth. J Physiol (Lond) 1992;447:373–389. doi: 10.1113/jphysiol.1992.sp019007. [DOI] [PMC free article] [PubMed] [Google Scholar]
- 67.Vallbo AB, Hagbarth KE. Activity from skin mechanoreceptors recorded percutaneously in awake human subjects. Exp Neurol. 1968;21:270–289. doi: 10.1016/0014-4886(68)90041-1. [DOI] [PubMed] [Google Scholar]
- 68.Vallbo AB, Johansson RS. Properties of cutaneous mechanoreceptors in the human hand related to touch sensation. Hum Neurobiol. 1984;3:3–14. [PubMed] [Google Scholar]
- 69.Vega-Bermudez F, Johnson KO. Surround suppression in the responses of primate SA1 and RA mechanoreceptive afferents mapped with a probe array. J Neurophysiol. 1999;81:2711–2719. doi: 10.1152/jn.1999.81.6.2711. [DOI] [PubMed] [Google Scholar]
- 70.Westling G, Johansson RS. Factors influencing the force control during precision grip. Exp Brain Res. 1984;53:277–284. doi: 10.1007/BF00238156. [DOI] [PubMed] [Google Scholar]
- 71.Westling G, Johansson RS. Responses in glabrous skin mechanoreceptors during precision grip in humans. Exp Brain Res. 1987;66:128–140. doi: 10.1007/BF00236209. [DOI] [PubMed] [Google Scholar]
- 72.Wheat HE, Goodwin AW, Browning AS. Tactile resolution: peripheral neural mechanisms underlying the human capacity to determine positions of objects contacting the fingerpad. J Neurosci. 1995;15:5582–5595. doi: 10.1523/JNEUROSCI.15-08-05582.1995. [DOI] [PMC free article] [PubMed] [Google Scholar]
- 73.Witney AG, Goodbody SJ, Wolpert DM. Predictive motor learning of temporal delays. J Neurophysiol. 1999;82:2039–2048. doi: 10.1152/jn.1999.82.5.2039. [DOI] [PubMed] [Google Scholar]
- 74.Wolpert DM. Computational approaches to motor control. Trends Cogn Sci. 1997;1:209–216. doi: 10.1016/S1364-6613(97)01070-X. [DOI] [PubMed] [Google Scholar]
- 75.Zar JH. Biostatistical analyses. Prentice-Hall; Englewood Cliffs, NJ: 1996. [Google Scholar]