

Abstract
Neurons in Huntington's disease exhibit selective morphological and subcellular alterations in the striatum and cortex. The link between these neuronal changes and behavioral abnormalities is unclear. We investigated relationships between essential neuronal changes that predict motor impairment and possible involvement of the corticostriatal pathway in developing behavioral phenotypes. We therefore generated heterozygote mice expressing the N-terminal one-third of huntingtin with normal (CT18) or expanded (HD46, HD100) glutamine repeats. The HD mice exhibited motor deficits between 3 and 10 months. The age of onset depended on an expanded polyglutamine length; phenotype severity correlated with increasing age. Neuronal changes in the striatum (nuclear inclusions) preceded the onset of phenotype, whereas cortical changes, especially the accumulation of huntingtin in the nucleus and cytoplasm and the appearance of dysmorphic dendrites, predicted the onset and severity of behavioral deficits. Striatal neurons in the HD mice displayed altered responses to cortical stimulation and to activation by the excitotoxic agent NMDA. Application of NMDA increased intracellular Ca2+ levels in HD100 neurons compared with wild-type neurons. Results suggest that motor deficits in Huntington's disease arise from cumulative morphological and physiological changes in neurons that impair corticostriatal circuitry.
Keywords: cortex, Huntington's disease, NMDA, neuronal morphology, striatum, transgenic mice
Huntington's disease is a fatal autosomal dominant neurodegenerative disease characterized by movement abnormalities, psychiatric disturbances, and dementia (Huntington, 1872). The gene mutation in Huntington's disease comprises a lengthening of a series of CAG repeats beyond 35 in a gene encoding a protein called huntingtin (Huntington's Disease Collaborative Research Group, 1993). Although mutant huntingtin has a widespread distribution in neuronal and non-neuronal tissues, neurons in the striatum and cortex layers 3, 5, and 6 demonstrate characteristic cellular and subcellular pathological changes, including formation of nuclear inclusions and dystrophic neurites containing N-terminal mutant huntingtin (Vonsattel et al., 1985; DiFiglia et al., 1997; Vonsattel and DiFiglia, 1998).
In murine models of Huntington's disease the cellular features differ among transgenic models and from morphological changes observed in the Huntington's disease patient brain. Mice expressing very truncated transgenes develop widespread nuclear inclusions (Davies et al., 1997;Schilling et al., 1999), far more than exist in the HD patient brain (DiFiglia et al., 1997). Mice with full-length mutant huntingtin have fewer inclusions than in the human condition (Reddy et al., 1998;Hodgson et al., 1999). Striatal cell loss, a hallmark of change in the patient brain, is not striking in most Huntington's disease mouse models, except in some older mice with full-length mutant huntingtin that are hypokinetic or akinetic (Reddy et al., 1998, 1999). Still, current murine models of Huntington's disease manifest behavioral changes. Thus, neuronal dysfunction as implicated by abnormal neuronal morphology, and not cell death, might underlie movement abnormalities in Huntington's disease.
To address these issues, we generated transgenic mice with 18, 46, and 100 CAG repeats in a human huntingtin cDNA that encoded the first one-third of the huntingtin protein. The CAG repeat lengths are consistent with the normal human (18), adult form of Huntington's disease (46), and the juvenile form (100). This size of huntingtin protein causes the same cellular pathology as full-length mutant huntingtin in transfected clonal medium spiny neurons (Kim et al., 1999; Kegel et al., 2000). The morphologic and subcellular abnormalities in vitro mimic those in striatum and cortex in Huntington's disease. Thus, we have evidence that this portion of huntingtin with an expanded polyglutamine repeat is sufficient to reproduce morphological changes of Huntington's disease.
On the basis of morphological, behavioral, and electrophysiological evidence from our transgenic murine model of Huntington's disease, changes in cortical neurons, including nuclear and cytoplasmic accumulation of huntingtin and the appearance of dysmorphic dendrites, were correlated the most closely with the onset of motor deficits. Striatal neurons in transgenic mice had marked alterations in electrophysiological responses to corpus callosum stimulation (corticostriatal pathway) and in the activation of NMDA receptors. Thus, we propose that the effects of mutant huntingtin on cortical neurons play a critical role in striatal neuronal dysfunction in Huntington's disease and in its neurologic impairment.
MATERIALS AND METHODS
Transgene design
The initial 3 kb of the human huntingtin-encoding cDNA sequence IT15 (Huntington's Disease Collaborative Research Group, 1993) were cloned into transfer plasmid AcMNPV downstream from the rat neuron-specific enolase promoter and its first intron (Fig.1A). An eight-amino-acid FLAG epitope tag was included just 5′ to the IT15 sequence to permit immunologic detection of the transgene. Three different CAG repeat lengths, 18, 46, and 100, were inserted into the sequence. The construct included an SV40 polyadenylation signal. The full 3 kb length of the IT15 cDNA used in the transgene was sequenced.
Fig. 1.
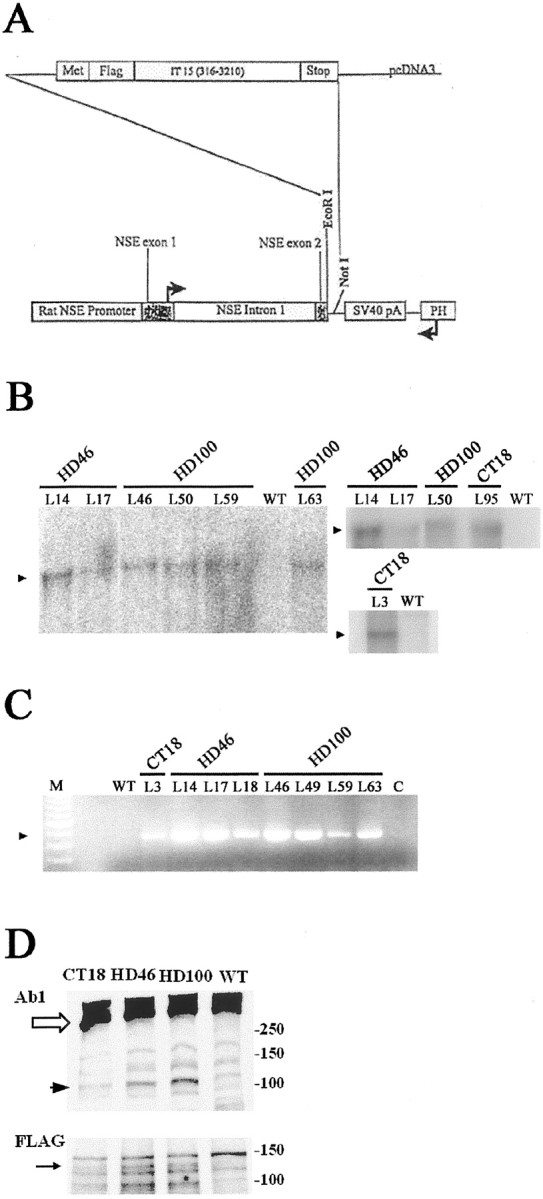
Design and expression analysis of transgenes CT18, HD46, and HD100. A, Map of construct used for transgene vector. Bases 316–3210 of the human huntingtin cDNA sequence (IT15), modified to contain 18, 46, or 100 CAG repeats, were cloned into AcMNPV transfer plasmid NSE4-BV. A rat neuron-specific enolase promoter regulates expression. An N-terminal epitope tag, FLAG, was included to permit differential identification of the transgene-encoded huntingtin product. Northern blot and RT-PCR analyses confirm RNA expression from CT18, HD46, and HD100 transgenes.B, The Northern blot demonstrates transgene expression in different HD46 and HD100 lineages (denoted above thelanes). B, Left andTop right, Total RNA (10 μg) per lane.B, Bottom right, Total RNA (30 μg) per lane. An arrowhead (▴) marks the bands corresponding to transgene-encoded RNA. Wild-type controllanes show no transgene-derived message.C, RT-PCR results from CT18, HD46, and HD100 lineages. Lane M, A 100 base pair ladder; lane C, no RNA control. Anarrowhead (▴) marks the position of the expected RT-PCR product. Expression is seen in all transgenic lineages but is absent from the transgene-negative (WT) control.D, Western blot analysis of huntingtin (top) and FLAG (bottom) immunoreactivity in WT, CT18, HD46, and HD100 mice. D,Top, A product of the expected size (∼120 kDa,black arrowhead) is present in the transgenic mice, but not in WT. Native huntingtin is denoted with a white arrow. The signal intensity for the ∼120 kDa product is stronger in the HD mice compared with CT. Huntingtin is detected with antiserum Ab1. D, Bottom, A product of the expected size (∼120 kDa, black arrow) is present in the transgenic mice, but not in WT.
Generation and genotyping of transgenic mice
Transgene DNA for microinjection was treated withPacI, purified, and used to microinject oocyte pronuclei from C57BL/6×SJL F1 hybrid mice. Transgenic mice were generated and maintained in the Transgenic Core Facility at the University of Massachusetts Medical School. Genomic DNA from F0 mice was extracted from tail biopsies and characterized initially by Southern blot analysis, using a cDNA IT15 probe. After transgene-positive founders were identified, lineages were screened by Southern blot or PCR analysis. Estimation of transgene insertion site and copy number followed the procedure of Reddy et al. (1998).
Detecting expression of the huntingtin transgene
Evidence for transcription of the transgene was provided by analysis of total RNA in Northern blots and RT-PCR. Western blot analysis was performed as reported previously (Aronin et al., 1995).
Behavioral analysis
All transgenic animals were maintained in microisolator cages with free access to food and water under pathogen-free conditions in a 12 hr light/dark cycle in the Animal Medicine Facility at the University of Massachusetts Medical School. After weaning, the males were housed singly, and the female littermates were housed grouped. Care and handling of experimental animals complied fully with institutional, Society for Neuroscience, and federal guidelines for humane treatment. Behavioral analyses were performed in the mornings, circadian time CT 1–6 hr.
Animals were evaluated neurologically with four tests: rotarod performance, clasping, activity level, and gait. Evaluation of clasping, activity level, and gait were subjective. Two observers tested 474 mice so that the testing procedures would be performed consistently. We cannot state with certainty that the observers did not know or suspect the HD genotype, because WT mice rarely displayed behavioral changes under 12 months of age. We used only robust changes in clasping, activity, and gait to minimize observer bias. Observations were made at the same examination to minimize age as a variable.
Rotarod performance. This analysis used a rotarod apparatus (Economex Rotarod, Columbus Instruments, Columbus, OH) to assess the ability of the animals to stay on a rotating rod through successive 2 min trials at increasing speeds. The mice were pretrained on the rotarod for five trials at low speed (214 cm/min) for up to 120 sec. Animals then were tested for one trial each at medium (277 cm/min) and high speed (340 cm/min). The rotarod score (0–120 sec) equaled the mean number of seconds the animal stayed on the rotarod at low speed averaged with the mean of the two higher speed trials. For inclusion in the hazard analysis, rotarod scores of <60 sec were considered abnormal. Rotarod scores had a bimodal distribution, with clusters of HD mice below 60 sec and with control and wild-type mice above 60 sec. To validate our rotarod protocol, we tested 181 different mice (wild type, CT18, HD46, and HD100) in the rotarod protocol of Clark et al. (1997) and found no differences in the rotarod results when compared with our method.
Clasping. Mice were held suspended by the tail for up to 1 min at a height of 15 cm. Clasping was defined as grabbing forepaws alone or forepaws and hindlimbs simultaneously. A presence of clasp required paws to be pressed against the chest with the spine in a lordotic position. Clasp was scored as its presence or absence.
Activity level. Hyperactivity was defined as circling or rapid to-and-fro movement, also known as stereotypic behavior. Hypoactivity was defined as paucity of spontaneous movement. The mice were not perturbed to elicit activity. If an animal did not meander voluntarily in the cage, the observer picked up the cage, which was sufficient to elicit meandering in most mice. Activity was scored as the presence or absence of hypoactivity or hyperactivity.
Gait. Abnormal gaits included wide-based gait, walking with an arched posture, or slow gait with tremulousness. Gait was scored as the presence or absence of an abnormal gait. For emphasis, only robust changes in clasping, activity, or gait would be detected with the scoring of these behaviors.
Morphological analysis
Immunohistochemistry antibodies. Anti-huntingtin rabbit antisera were made with the N terminus of huntingtin (Ab1) and an internal epitope of huntingtin (Ab585; amino acids 585–725). Both antisera were characterized as reported previously (DiFiglia et al., 1995).
Immunohistochemical procedure. After perfusion with 4% paraformaldehyde in PBS, the brains of the mice were removed, post-fixed in paraformaldehyde, and sectioned at 40 μm. A series of treatments with primary antiserum, biotinylated anti-rabbit antiserum, and avidin–biotin horseradish peroxidase complex followed. The chromogen was diaminobenzidine. Details were described by DiFiglia et al. (1995). Controls included omission of primary antisera and competitive incubation with 10 μg of huntingtin peptide.
Light microscopy. Examination of brain sections was performed without previous knowledge of the genotype or phenotype of mice.
Cell counts and cross-sectional area measurements. The cell counts were obtained in seven wild-type controls (mean age, 9.4 months, range 3–17 months), three CT18 mice (all 18 months), and seven HD100 mice (mean age, 8.7 months, range 3–17 months), using a stereological method described by Hyman et al. (1998). Briefly, 40 μm sections were cut through the entire striatum and stained with cresyl violet; every sixth section was assessed, totaling 10–12 sections per striatum. At 1000× magnification, all neurons in 100 × 100 μm fields were counted in every sixth field throughout the section. In all, 50–60 fields were counted for each brain from which an average and SD were determined. For measurement of cross-sectional area, digital computer images of 25 striatal neurons per mouse were acquired through the microscope with a 100× objective lens and Sigma Scan software (Jandel Scientific, San Rafael, CA). The mean values from five controls (three wild type and two CT18) and six HD mice (five HD100 and one HD46) were analyzed with a two-tailed Student's t test. The ages of the controls (11 months ± 2.4) and the HD mice (8.1 months ± 4.8) were not significantly different.
Assessment of dendrite morphology in biocytin-filled neurons.To provide a set of unbiased estimates, three observers, who were blinded to the genotype from which the neurons were obtained, counted J-dendrites and wavy dendrites in all recovered cells on a set of qualitative scales (for J-dendrites: 0 = dendrites extend normally, 1 = one or two dendrites begin to turn, 2 = one or two dendrites make close to a complete turn, and 3 = three or more dendrites make close to a complete turn; for wavy dendrites: 0 = dendrites extend normally, 1 = one or two have moderately wavy dendrites, 2 = two or three have obviously wavy dendrites, 3 = three or more dendrites have obvious waviness, 4 = there are many wavy dendrites, some severe, and 5 = almost all dendrites are severely wavy). There was a high counting reliability for both measures.
Electrophysiology
Slice preparation. Preparation of tissue was similar to procedures described previously (Cepeda et al., 1998; Levine et al., 1999). Twenty-six mice (17 HD100 and 9 WT) were used for electrophysiology. The mice were decapitated. After dissection the brains were placed in ice-cold oxygenated artificial CSF (aCSF) [containing (in mm) 130 NaCl, 26 NaHCO3, 3 KCl, 5 MgCl2, 1.25 NaH2PO4, 1 CaCl2, and 10 glucose, pH 7.2–7.4]. Coronal brain sections containing the striatum were cut (350 μm) and placed in oxygenated aCSF, but with 2 mm each CaCl2 and MgCl2. After 1 hr the slice was transferred to a recording chamber.
Current clamp. In the recording chamber the slices were perfused constantly with oxygenated aCSF [containing (in mm) 124 NaCl, 2 MgSO4, 2 CaCl2, 5 KCl, 1.25 NaH2PO4, 26 NaHCO3, and 10 glucose at 31–32°C, with 50 μm picrotoxin to block the responses mediated by activation of GABAA receptors] in an atmosphere of warm, moist 95% O2/5% CO2. Responses of individual cells were recorded by sharp microelectrodes filled with 3 mK+-acetate, 5 mm KCl, and 2% w/v biocytin (Sigma, St. Louis, MO) to label dendritic and axonal processes. After the experiment the slice was fixed in 4% paraformaldehyde overnight and processed according to published protocols (Kita and Armstrong, 1991). Resting membrane potentials were recorded only after the cell had recovered from penetration and had stabilized (at least 15 min after impalement). The current–voltage relationship was determined from the responses to incrementally increasing square wave hyperpolarizing and depolarizing current pulses delivered via the recording electrode. To examine synaptic responses, we placed a bipolar stimulating electrode in the corpus callosum to activate the corticostriatal fibers preferentially. Stimuli (100 μsec duration, variable intensity from 100 μA to 5 mA) were delivered every 5 sec, and input–output relationships were determined. Responses were averages of five traces.
Whole-cell voltage clamp. Neurons were visualized in the slice with a fixed-stage upright microscope (Olympus, Model BX50WI) and submerged in continuously flowing oxygenated aCSF (25°C, 4 ml/min). Cells were visualized with a 40× water immersion lens that used differential interference contrast optics and were illuminated with near-infrared light (790 nm; Ealing Optics, Holliston, MA). The image was detected with an infrared-sensitive CCD camera. Patch electrodes (3–6 MΩ) were filled with the following internal solution (in mm): 130 Cs-methanesulfonate, 10 CsCl, 4 NaCl, 1 MgCl2, 5 Mg-ATP, 5 EGTA, 10 HEPES, 0.5 GTP, 10 phosphocreatine, and 0.1 leupeptin, pH 7.25–7.3, with an osmolality of 280–290 mOsm. An Axopatch 200A (Axon Instruments, Foster City, CA) was used for recording. A 3 m KCl agar bridge was inserted between the extracellular solution and the Ag–AgCl indifferent electrode. Tight seals (2–5 GΩ) from visualized medium-sized cells were obtained by applying negative pressure. Recordings were not corrected for junction potentials, which ranged from 2–3 mV. Leak subtraction was performed on-line with the Axopatch 200B amplifier. The membrane was disrupted with additional suction to obtain the whole-cell configuration. Access resistances ranged from 10 to 25 MΩ and were compensated 60–85%. Cells were held at −70 mV to minimize contributions of voltage-gated currents. Voltage-gated currents also were blocked with the following solution: 1 μm tetrodotoxin (TTX), 100–200 μm Cd2+, 3 mmCs, 20 mm tetraethylammonium (TEA), and 2 mm4-aminopyridine (4-AP). NMDA was bath applied to the striatal slice. Non-NMDA receptor activation was blocked with 6-cyano-7-nitroquinoxaline-2, 3-dione (CNQX; 5 μm). Cell capacitances and input resistances were measured by applying a 10 mV depolarizing voltage command and by using the membrane test function integrated in the pClamp8 software (Axon Instruments).
Statistical analysis
For the behavioral analysis, logistical regression (Draper and Smith, 1998) was used when behaviors were ranked as the presence or absence of an abnormality (clasping, activity, gait). Linear regression (Draper and Smith, 1998) was used for rotarod tests. In analyses in which the number of abnormalities in each mouse was examined, we converted the rotarod to the presence or absence of abnormality. Rotarod tests were distributed in a bimodal pattern. The range spanned 48–78 sec between the two modes. We selected 60 sec as the cutoff for a normal rotarod test. A hazard score was used to compare the rates at which subsets of mice developed behavioral abnormalities. Hazard score is a rate that assesses the short-term conditional probability of developing an abnormality. The rate over a particular time interval is calculated by using the number of mice in subsets (WT and CT18 vs HD46 and HD100) becoming abnormal over that interval, conditional on the number of animals that remained healthy at the beginning of the interval (Collett, 1994). To determine possible correlations between behavioral deficits and neuropathological findings, we used the CORR procedure (SAS statistical analysis software; SAS Institute, Cary, NC) to generate Pearson correlation coefficients. For analysis of electrophysiological changes, Welch's approximation to thet test for unequal variances (Welch, 1947) and ANOVA with Bonferroni correction were used.
RESULTS
Verification of mice with huntingtin transgenes
Southern blot analysis confirmed insertion of mutant (HD) and wild-type (CT) huntingtin transgenes into the mouse genome (transgene map shown in Fig. 1A). Multiple lineages with 18, 46, and 100 CAG repeat lengths were identified. The lineages had a range of copy numbers, estimated from 1–52 (CT18: 1, 5; HD46: 11, 15, 23, 52; HD100: 3, 5, 6, 10, 11, 12), and different insertion sites (data not shown). As detected by Northern blot analysis (Fig.1B) and RT-PCR (Fig. 1C), RNA expression demonstrated transgene transcription. Western blot analysis that used anti-huntingtin and anti-FLAG antisera confirmed the presence of a protein of the expected size for the transgene product (∼120 kDa) (Fig. 1D). Protein expression in Western blot was less than that of native huntingtin and variable in the HD mice. Immunohistochemistry with anti-FLAG and anti-huntingtin antibodies detected nuclear inclusions and other changes in the HD mice, consistent with the expression of the mutant transgene (see below).
Mutant huntingtin transgenes promote neurological impairments
We studied 474 mice, distributed as wild type (n = 110) and transgenics with 18 CAG (CT18, n = 30), 46 CAG (HD46, n = 146), and 100 CAG (HD100, n= 188). Animals were tested from all lineages and from generations up to F6. Neither lineage nor copy number influenced the neurological outcomes. Age had a separate but weak effect on neurological outcomes (p < 0.05).
Neurological outcomes were scored as normal versus abnormal for clasping, gait, and activity; significance was tested by logistic regression. The performance in staying on the rotarod was scored in seconds, and linear regression was used for statistical analysis. There was no significant difference between wild-type mice and CT18 mice for any of the neurological tests. Compared with wild type or CT18, HD46 showed differences in clasping (p < 0.001), gait (p < 0.05), activity (p < 0.001), and rotarod (p < 0.001). HD100 mice also demonstrated a difference in each neurological test (p < 0.001 for each).
The frequency of the number of neurological abnormalities also was evaluated in a χ2 distribution, regardless of age (Table 1). Approximately 80% of the wild-type and CT18 mice had no neurological impairment, whereas 60% of the HD46 mice and 72% of the HD100 mice had at least one abnormality. Furthermore, the HD46 and HD100 were more likely to have more than one abnormal neurological test.
Table 1.
Number of neurological abnormalities in WT, CT18, HD46, and HD100 mice: χ2 analysis
| Number of abnormalities | WT | CT18 | HD46* | HD100* |
|---|---|---|---|---|
| 0 | 78.2 (86) | 80.0 (24) | 39.7 (58) | 27.7 (52) |
| 1 | 17.3 (19) | 20.0 (6) | 42.5 (62) | 52.7 (99) |
| 2 | 3.6 (4) | 0 (0) | 10.3 (15) | 16.0 (30) |
| 3 | 0.9 (1) | 0 (0) | 5.5 (8) | 3.2 (6) |
| 4 | 0 (0) | 0 (0) | 2.1 (3) | 0.5 (1) |
HD46 and HD100 groups have a significantly higher percentage of mice with one or more neurological abnormalities than do WT or CT18 mice. The percentage of animals in each group (WT, CT18, HD46, and HD100) having 0, 1, 2, 3, or 4 neurological deficits is shown in each column. The actual numbers of affected animals in each category are shown in parentheses. χ2 analysis demonstrates that HD46 and HD100 groups (asterisks) have a significantly higher percentage of animals with single or multiple deficits than do WT or CT18 (p < 0.001).
To determine the rate at which neurological impairments presented, we generated a hazard score. A hazard score is the measurement of change in behavior as a function of time. In this formulation the test outcome was either normal or abnormal. Rotarod scores of <60 sec were considered abnormal (derivation in Materials and Methods). Figure2 shows that for both wild-type and CT18 mice there is little likelihood of developing a behavioral abnormality for the first 12 months of life, but the rate of developing neurological deficits increases after 12 months. However, the HD46 and the HD100 transgenic mice demonstrate an increase in the rate of developing an abnormality by 3 months. The rate increases through the lifespan of the population of mice.
Fig. 2.

Hazard score for WT/CT18 versus HD46/HD100. Hazard scores calculate the rate of development of neurological deficits over time. Mice with normal polyglutamine length (WT, CT18 ⋄) were compared with transgenics with expanded polyglutamines (HD46, HD100 ▪). WT and CT18 have a near-zero hazard rate for the first 12 months; the rate rises thereafter, suggesting late development of severe symptoms. Conversely, the hazard rate for HD46 and HD100 begins to increase in the first month and continues to climb, indicating that phenotypic expression of HD transgenes with expanded polyglutamines begins early and increases with age.
Neuropathological changes in the HD mice: accumulation of huntingtin, dysmorphic dendrites, vacuoles, membrane blebs, and atrophy
We evaluated the localization of huntingtin in HD, CT18, and WT mice. Huntingtin staining detected with Ab1 and Ab585 antisera was increased markedly in the somatodendritic cytoplasm of cortical and striatal neurons of HD46 (n = 9) and HD100 (n = 26) compared with CT18 (n = 6) and WT (n = 4) mice (Fig.3a). Cortical pyramidal neurons in the HD mice had dysmorphic dendrites, which were characterized by marked retraction and disorientation of the apical dendrite (Fig. 3b–d). Cytoplasmic huntingtin accumulation and dysmorphic changes were seen in the cortex of all HD lineages, were especially prevalent in frontal and cingulate cortices, and occurred variably and infrequently in piriform and hippocampal cortices. Intracytoplasmic vacuoles and plasma membrane blebs appeared in cell bodies and dendrites of some of the HD neurons that had a cytoplasmic accumulation of huntingtin (Fig. 3e). Dysmorphic dendrites were not present in hippocampal pyramidal neurons of five of eight mice examined, were sparse in two mice, and extensive in a severely affected mouse. This severely affected mouse also showed dysmorphic dendrites in some cerebellar Purkinje cells and shrunken neurons in hippocampus and cerebellum. Except for the most severely affected HD mouse, other brain regions known to be relatively uninvolved at early stages of Huntington's disease had no or mild neuropathological changes when compared with cortex and striatum. Thus, dysmorphic dendrites were not evident in other brain regions of most HD mice, despite increased somatodendritic cytoplasmic labeling for huntingtin in the neurons there.
Fig. 3.
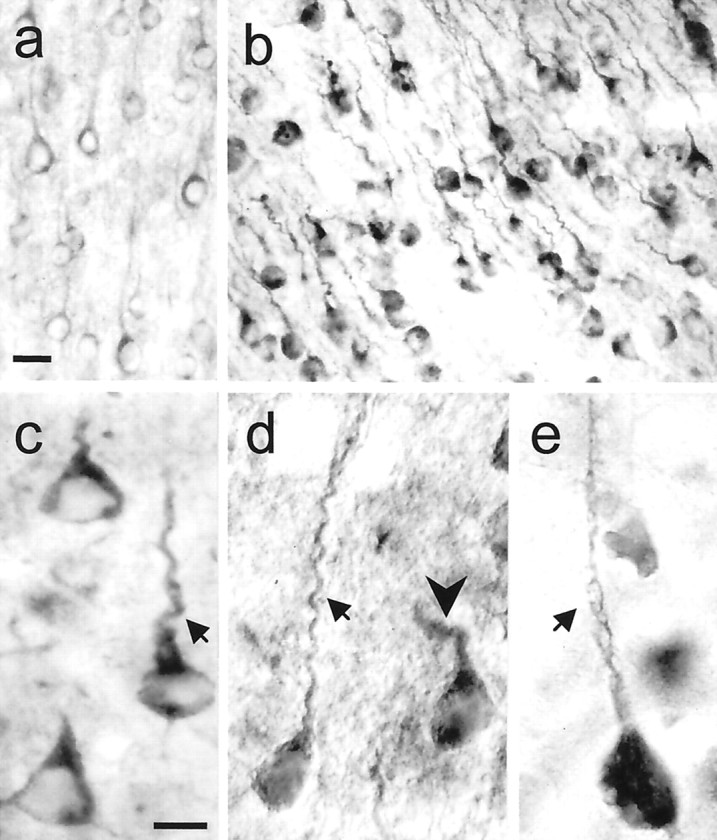
Increased huntingtin immunoreactivity and dysmorphic dendrites in HD mice. a, WT mouse (8.5 months, rotarod, normal behavior) exhibits low to moderate levels of huntingtin labeling in the cytoplasm and proximal dendrites of pyramidal neurons. b–e, HD mice have intense labeling for huntingtin in the cytoplasm and proximal dendrites (b, HD100, L63, 4.5 months, RR = 10, +clasp;c, HD46, L17, 12 months, RR = 66, +clasp;d, HD100, L63, 7 months, RR = 51; e, HD100, L46, 12 months, RR = 26). Some neurons also show diffuse nuclear staining (d). Dysmorphic dendrites show marked retraction (arrows in c, d) and disorientation (arrowhead in d). Membrane blebbing occurs in cell bodies and dendrites (arrow ine). Staining was performed with anti-huntingtin antibody Ab585. Scale bars: a, b, 25 μm;c–e, 10 μm.
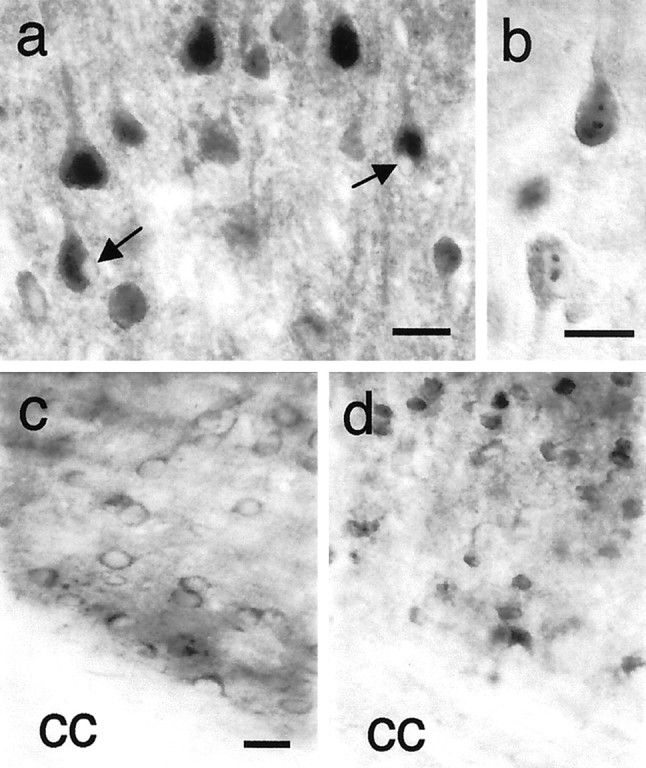
Huntingtin labeling in neuronal nuclei was widespread in layers 2/3, 5, and 6 of the cortex and throughout the striatum of HD46 and HD100 mice, but not of CT18 and WT mice (Figs.4a, 5a,b). The proportion of neurons with diffuse nuclear labeling was significantly greater (Student's t test, p < 0.0001) in the striatum (mean, 80% of neurons) than in the cortex (mean, 43% of neurons; see Fig. 6A, top). Intranuclear inclusions were detected in most HD46 and HD100 mice (Figs.4b, 5d–f) with anti-huntingtin antisera Ab1 and Ab585 as well as with anti-ubiquitin and anti-FLAG antisera in some of the older, more severely affected mice (Fig.5e,f). Ab1 robustly detects inclusions in cortical and striatal neurons of Huntington's disease brain and in other transgenic mouse models (Davies et al., 1997; Levine et al., 1999). Ab585 detects inclusions in the cortex of some Huntington's disease brains (Sapp et al., 1999) and in clonal striatal cells after overexpression of truncated or full-length mutant huntingtin (Kim et al., 1999). In parallel with Huntington's disease juvenile and adult-onset patients (Sapp et al., 1997; Gutekunst et al., 1999), neurons with inclusions were more frequent in the cortex and striatum of HD100 mice (mean, 23%) than in the cortex and striatum of HD46 mice (mean, 7%). Inclusions were significantly more frequent in the cortex (mean, 19% of neurons) than in the striatum of HD mice (mean, 6% of neurons; Student's t test, p< 0.01; Fig. 6A,bottom), a characteristic also noted in adult-onset Huntington's disease brain (Sapp et al., 1999). Neurons with inclusions also had prominent, diffuse staining for huntingtin in the nucleus (20–30% of neurons with inclusions) and cytoplasm (98% of neurons with inclusions).
Fig. 4.
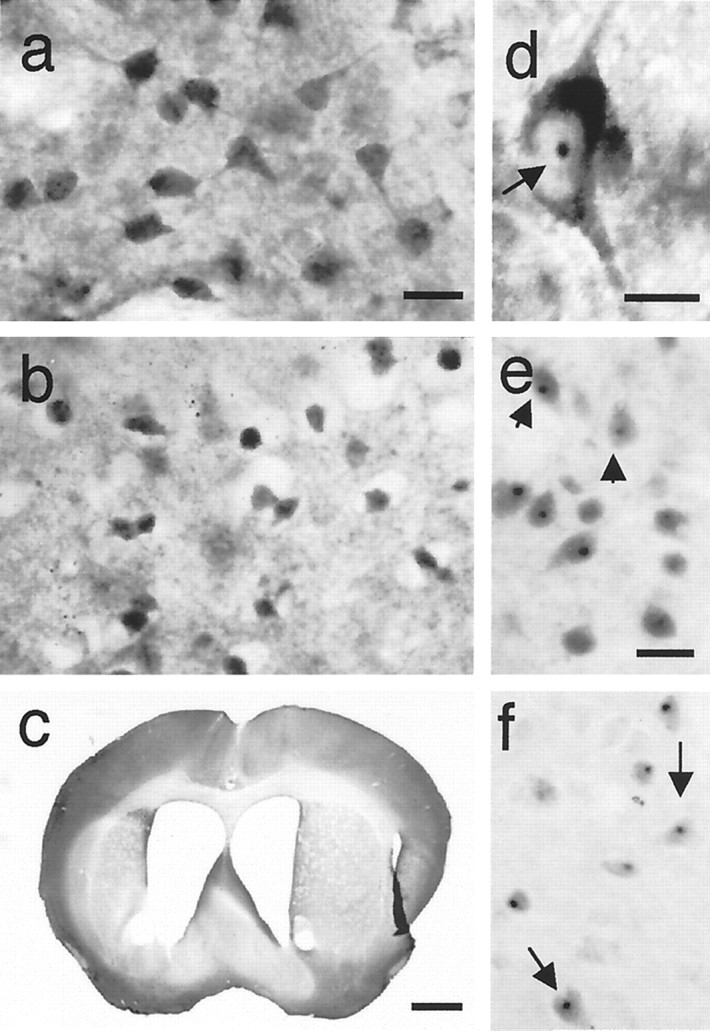
Cortical neurons with huntingtin immunoreactivity in HD mice. a, HD46 mouse (L14, 14 months, RR = 14, +clasp, hypoactive, broad-based gait) has diffuse nuclear huntingtin labeling in layer 5 pyramidal neurons. Some neurons have marked blebbing of the plasma membrane (arrows).b, Nuclear inclusions in pyramidal cells of HD100 mouse (L59, 7 months, RR = 15, +clasp). One of the neurons (top) also has diffuse nuclear labeling. c, d, Layer 6 from a transgenic control mouse with 18 glutamines in huntingtin (c, L3, 7 months, normal behavior) and an HD100 mouse (d, L59, 7 months, RR = 15, +clasp). Compared with the neurons in c, the neurons ind are reduced in size and show increased huntingtin immunoreactivity in nuclei. cc, Corpus callosum. Staining for huntingtin was performed with antibody Ab585. Scale bars:a–d, 25 μm.
Fig. 5.
Striatum of HD mice. a, Presymptomatic HD100 mouse (L46, 5 months, normal behavior) shows diffuse nuclear labeling in medium-sized striatal neurons, which was not seen in wild-type or HD18 mice. b, c, Severely affected HD46 mouse (L14, 14 months, RR = 14, +clasp, hypoactive, broad-based gait) shows marked shrinkage of striatal neurons inb (compare with a). Atrophy of the striatum shown in c is comparable with grade 2 brain in Huntington's disease. d, Nuclear inclusion (arrow) and marked perinuclear accumulation of huntingtin appear in large striatal neuron from HD100 mouse (L46, 5 months, RR = 96, +clasp). e, f, Nuclear inclusions (arrows) detected with anti-ubiquitin antibody ine and with anti-FLAG antibody in f in medium-sized striatal neurons of affected HD100 mouse (L63, 11 months, +clasp, hypoactive, broad-based gait). Immunostaining for huntingtin ina, b, and d was performed with Ab585. Scale bars: a, b, 25 μm; c, 1 mm; d, 10 μm; e, f, 25 μm.
Fig. 6.
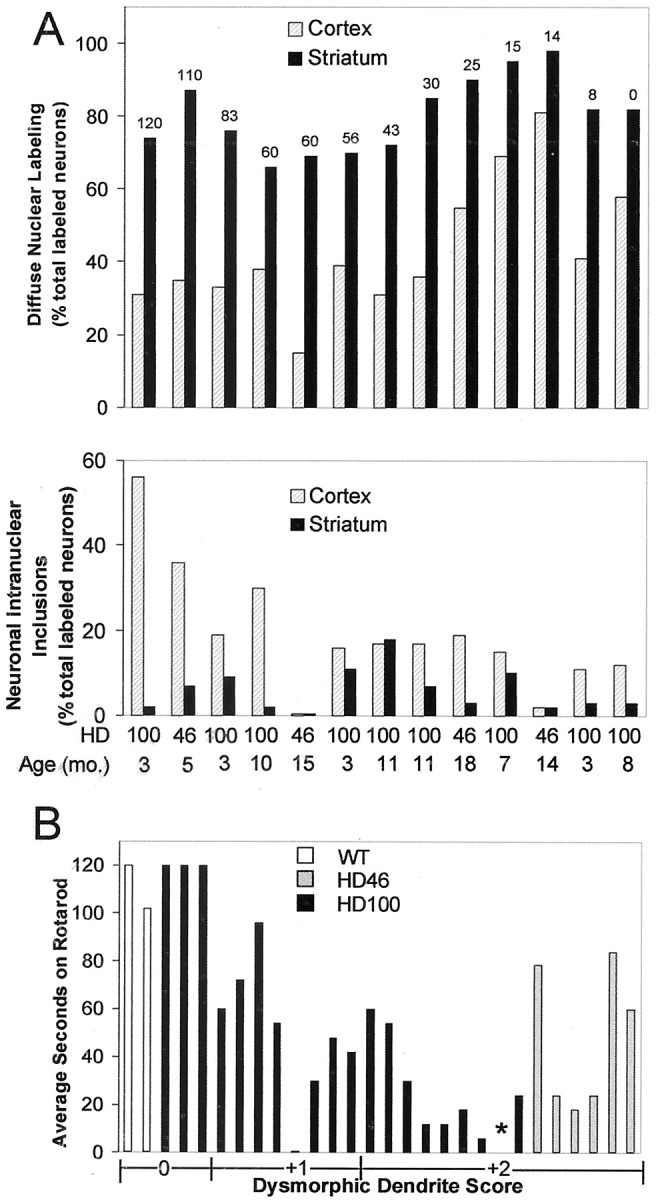
Quantitative assessment of dysmorphic dendrites, diffuse nuclear labeling, nuclear inclusions, and cell density in relation to phenotype. A, Diffuse nuclear labeling and neuronal intranuclear inclusions in cortex and striatum. Mice are identified by HD type (46 or 100) and age (months) on theabscissa. A, Top, Neurons with diffuse nuclear labeling for huntingtin in the cortex and striatum of HD46 and HD100. RR score is shown at the top of the bars, from highest to lowest. There are significantly more neurons with diffuse nuclear labeling in the striatum than in the cortex (p < 0.01). Impaired rotarod performance is correlated positively with the extent of diffuse nuclear labeling in the cortex (p < 0.03), but not in the striatum. A, Bottom, Intranuclear inclusions in the cortex and striatum in the same set of HD mice. Inclusions are significantly more frequent in the cortex than in the striatum (p < 0.01) and are correlated with better rotarod scores (p < 0.004).B, Extent of dysmorphic morphology in huntingtin-labeled cortical neurons of control and HD46 and HD100 mice (J-dendrites, wavy dendrites) versus rotarod performance. A rating scale (0, +1, +2) for dysmorphic dendrites was used (see Materials and Methods), with +2 assigned to brains with the most severely dysmorphic neurons. The asterisk indicates an animal with severe dendritic pathology (+2) that was unable to perform on the rotarod because it developed seizures when it was tested. There is a significant correlation between higher degrees of dysmorphic changes and lower RR scores (p < 0.0001).
Both medium-sized and large striatal neurons had inclusions. Large neurons, which account for only 1–2% of all striatal neurons and generally are spared in Huntington's disease, had a much higher frequency of inclusions than medium-sized cells. In an analysis of five HD100 mice (ages 3–11 months) with normal and abnormal behaviors, 27–70% of the large striatal neurons that labeled for huntingtin had intranuclear inclusions (mean, 47%). Electron microscopic analysis revealed that the nuclear inclusions formed in the cortex and striatum of HD mice were composed of granules and filaments (results not shown) and appeared to be similar to those seen in Huntington's disease brain (DiFiglia et al., 1997).
Huntingtin-immunoreactive neurons appeared smaller or reduced in number in the striatum (Fig. 5b) and in layer 6 cortex (Fig.4c,d) in the majority of the HD mice. Measurements of cross-sectional area showed that huntingtin-immunoreactive striatal neurons in the HD mice were significantly smaller than in wild-type and HD18 mice (control, 151 ± 14.9, SE; HD, 71.3 ± 4.10;p < 0.0003). One notable HD46 mouse with a 31% reduction in neuronal density showed marked atrophy of the striatum characteristic of a grade 2 HD brain (Fig. 5c). Nonetheless, stereological analysis in striatum revealed no consistent difference in HD100 compared with WT or CT18 (HD100, n = 7; CT18,n = 3; WT, n = 7; HD100 = 94% of WT and 91% of CT18 neurons per striatum; NS).
In HD mice in which changes in the cortex and striatum had been observed, we examined the presence of nuclear changes in huntingtin labeling in cerebellum, hippocampus, substantia nigra, and brainstem. None of these other regions is known to be affected in the early stages of Huntington's disease but can be involved at advanced stages of the disease (Vonsattel and DiFiglia, 1998). In 11 of 14 HD mice that were studied, nuclear inclusions appeared in a few cells in one or more of the regions. Diffuse nuclear labeling was not evident in neurons in any of these regions, except for one mouse, which had the most severe motor impairment. In this mouse (shown in Fig. 5b,c) diffuse nuclear labeling occurred in ∼25% of cerebellar Purkinje cells and hippocampal pyramidal neurons. Thus, except for the most severely affected mice, nuclear changes in huntingtin immunoreactivity were not prominent in other brain regions compared with the cortex and striatum.
We compared the occurrence of different neuropathological changes in the cortex and striatum with behavioral phenotype. The higher the dysmorphic dendrite score (Fig. 6B; see Materials and Methods), the worse the rotarod score (p < 0.0001) and the greater the number of neurological deficits (p < 0.0001). In cortex the prevalence of diffuse nuclear labeling (Fig. 6A, top) correlated with worse rotarod scores (Pearson correlation coefficient,r = 0.74; p < 0.03) and a higher number of neurological deficits (r = 0.79;p < 0.002). In contrast, diffuse nuclear labeling in striatal neurons did not predict neurological impairments (r = 0.44 for rotarod and r = 0.41 for number of deficits; both NS). The frequency of nuclear inclusions (Fig.6A, bottom) was not associated with worse rotarod scores in either brain region, but in cortex it was correlated with better rotarod performance (r = 0.74;p < 0.004). Shrinkage and loss of neurons in cortical layer 6 also did not appear to correlate with rotarod performance, although these were not quantified.
Thus we found that the mutant huntingtin transgene led to multiple neuropathological changes in neurons in the striatum and cortex. In addition to the striatum, the cortex was a site of early and progressive neuropathology in the HD mice. Two findings, the extent of dendritic abnormalities revealed by extensive cytoplasmic labeling and diffuse nuclear localization of huntingtin in cortical neurons, were the most predictive of the degree of neurological impairment. In contrast, the formation of huntingtin-positive nuclear inclusions had no predictive value.
Impaired responsiveness to corticostriatal stimulation correlates with alterations in dendrite morphology
Striatal neurons from WT (n = 13) and HD100 mice (n = 12) showed similar intracellular responses to current injections (Fig. 7A), with no significant differences in average resting membrane potential (RMP) or action potential amplitudes. Mean input resistance in the HD neurons was slightly lower than in WT neurons (28.3 ± 4.5 vs 40.9 ± 4.5 MΩ in HD100 and WT, respectively). Stimulation of subcortical white matter corpus callosum, which was in the slice preparation, evoked slightly smaller synaptic responses (EPSPs) in striatal neurons of HD mice compared with neurons of WT mice [mean amplitude and half-amplitude duration: for HD mice, 7.3 ± 1.3 mV and 7.9 ± 0.4 msec; for WT mice, 7.8 ± 1.6 mV and 8.8 ± 0.9 msec (Fig. 7B)]. Of more importance, there was a statistically significant rightward shift in the input–output curve, indicating that more current was required to produce responses in neurons from HD100 mice (p < 0.05; Fig.7C).
Fig. 7.

Electrophysiological characteristics of striatal neurons in HD transgenic mice. A, Responses to intracellular square wave hyperpolarizing and depolarizing current pulses in WT and HD100 striatal neurons. Amplitudes and durations of pulses are shown in the bottom traces (for clarity, the voltage responses induced by the highest intensity pulses are not shown for WT). B, EPSPs evoked by increasing intensities of stimulation of WT and HD100 striatal neurons. C, Input–output relationships for synaptic responses evoked in WT and HD100 striatal neurons. Each point represents the mean intensity (± SE) to evoke synaptic responses that were 20, 50, and 80% of the maximum amplitude. D, Responses to NMDA. Peak currents (left), current densities (middle), and the percentage of changes in intracellular Ca2+ (right) in WT (n = 6 neurons, 3 WT mice) and HD100 mice (n = 14 neurons, 4 HD mice) after stimulation of striatal neurons with 50 μm NMDA. Values are means and ± SE. Asterisk denotes p< 0.05 for peak current and current density and p< 0.025 for Ca2+, using Welch's approximation to the t test (Welch, 1947). E, Current density–voltage relationships in response to a ramp voltage command before and after the bath application of 50 μm NMDA in HD100 (n = 5) and WT (n = 5) striatal neurons. Current density–voltage relationships were calculated as the response to the agonist minus a baseline response in the absence of the agonist. NMDA current densities were significantly larger in transgenic than in control animals from −50 to +10 mV (p < 0.05). F, Time course of changes in mean NMDA-induced current densities (± SE). HD100 group was divided into least- and most-affected neurons (see Results for details and justifications). Asterisks inF and G indicate that the most-affected HD100 group was significantly different from its respective WT and least-affected HD100 group (p < 0.05). Thehorizontal line indicates the application of NMDA inF and G. G, Time course of mean percentage of changes (± SE) in Ca2+concentration in most- and least-affected HD100 and WT neurons.
Striatal neurons were labeled by intracellular injection of biocytin (Fig. 8A,B). The labeled cells were medium sized and displayed relatively similar spine densities in HD and WT mice. However, neurons from HD100 mice had significantly more dendrites with endings that curved back toward the soma (J-dendrites) and/or had sharp bends (wavy dendrites) compared with WT mice (Fig. 8B,C). Mean J-dendrites and wavy scores in HD mice were 1.39 ± 0.27 and 3.32 ± 0.23, respectively, and in WT were 0.62 ± 0.13 (p < 0.05) and 2.23 ± 0.17 (p < 0.001), respectively. In the HD mice, scores of J-dendrites and wavy dendrites were correlated significantly with each other (HD: r = 0.589, p < 0.05, n = 12; WT: r = −0.03,n = 13). These scores also were correlated with the amount of current that was necessary to induce 20% of the maximum synaptic responses (J-dendrite score vs current: r = 0.87, p < 0.05, n = 5; wavy dendrite score vs current: r = 0.93, p < 0.05,n = 5). These results indicated that altered morphology and abnormal synaptic physiology covaried in the HD neurons. The number of J-dendrites, but not wavy dendrites, also correlated with the current that was necessary to produce synaptic responses in WT mice, suggesting that the former property might covary with synaptic input in general.
Fig. 8.
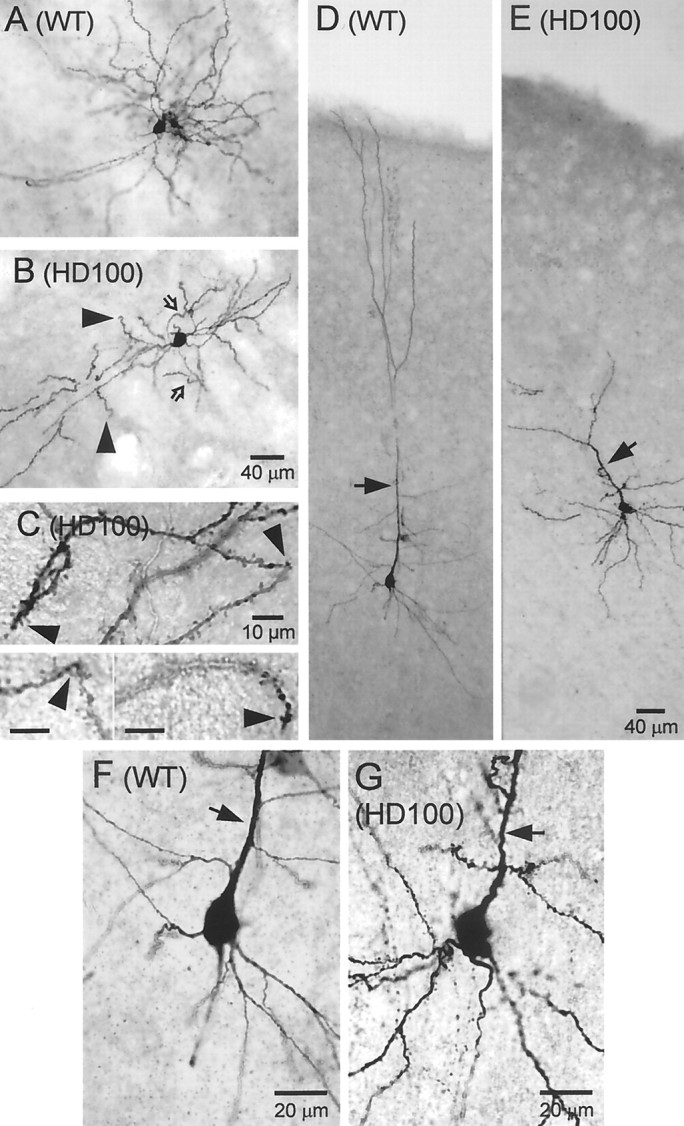
Examples of biocytin-filled medium-sized spiny striatal neurons (A–C) and cortical neurons (D–G) in WT (A, D, F) and HD100 mice (B, C, E, G). B, HD neuron has J-dendrites with curved endings (filled arrowheads) and wavy dendrites with sharp bends (open arrows). Scale bar in B also applies toA. C, High magnifications of wavy dendrites with sharp bends (arrowheads attop and bottom left) and J-, or recurved, ending (arrowhead in bottom right).D, Cortical WT neuron has smooth dendrites and extension of the apical dendrite to the pial surface (arrow).E, A cortical pyramidal neuron from an HD mouse with a disoriented apical dendrite (arrow). F, Higher magnification of a cortical pyramidal neuron in the WT mouse shown in D. Note the smooth apical dendrite (arrow). G, Higher magnification of HD neuron shown in E (rotated to fit better in the rectangular frame). Note the small sharp bends (arrowpoints to apical dendrite). Scale bar in E also applies to D.
Cortical neurons in HD and WT mice were filled with biocytin to examine dendrite morphology. Labeled WT neurons (n = 3) had the typical appearance of pyramidal cells, with an extensive basal plexus and a smooth apical dendrite that extended toward the pia (Fig. 8D,F). In contrast, cortical neurons in HD100 mice displayed dendritic abnormalities (four of eight recovered cells; Fig.8E,G), including beading, small sharp bends (n = 4; Fig. 8G), and misaligned and markedly bifurcated apical dendrites (Fig. 8E,arrow). These results were consistent with the dysmorphic changes seen in the cortex of HD mice with huntingtin labeling.
Response to NMDA receptor activation is altered in striatal neurons of HD100 mice
Excitotoxicity may contribute to neuronal death in HD and other neurodegenerative disorders and may involve alterations in NMDA-type glutamate receptors and a rise in intracellular Ca2+ (Coyle and Schwarcz, 1976; McGeer and McGeer, 1976; Choi, 1988; DiFiglia, 1990; Beal et al., 1991; Albin and Greenamyre, 1992; Brown et al., 1997). We examined electrophysiological properties of NMDA receptors in neurons from striatal slices of WT and HD100 mice. Peak membrane currents, regardless of time, induced by the activation of NMDA receptors were evaluated with whole-cell voltage-clamp recording (see Materials and Methods). Peak membrane currents induced by NMDA (50 μm, 3 min duration) were significantly larger in HD100 mice (n = 14 neurons) compared with wild-type controls (n = 6 neurons;p < 0.05; Fig. 7D). To normalize for cell size, we determined NMDA current density (peak current divided by cell capacitance; Alzheimer et al., 1993). HD mice displayed significantly increased NMDA peak current density compared with WT (p < 0.05; Fig. 7D).
In a subgroup of neurons from HD100 (n = 5) and wild-type controls (n = 5) we evaluated possible changes in voltage dependence. NMDA currents were examined with a ramp protocol [voltage command from −70 to +30 mV (5 sec) and then back to −90 mV (1 sec); all data were collected from the downward ramp] before and after bath application of NMDA. Current density–voltage relationships were calculated as the response to the agonist minus a baseline response in the absence of the agonist. We found that NMDA current densities were significantly larger in transgenic than in control animals from −50 to +10 mV (p < 0.05; Fig. 7E). Both groups displayed peak current densities between −30 and −20 mV; no obvious changes in voltage dependence were apparent.
Finally, we evaluated intracellular Ca2+flux induced by exposure to NMDA, using fura-2 as a Ca2+ indicator. Basal Ca2+ levels were not statistically different between HD100 and WT. However, with treatment with NMDA, Ca2+ influx was significantly greater in HD100 mice than in WT mice (p < 0.025; Fig.7D). In HD100 mice two populations of cells emerged: one population with peak NMDA currents and densities very similar to those obtained from WT animals and a second population of neurons with much higher peak currents and current densities. Seven of 14 neurons in the HD100 mice accounted for the marked increase in NMDA peak currents and current density by displaying changes that were three- to sixfold greater than the other neurons, which had values similar to WT. Because there appeared to be two populations of neurons in HD100 mice, we divided these neurons into two groups (most-affected and least-affected neurons) to analyze the time course of the effects of the NMDA application. Current density was increased significantly only in the most-affected neurons from 3 to 7 min after NMDA application (p < 0.05; Fig. 7F). Although there was considerable cell-to-cell variation, the most-affected neurons displayed significantly larger increases in intracellular Ca2+ from 4 to 5 min after NMDA application (p < 0.05; Fig. 7G). Thus the presence of electrophysiological abnormalities in response to NMDA was marked but variable in the HD100 mice, thereby defining a subpopulation of neurons more affected by the transgene. Moreover, neurons with altered response to NMDA occurred in an HD100 mouse with no deficits and in two HD100 mice with motor impairments (one with hyperactivity and one with hyperactivity and clasp). This finding suggests that altered function of NMDA receptors in striatal neurons may precede the onset of motor deficits. Unfortunately, the morphology of striatal neurons with altered NMDA receptor function could not be evaluated with biocytin because of the presence of the Ca2+ indicator fura-2. Because NMDA was applied in the bath and the changes were examined over an 8 min period during and after application of the agonist, it is conceivable that the observed effects were attributable to a combination of NMDA receptor activation as well as changes in receptor desensitization, inactivation, or rundown.
DISCUSSION
We sought to identify critical neuropathological and functional neuronal changes that explain the onset and progression of the Huntington's disease phenotype. We used heterozygote transgenic mice that express a large N-terminal fragment of the human huntingtin gene with normal or expanded CAG repeats. Transfection of this size of mutant human huntingtin in clonal striatal cells recapitulates in vitro many of the subcellular neuronal changes in Huntington's disease brain (Kim et al., 1999; Sapp et al., 1999; Kegel et al., 2000). In transgenic HD mice we found that nuclear inclusion formation alone is insufficient to cause the aberrant phenotype; instead, abnormal dendritic morphology and diffuse nuclear labeling in cortex are aligned with behavioral changes. Furthermore, the size of huntingtin expressed in our transgenic HD model (1000 amino acids) with expanded polyglutamines suffices to cause the neuropathological changes found in Huntington's disease. We propose that cortical involvement in our HD transgenic mice, as corroborated by neuropathological and electrophysiological findings, contributes to the development of phenotype in the HD mice. We speculate that cortical changes in the human are fundamental to the onset and progression of phenotype in Huntington's disease.
Abnormal neuronal morphology and diffuse nuclear huntingtin in the cortex predict the presence of clinical disease in our transgenic HD mice. In contrast, nuclear accumulation of huntingtin in the striatum is comparable in HD mice regardless of the severity of motor deficits. This characteristic of striatal neuropathology can occur early and might contribute to the clinical course, but it is insufficient to predict the onset of behavioral deficits. Striatal neurons from HD mice displayed abnormal electrophysiological responses to cortical stimulation and to NMDA receptor activation. These abnormal responses were separate from the extent of neurological impairment. Thus, even before the onset of outward phenotype, mutant huntingtin could affect cortical inputs to the striatum and thereby alter function in corticostriatal pathways.
Although Huntington's disease often has been considered primarily a process of striatal neurodegeneration, there have been indications that the cortex contributes to the disease diathesis and that mutant huntingtin affects corticostriatal circuitry early in the disease. Marked nuclear and cytoplasmic accumulation of mutant huntingtin in cortical pyramidal neurons coincides with dendritic abnormalities in postmortem brain of patients with low-grade striatal pathology (DiFiglia et al., 1997; Sapp et al., 1997). Furthermore, abundant (mutant) huntingtin is evident in numerous cortical dystrophic axons that project to the striatum (Sapp et al., 1999). In Golgi impregnations the cortical neurons as well as the striatal neurons show abundant dendritic changes in Huntington's disease postmortem brain (Graveland et al., 1985; Sotrel et al., 1993). Clinical findings also implicate cortical involvement. Metabolic dysfunction in cortex can occur early in the course of the disease (Sax et al., 1996), and cognitive disturbances can appear before motor deficits (Lawrence et al., 1996). In a “knock-in” model of Huntington's disease in which an expanded N-terminal region of mutant huntingtin was inserted into murine huntingtin, behavioral changes were not observed despite the presence of nuclear inclusions in the striatum (Wheeler et al., 2000). The mice had no neuronal changes in the cortex. In contrast, Lin et al. (2001) generated a knock-in mouse with 150 CAG repeats that exhibited predominantly striatal huntingtin nuclear inclusions with a modicum of cortical involvement. These animals developed late-onset behavioral changes. In all, these findings support the centrality of the cortex in the genesis of the Huntington's disease phenotype.
Use of the neuron-specific enolase promoter directed transgene expression to neurons. Endogenous huntingtin was detected in neurons and eluded detection by immunohistochemistry in glia. Similarly, huntingtin mRNA was found in high abundance by in situhybridization (Landwehrmeyer et al., 1995) in neurons but in very low amounts in glia. A primary dysfunction of glia in Huntington's disease has been proposed on the basis of neuropathologic grade-dependent changes in the astrocyte-specific GLT1 glutamate transporter (Arzberger et al., 1997). Reactive astrocytosis is a feature of striatal pathology in Huntington's disease and a criterion for the grading system of striatal pathology (Vonsattel et al., 1985). How the expression of mutant huntingtin in glia might contribute to astroglial changes in Huntington's disease brain is unclear.
Our results in transgenic HD mice support in vitro data (Saudou et al., 1998; Kim et al., 1999) that nuclear inclusions do not play an early or decisive role in cell death. In a conditional mouse model of HD involving highly expanded CAG repeats in exon 1 of huntingtin, Yamamoto et al. (2000) showed that the formation of nuclear inclusions in the striatum was reversible with the transcriptional repression of the transgene. Therefore, the initial accumulation of mutant huntingtin in inclusions did not trigger inexorable cell death. Our findings indicate that cellular dysfunction in Huntington's disease might require an accumulation of mutant huntingtin over a long duration, thus also extending therapeutic opportunities.
Electrophysiological data obtained in slice preparations from HD100 mice demonstrated that striatal neurons had an altered response to cortical stimulation and NMDA receptor activation but a normal average resting membrane potential and action potential amplitudes. These results indicate a fundamental defect in NMDA receptor function. We found that striatal neurons in R6/2 mice with huntingtin exon 1 transgene (Mangiarini et al., 1996) also displayed altered responses to NMDA receptor activation (Cepeda et al., 2000) and to cortical stimulation (Levine et al., 1999; Klapstein et al., 2000). However, the presence of depolarized resting membrane potentials in these cells makes it difficult to interpret the significance of changes in NMDA receptor responsiveness.
The marked changes in dendritic architecture (J- and wavy dendrites) observed in cortical and striatal neurons of the HD100 mice could contribute to the reduced synaptic responsiveness of striatal neurons to cortical stimuli. In cortical neurons the alterations in dendritic geometry and the distribution of ion channels significantly influence neuronal firing patterns, especially those dependent on glutamatergic neurotransmission (Henze et al., 1996; Mainen and Sejnowski, 1996).
Excitotoxicity as a mechanism for the pathogenesis of Huntington's disease has been posited previously (Coyle and Schwarcz, 1976;DiFiglia, 1990; Albin and Greenamyre, 1992). In vivotreatment of rat striatum with quinolinic acid, an NMDA receptor agonist, created a pattern of cell loss reminiscent of Huntington's disease (Beal et al., 1991). We found that NMDA receptor activation significantly elevated peak current densities and levels of intracellular Ca2+ in striatal neurons of HD100 mice compared with wild-type mice. The latter effect could lower the threshold for excitotoxic injury. In addition, cell swelling, an early event in the excitotoxic cascade (Choi, 1988), is seen in some neurons from HD100 mice after the application of NMDA in vitro (M. Levine, unpublished observations). Similar findings have been observed in striatal cells from transgenic mice with huntingtin exon 1 (R6/2) and a knock-in HD mouse with no behavioral phenotype (Levine et al., 1999).
In other experimental systems the expression of mutant huntingtin has been shown to alter electrophysiological properties mediated by NMDA receptor activation and to render cells more susceptible to excitotoxicity-related cellular changes. Coexpression of NMDA receptor subtypes NR1 and NR2B with mutant huntingtin into human embryonic kidney cells produced larger currents after NMDA receptor activation than did coexpression of these receptors with wild-type huntingtin (Chen et al., 1999) and increased excitotoxic cell death (Zeron et al., 2001). Current studies indicate that NMDA receptor activation is excitotoxic in our HD100 and HD46 mice (A. Petersen, K. Chase, Z. Puschban, M. DiFiglia, P. Brundin, and N. Aronin, unpublished data). Unexpectedly and inexplicably, striatal neurons in the R6/2 mice are resistant to the neurotoxic effects of quinolinic acid (Hansson et al., 1999).
Caveats understandably attend the use of transgenic models. Different promoters, transgene size, CAG repeat length, and genetic background might influence characteristics of particular models. Our murine model used a large portion of mutant N-terminal huntingtin; exon 1 and full-length huntingtin have provided inadequate neuropathology to pursue our goals. Most huntingtin transgenics use promoters that are foreign to mice [portions of human (Mangiarini et al., 1996); CMV-based (Reddy et al., 1998); human YAC (Hodgson et al., 1999); prion-based (Schilling et al., 1999)]. We used a neuron-specific promoter that by mRNA estimations regulated mutant huntingtin gene expression differently from endogenous huntingtin gene expression but provided morphologic changes in neurons that are characteristic of Huntington's disease. Finally, several mouse strains have been used in generating HD models. Ours has a mixed background of two strains. With nearly 500 mice tested in multiple lineages, we suggest that the mutant huntingtin, rather than clustered strain differences, accounts for our observed motor impairments. Furthermore, preliminary studies in our laboratory indicate that transgenic mice with full-length huntingtin HD100 in C57BL/6 develop behavioral abnormalities at the same age as HD100 transgenic mice with N-terminal one-third of the protein in C57BL/6×SJL.
Our findings point to a multi-tiered process of dysfunction in cortical and striatal neurons; this process produces the HD mouse phenotype. Accumulation of mutant huntingtin in nuclear and cytoplasmic compartments occurs contemporaneously with the onset of behavioral abnormalities as detected in our transgenic HD mice. Dendritic pathology in the cortex, electrophysiological abnormalities in the striatum, and disruption of corticostriatal circuitry were detected in mice at early and later times. Accumulated mutant huntingtin might maintain the neuron in a state of chronic vulnerability. Cortical and striatal neurons respond to the persistent presence of mutant huntingtin in a highly reproducible pattern by forming J- and wavy dendrites. How mutant huntingtin causes J- and wavy dendrites is unknown, but effects of the mutant protein on the cytoskeleton and vesicle trafficking could be implicated in altering dendritic architecture (Aronin et al., 1999). Striatal neurons in our HD mice concurrently become especially sensitive to NMDA receptor activation and Ca2+ flux into the neuron increases. Collectively, these quantifiable characteristics of the HD mouse phenotype should be valuable in identifying therapeutic approaches that slow or reverse neuronal dysfunction.
Footnotes
This work was supported by National Institutes of Health (NIH) Grant NS 38194 (N.A.) and Grants NS 16367 and NS 35711 (M.D.), by Department of Defense Grant USAMRMC 98292059 (N.A.), by a University of Massachusetts Medical School (UMMS) institutional award (N.A.), by the Huntington's Disease Society of America (M.D., G.J.K.), and by the Hereditary Disease Foundation (N.A., M.D., D.A.T., M.A.A., M.S.L). G.A.L. is a fellow of the Howard Hughes Medical Institute. We thank Dr. Steven Jones, Dr. Janet Stein, and the staff in the UMMS transgenic core for their able advice and assistance. We thank Steven Baker in the UMMS statistics core and Robert Lew for their advice on statistical analysis and Yun Kim for help with cell counts. We also thank the NIH Diabetes and Endocrine Research Center at UMMS (Grant DK32520) for its support of the Peptide Core and the Transgenic Core.
Correspondence should be addressed to Dr. Neil Aronin, Department of Medicine, University of Massachusetts Medical School, 55 Lake Avenue North, Worcester, MA 01655. E-mail: Neil.Aronin@umassmed.edu.
REFERENCES
- 1.Albin RL, Greenamyre JT. Alternative excitotoxic hypotheses. Neurology. 1992;42:733–738. doi: 10.1212/wnl.42.4.733. [DOI] [PubMed] [Google Scholar]
- 2.Alzheimer C, Schwindt PC, Crill WE. Postnatal development of a persistent Na+ current in pyramidal neurons from rat sensorimotor cortex. J Neurophysiol. 1993;69:290–292. doi: 10.1152/jn.1993.69.1.290. [DOI] [PubMed] [Google Scholar]
- 3.Aronin N, Chase K, Young C, Sapp E, Schwarcz C, Matta N, Kornreich R, Sheth A, Landwehrmeyer B, Bird E, Vonsattel J-P, Smith T, Carraway R, Boyce FM, Beal MF, Young AB, Penney JB, DiFiglia M. CAG expansion affects the expression of mutant huntingtin in the Huntington's disease brain. Neuron. 1995;15:1193–1201. doi: 10.1016/0896-6273(95)90106-x. [DOI] [PubMed] [Google Scholar]
- 4.Aronin N, Kim M, Laforet G, DiFiglia M. Are there multiple pathways in the pathogenesis of Huntington's disease? Philos Trans R Soc Lond B Biol Sci. 1999;354:995–1003. doi: 10.1098/rstb.1999.0451. [DOI] [PMC free article] [PubMed] [Google Scholar]
- 5.Arzberger T, Krampfl K, Leimgruber S, Weindl A. Changes of NMDA receptor subunit (NR1, NR2B) and glutamate transporter (GLT1) mRNA expression in Huntington's disease: an in situ hybridization study. J Neuropathol Exp Neurol. 1997;56:440–454. doi: 10.1097/00005072-199704000-00013. [DOI] [PubMed] [Google Scholar]
- 6.Beal MF, Ferrante RJ, Swartz KJ, Kowall NW. Chronic quinolinic acid lesions in rats closely resemble Huntington's disease. J Neurosci. 1991;11:1649–1659. doi: 10.1523/JNEUROSCI.11-06-01649.1991. [DOI] [PMC free article] [PubMed] [Google Scholar]
- 7.Browne SE, Bowling AC, MacGarvey U, Baik MJ, Berger SC, Muqit MMK, Bird ED, Beal MF. Oxidative damage and metabolic dysfunction in Huntington's disease: selective vulnerability of the basal ganglia. Ann Neurol. 1997;41:646–653. doi: 10.1002/ana.410410514. [DOI] [PubMed] [Google Scholar]
- 8.Cepeda C, Colwell CS, Itri JN, Chandler SH, Levine MS. Dopaminergic modulation of NMDA-induced whole cell currents in neostriatal neurons in slices: contribution of calcium conductances. J Neurophysiol. 1998;79:82–94. doi: 10.1152/jn.1998.79.1.82. [DOI] [PubMed] [Google Scholar]
- 9.Cepeda C, Ariano MA, Calvert CR, Koppel AH, Flores-Hernandez J, Aronin N, DiFiglia M, Levine MS. NMDA receptor hypersensitivity in two models of Huntington's disease. Soc Neurosci Abstr. 2000;26:1030. [Google Scholar]
- 10.Chen N, Luo T, Wellington C, Metzler M, McCutcheon K, Hayden MR, Raymond LA. Subtype-specific enhancement of NMDA receptor currents by mutant huntingtin. J Neurochem. 1999;72:1890–1898. doi: 10.1046/j.1471-4159.1999.0721890.x. [DOI] [PubMed] [Google Scholar]
- 11.Choi DW. Glutamate neurotoxicity and diseases of the nervous system. Neuron. 1988;1:623–634. doi: 10.1016/0896-6273(88)90162-6. [DOI] [PubMed] [Google Scholar]
- 12.Clark HB, Burright EN, Yunis WS, Larson S, Wilcox C, Hartman B, Matilla A, Zoghbi HY, Orr HT. Purkinje cell expression of a mutant allele of SCA1 in transgenic mice leads to disparate effects on motor behaviors, followed by a progressive cerebellar dysfunction and histological alterations. J Neurosci. 1997;17:7385–7395. doi: 10.1523/JNEUROSCI.17-19-07385.1997. [DOI] [PMC free article] [PubMed] [Google Scholar]
- 13.Collett D. Modeling survival data in medical research. Chapman and Hall; London: 1994. [Google Scholar]
- 14.Coyle JT, Schwarcz R. Lesion of striatal neurones with kainic acid provides a model for Huntington's chorea. Nature. 1976;26:244–246. doi: 10.1038/263244a0. [DOI] [PubMed] [Google Scholar]
- 15.Davies SW, Turmaine M, Cozens BA, DiFiglia M, Sharp AH, Ross CA, Scherzinger E, Wanker EE, Mangiari L, Bates GP. Formation of neuronal intranuclear inclusions underlies the neurological dysfunction in mice transgenic for the HD mutation. Cell. 1997;90:537–548. doi: 10.1016/s0092-8674(00)80513-9. [DOI] [PubMed] [Google Scholar]
- 16.DiFiglia M. Excitotoxic injury of the neostriatum: a model for Huntington's disease. Trends Neurosci. 1990;13:286–289. doi: 10.1016/0166-2236(90)90111-m. [DOI] [PubMed] [Google Scholar]
- 17.DiFiglia M, Sapp E, Chase K, Schwarz C, Meloni A, Young C, Marin E, Vonsattel J-P, Carraway R, Reeves SA, Boyce FM, Aronin N. Huntingtin is a cytoplasmic protein associated with vesicles in human and rat brain neurons. Neuron. 1995;14:1075–1081. doi: 10.1016/0896-6273(95)90346-1. [DOI] [PubMed] [Google Scholar]
- 18.DiFiglia M, Sapp E, Chase KO, Davies SW, Bates GP, Vonsattel J-P, Aronin N. Aggregation of huntingtin in neuronal intranuclear inclusions and dystrophic neurites in brain. Science. 1997;277:1990–1993. doi: 10.1126/science.277.5334.1990. [DOI] [PubMed] [Google Scholar]
- 19.Draper NR, Smith HS. Applied regression analysis, 3rd Ed. Wiley; New York: 1998. [Google Scholar]
- 20.Graveland GA, Williams RS, DiFiglia M. Evidence for degenerative and regenerative changes in neostriatal spiny neurons in Huntington's disease. Science. 1985;227:770–773. doi: 10.1126/science.3155875. [DOI] [PubMed] [Google Scholar]
- 21.Gutekunst CA, Li SH, Yi H, Mulroy JS, Kuemmerle S, Jones R, Rye D, Ferrante RJ, Hersch SM, Li X-J. Nuclear and neuropil aggregates in Huntington's disease: relationship to neuropathology. J Neurosci. 1999;19:2522–2534. doi: 10.1523/JNEUROSCI.19-07-02522.1999. [DOI] [PMC free article] [PubMed] [Google Scholar]
- 22.Hansson O, Petersen A, Leist M, Nicotera P, Castilho RF, Brundin P. Transgenic mice expressing a Huntington's disease mutation are resistant to quinolinic acid-induced striatal excitotoxicity. Proc Natl Acad Sci USA. 1999;96:8727–8732. doi: 10.1073/pnas.96.15.8727. [DOI] [PMC free article] [PubMed] [Google Scholar]
- 23.Henze DA, Cameron WE, Barrionuevo G. Dendritic morphology and its effects on the amplitude and rise-time of synaptic signals in hippocampal CA3 pyramidal cells. J Comp Neurol. 1996;369:331–344. doi: 10.1002/(SICI)1096-9861(19960603)369:3<331::AID-CNE1>3.0.CO;2-6. [DOI] [PubMed] [Google Scholar]
- 24.Hodgson JG, Agopyan N, Gutekunst C-A, Leavitt BR, LePiane F, Singaraja R, Smith DJ, Bissada N, McCutcheon K, Nasir J, Jamot L, Li X-J, Stevens ME, Rosemond E, Roder JC, Phillips AG, Rubin EM, Hersch SM, Hayden MR. A YAC mouse model for Huntington's disease with full-length mutant huntingtin, cytoplasmic toxicity, and selective striatal neurodegeneration. Neuron. 1999;23:181–192. doi: 10.1016/s0896-6273(00)80764-3. [DOI] [PubMed] [Google Scholar]
- 25.Huntington G. On chorea. Med Surg Rep. 1872;26:317–321. [Google Scholar]
- 26.Huntington's Disease Collaborative Research Group. A novel gene containing a trinucleotide repeat that is expanded and unstable on Huntington's disease chromosomes. Cell. 1993;72:971–983. doi: 10.1016/0092-8674(93)90585-e. [DOI] [PubMed] [Google Scholar]
- 27.Hyman BT, Gomez-Isla T, Irizarry MC. Stereology: a practical primer for neuropathology. J Neuropathol Exp Neurol. 1998;57:305–310. doi: 10.1097/00005072-199804000-00001. [DOI] [PubMed] [Google Scholar]
- 28.Kegel KB, Kim M, Sapp E, McIntyre C, Castano JG, Aronin N, DiFiglia M. Huntingtin expression stimulates endosomal-lysosomal activity, endosome tubulation, and autophagy. J Neurosci. 2000;20:7268–7278. doi: 10.1523/JNEUROSCI.20-19-07268.2000. [DOI] [PMC free article] [PubMed] [Google Scholar]
- 29.Kim M, Lee HS, Laforet G, McIntyre C, Martin EJ, Chang P, Kim TW, Williams M, Reddy PH, Tagle D, Boyce FM, Won L, Heller A, Aronin N, DiFiglia M. Mutant huntingtin expression in clonal striatal cells: dissociation of inclusion formation and neuronal survival by caspase inhibition. J Neurosci. 1999;19:964–973. doi: 10.1523/JNEUROSCI.19-03-00964.1999. [DOI] [PMC free article] [PubMed] [Google Scholar]
- 30.Kita H, Armstrong W. A biotin-containing compound N-(-2-aminoethyl)biotinamide for intracellular labeling and neuronal tracing studies: comparison with biocytin. J Neurosci Methods. 1991;37:141–150. doi: 10.1016/0165-0270(91)90124-i. [DOI] [PubMed] [Google Scholar]
- 31.Klapstein GJ, Chesselet M-F, Zanjani H, Fisher RS, Levine MS. Electrophysiological and morphological changes in striatal neurons in asymptomatic and symptomatic R6/2 Huntington's disease transgenic mice. Soc Neurosci Abstr. 2000;26:1030. doi: 10.1152/jn.2001.86.6.2667. [DOI] [PubMed] [Google Scholar]
- 32.Landwehrmeyer GB, McNeil SM, Dure LS, 4th, Ge P, Aizawa GP, Huang Q, Ambrose CM, Duyao MP, Bird ED, Bonilla E, de Young M, Avila-Gonzales AJ, Wexler NS, DiFiglia M, Gusella JF, MacDonald ME, Penney JB, Young AB, Vonsattel J-P. Huntington's disease gene: regional and cellular expression in brain of normal and affected individuals. Ann Neurol. 1995;37:218–230. doi: 10.1002/ana.410370213. [DOI] [PubMed] [Google Scholar]
- 33.Lawrence AD, Sahakian BJ, Hodges JR, Rosser AE, Lange KW, Robbins TW. Executive and mnemonic functions in early Huntington's disease. Brain. 1996;119:1633–1645. doi: 10.1093/brain/119.5.1633. [DOI] [PubMed] [Google Scholar]
- 34.Levine MS, Klapstein GJ, Koppel A, Gruen E, Cepeda C, Vargas ME, Jokel ES, Carpenter EM, Zanjani H, Hurst RS, Efstratiadis A, Zeitlin S, Chesselet MF. Enhanced sensitivity to N-methyl-d-aspartate receptor activation in transgenic and knock-in mouse models of Huntington's disease. J Neurosci Res. 1999;58:515–532. [PubMed] [Google Scholar]
- 35.Lin CH, Tallaksen-Greene S, Chien WM, Cearley JA, Jackson WS, Crouse AB, Ren S, Li XJ, Albin RL, Detloff PJ. Neurological abnormalities in a knock-in mouse model of Huntington's disease. Hum Mol Genet. 2001;10:137–144. doi: 10.1093/hmg/10.2.137. [DOI] [PubMed] [Google Scholar]
- 36.Mainen ZF, Sejnowski TJ. Influence of dendritic structure on firing pattern in model neocortical neurons. Nature. 1996;382:363–366. doi: 10.1038/382363a0. [DOI] [PubMed] [Google Scholar]
- 37.Mangiarini L, Sathasivam K, Seller M, Cozens B, Harper A, Hetherington C, Lawton M, Trottier Y, Lehrach H, Davies SW, Bates GP. Exon 1 of the HD gene with an expanded CAG repeat is sufficient to cause a progressive neurological phenotype in transgenic mice. Cell. 1996;87:493–506. doi: 10.1016/s0092-8674(00)81369-0. [DOI] [PubMed] [Google Scholar]
- 38.McGeer EG, McGeer PL. Duplication of biochemical changes of Huntington's chorea by intrastriatal injections of glutamic and kainic acids. Nature. 1976;263:517–519. doi: 10.1038/263517a0. [DOI] [PubMed] [Google Scholar]
- 39.Reddy PH, Williams M, Charles V, Garrett L, Pike-Buchanan L, Whetsell WO, Jr, Miller G, Tagle DA. Behavioral abnormalities and selective neuronal loss in HD transgenic mice expressing mutated full-length HD cDNA. Nat Genet. 1998;20:198–202. doi: 10.1038/2510. [DOI] [PubMed] [Google Scholar]
- 40.Reddy PH, Charles V, Williams M, Miller G, Whetsell WO, Jr, Tagle DA. Transgenic mice expressing mutated full-length HD cDNA: a paradigm for locomotor changes and selective neuronal loss in Huntington's disease. Philos Trans R Soc Lond B Biol Sci. 1999;354:1035–1045. doi: 10.1098/rstb.1999.0456. [DOI] [PMC free article] [PubMed] [Google Scholar]
- 41.Sapp E, Schwarz C, Chase K, Bhide PG, Young AB, Penney J, Vonsattel J-P, Aronin N, DiFiglia M. Localization of huntingtin in multivesicular bodies in Huntington's disease. Ann Neurol. 1997;42:604–610. doi: 10.1002/ana.410420411. [DOI] [PubMed] [Google Scholar]
- 42.Sapp E, Penney J, Young A, Aronin N, Vonsattel J-P, DiFiglia M. Axonal transport of N-terminal huntingtin suggests early pathology of corticostriatal projections in Huntington's disease. J Neuropathol Exp Neurol. 1999;58:165–173. doi: 10.1097/00005072-199902000-00006. [DOI] [PubMed] [Google Scholar]
- 43.Saudou F, Finkbeiner S, Devys D, Greenberg ME. Huntingtin acts in the nucleus to induce apoptosis, but death does not correlate with the formation of intranuclear inclusions. Cell. 1998;95:55–66. doi: 10.1016/s0092-8674(00)81782-1. [DOI] [PubMed] [Google Scholar]
- 44.Sax DS, Powsner R, Kim A, Tilak S, Bhatia R, Cupples LA, Myers RH. Evidence of cortical metabolic dysfunction in early Huntington's disease by single-photon-emission computed tomography. Mov Disord. 1996;11:671–677. doi: 10.1002/mds.870110612. [DOI] [PubMed] [Google Scholar]
- 45.Schilling G, Becher MW, Sharp AH, Jinnah HA, Duan K, Kotzuk JA, Slunt HH, Ratovitski T, Cooper JK, Jenkins NA, Copeland NG, Price DL, Ross CA, Borchelt DR. Intranuclear inclusions and neuritic aggregates in transgenic mice expressing a mutant N-terminal fragment of huntingtin. Hum Mol Genet. 1999;8:397–407. doi: 10.1093/hmg/8.3.397. [DOI] [PubMed] [Google Scholar]
- 46.Sotrel A, Williams RS, Kaufmann WE, Myers RH. Evidence for neuronal degeneration and dendritic plasticity in cortical pyramidal neurons of Huntington's disease: a quantitative Golgi study. Neurology. 1993;43:2088–2096. doi: 10.1212/wnl.43.10.2088. [DOI] [PubMed] [Google Scholar]
- 47.Vonsattel J-P, DiFiglia M. Huntington disease. J Neuropathol Exp Neurol. 1998;57:369–384. doi: 10.1097/00005072-199805000-00001. [DOI] [PubMed] [Google Scholar]
- 48.Vonsattel J-P, Myers RH, Stevens TJ, Ferrante RJ, Bird ED, Richardson EP., Jr Neuropathological classification of Huntington's disease. J Neuropathol Exp Neurol. 1985;44:559–577. doi: 10.1097/00005072-198511000-00003. [DOI] [PubMed] [Google Scholar]
- 49.Welch BL. The generalization of Student's problem when several different population variances are involved. Biometrika. 1947;3:28–35. doi: 10.1093/biomet/34.1-2.28. [DOI] [PubMed] [Google Scholar]
- 50.Wheeler VC, White JK, Gutekunst C-A, Vrbanac V, Weaver M, Li X-J, Li S-H, Yi H, Vonsattel JP, Gusella JF, Hersch S, Auerbach W, Joyner AL, MacDonald ME. Long glutamine tracts cause nuclear localization of a novel form of huntingtin in medium spiny striatal neurons in HdhQ92 and HdhQ111 knock-in mice. Hum Mol Genet. 2000;9:503–513. doi: 10.1093/hmg/9.4.503. [DOI] [PubMed] [Google Scholar]
- 51.Yamamoto A, Lucas JJ, Hen R. Reversal of neuropathology and motor dysfunction in a conditional model of Huntington's disease. Cell. 2000;101:57–66. doi: 10.1016/S0092-8674(00)80623-6. [DOI] [PubMed] [Google Scholar]
- 52.Zeron MM, Chen N, Moshaver A, Ting-Chun Lee A, Wellington CL, Hayden MR, Raymond LA. Mutant huntingtin enhances excitotoxic cell death. Mol Cell Neurosci. 2001;17:41–53. doi: 10.1006/mcne.2000.0909. [DOI] [PubMed] [Google Scholar]