

Abstract
A principal function of the medial frontal cortex, in particular the anterior cingulate cortex (ACC), is to monitor action. The error-related negativity (ERN, or NE), an event-related brain potential, reflects medial frontal action-monitoring processes. Specifically, the error-detection theory of the ERN states that the ERN reflects ACC processing that is directly related to detecting the error. This theory predicts that ERN and ACC activity should increase directly with the dissimilarity of the error from the correct response, with similarity defined with respect to the common movement features of the responses. In contrast, the conflict-detection theory claims that ACC and ERN activity represent the detection of response conflict. This theory predicts that the activity should increase directly with the similarity of the error and the correct response. To test these theories, we investigated the effects of response similarity and conflict on the ERN, using a task that involved hand and foot movements. ERN activity was largest under conditions of high response conflict, where the error was similar to the correct response. This finding favors the conflict-detection theory over the error-detection theory, although the ERN was not associated with posterror slowing, as predicted by proponents of both theories. Discrepancies between our results and those of past studies may stem from the use in previous studies of four-finger response tasks which are subject to unique physiological and biomechanical constraints. We conclude that the ERN reflects medial frontal activity involved in the detection or affective processing of response conflict.
Keywords: anterior cingulate, error-related negativity, response conflict, error detection, event-related potential, action monitoring
A critical function of the human brain is to monitor behavior and prevent undesirable actions. Evidence suggests that the medial frontal cortex, particularly the anterior cingulate cortex (ACC), is involved in this action monitoring (Bush et al., 2000; Paus, 2001). Studies of the error-related negativity (ERN, or NE), a medial frontal negative component of the event-related brain potential, have contributed to this evidence. The ERN occurs at approximately the same time as errors in reaction time (RT) tasks (Falkenstein et al., 1991, 1995; Gehring et al., 1993,1995; Miltner et al., 1997; Tucker et al., 1999). Animal studies, source localization modeling, and functional magnetic resonance imaging (fMRI) suggest that the ERN is generated in the ACC (Gemba et al., 1986; Dehaene et al., 1994; Kiehl et al., 2000).
Investigators have developed competing theories about the psychological processes represented by medial frontal activity. According to one theory, the ERN reflects a process associated with error detection (Coles et al., 1995; Falkenstein et al., 1995). An opposing theory asserts that the activity reflects the detection of response conflict (Carter et al., 1998). Either type of processing will respond to erroneous response activation, but error detection indicates which response is incorrect, whereas conflict detection indicates only that competing responses are present in the motor system. Computational models and fMRI evidence support the plausibility of a conflict-detection process (Carter et al., 1998; Botvinick et al., 2001).
Our study focused on four-choice response tasks, where previous results have putatively supported the error-detection theory (Bernstein et al., 1995; Falkenstein et al., 1996). In these studies, participants responded with the index or middle finger of either hand. A larger ERN occurred when the error and the correct response were dissimilar (different fingers on opposite sides of the body) than when they were similar (adjacent or mirror-image fingers). Bernstein et al. (1995)found that error rates were greatest and the ERN was smallest when the error finger was adjacent to the correct-response finger, suggesting that those errors were the most similar to the correct response. These investigators concluded that the size of the ERN reflects how much the error deviates from the correct response (Bernstein et al., 1995;Falkenstein et al., 1996). If so, these results support the error-detection theory over the conflict-detection theory, because the ERN was smallest in the condition in which conflict was presumably greatest.
Nevertheless, because adjacent fingers interact at neural, muscular, and biomechanical levels (Ohtsuki, 1981; Hager-Ross and Schieber, 2000), conclusions obtained with four-finger tasks may have limited generality. Therefore, we used a hand–foot task (based on that ofBlythe, 1963) to eliminate the confounds inherent in adjacent-finger responses. According to error-detection theory, the ERN should be larger when the error and the correct response are dissimilar (e.g., left hand vs right foot). According to conflict-detection theory, the ERN should be larger when the error and correct response are similar (e.g., left hand vs left foot or left hand vs right hand).
MATERIALS AND METHODS
Participants. Six women and four men between the ages of 19 and 22 years (mean = 20.7 years) participated in the study. Participants received $6.00 per hour plus bonuses based on their performance. All were right-handed, had normal or corrected-to-normal vision, and normal color vision.
Apparatus and procedure. The stimuli were words presented on a 15 inch NEC (Tokyo, Japan) Multisync computer monitor. At a viewing distance of 60 cm, the letters subtended 1.5° of visual angle. A fixation cross (“+”) appeared 1° below the words. Stimuli (duration of 200 msec) were presented every 2400–2700 msec.
The task was a manual variant of the Stroop task (Macleod, 1991). Stimulus words were the color names “blue,” “green,” “purple,” “red,” and “yellow.” The words appeared on the screen in one of those five colors. For each participant, four of those colors were selected, and one was assigned to each of the four responses. A Latin square was used to assign stimuli to responses, such that each possible pair of colors was assigned to each response pair once in the group of 10 participants (Sheehe and Bross, 1961). Using five colors in the Latin square created a design for 10 participants. For each participant, one of the color words and its corresponding color did not appear.
On each trial, a stimulus word and stimulus color were chosen at random and presented to the participant. Participants were instructed to make one of the four responses according to the color of the stimulus, ignoring the stimulus word. Finger responses involved flexion of the right or left index finger, pressing a 1 cm2 button on a response pad (P/N 1141; Neuroscan, Inc., Sterling, VA). Foot responses involved plantar flexions of the right or left foot, depressing a pedal (Bilbo Innovations, Sunnyvale, CA) located on the floor.
Each participant completed two 4 hr sessions on separate days. At the beginning of the first session, participants filled out consent forms, a health and medication questionnaire, and a Beck depression inventory (Beck, 1961). In each session, after electrode application, participants were given two blocks of practice trials and then completed 24 blocks, each consisting of 64 trials.
Electrophysiological recording. The electroencephalogram (EEG) was recorded from 56 scalp electrode sites with tin electrodes embedded in a nylon mesh cap (Electro-Cap International, Eaton, OH). The electrode locations consisted of Fp1, Fp2, AF3, AFz, AF4, F7, F5, F3, F1, Fz, F2, F4, F6, F8, FT7, FC5, FC3, FC1, FCz, FC2, FC4, FC6, FT8, T7, C5, C3, C1, Cz, C2, C4, C6, T8, TP7, CP3, CPz, CP4, TP8, P7, P5, P3, P1, Pz, P2, P4, P6, P8, POz, O1, Oz, and O2 (American Electroencephalographic Society, 1991). Six additional sites were located at the midpoints of the following pairs: FCz–F1, FCz–F2, Cz–FC1, Cz–FC2, CPZ–C1, and CPZ–C2. EEG data were recorded with a left mastoid reference. An average mastoid reference was derived off-line using right mastoid data. The electro-oculogram (EOG) was recorded from tin electrodes above and below the left eye and external to the outer canthus of each eye. A ground electrode was placed on the forehead. A finger flexion electromyogram (EMG) was recorded from the first dorsal interosseous muscle; a plantar flexion EMG was recorded from the gastrocnemius muscle in the calf (Zipp, 1982). Impedances were kept below 10 kΩ. The EEG, EMG, and EOG were amplified by SYNAMPS amplifiers (Neuroscan, Inc.). The EEG and EOG were recorded from DC to 100 Hz (half-amplitude cutoff). The EMG was recorded from 10 to 200 Hz (half-amplitude cutoffs). The data were digitized at 1000 Hz.
Data reduction. After recording, the EMG data were digitally high-pass filtered with a half-amplitude cutoff point at 20 Hz (24 dB/octave roll-off) and rectified. EEG and EMG data were then digitally low-pass filtered with a half-amplitude cutoff point at 50 Hz (24 dB/octave roll-off) and reduced to a sampling rate of 200 Hz. The EEG data were corrected for vertical and horizontal ocular movement artifacts (Gratton et al., 1983). Statistical analyses used data filtered at the 50 Hz cutoff, referenced to the average of the mastoid electrodes. The data presented in the figures were filtered with a nine point Chebyshev II low-pass filter (Matlab 5.3; Mathworks, Natick, MA) with a half-amplitude cutoff at ∼8 Hz.
For each trial on which a button press occurred, we determined the time at which the onset of EMG activity occurred. The algorithm computed a threshold consisting of twice the SD of the integrated EMG in the 500 msec preceding the stimulus. It then started at the moment of switch closure and, working backward in time, found the first EMG data point that fell below that threshold value. It continued searching backward until the values stopped decreasing. That point was accepted as the EMG onset point if it occurred after the stimulus but within an interval of 300 msec before the switch closure (Van Boxtel et al., 1993). On average, the EMG onset preceded the switch closure by ∼100 msec. To maintain consistency with the previous studies, we did not attempt to identify errors that were evident in the EMG but that did not result in a switch closure (Bernstein et al., 1995; Falkenstein et al., 1996).
RESULTS
Each participant completed ∼3000 trials (range = 2911–3111) for a total of 30,070 observations. Participants maintained an overall error rate of 10.1% on average (range = 7.5–12.5%), resulting in 3047 observations on error trials. Errors were grouped into three types, which varied in their similarity to the correct response: ipsilateral, contralateral, and opposite (Blythe, 1963). In this case, an ipsilateral error was executed on the correct side of the body, with the incorrect limb. A contralateral error was executed on the incorrect side of the body, with the correct limb. Opposite errors were most dissimilar from the correct response, being responses in which both the limb and the side of the body were incorrect. In the analyses below that use these error categories, we perform two orthogonal contrasts: the first tested for an effect of similarity by comparing the two high-similarity conditions with the low-similarity condition (i.e., the mean of the contralateral and ipsilateral conditions vs the opposite condition). The second contrast compared the two high-similarity conditions (i.e., contralateral vs ipsilateral).
Behavioral data
Averaged error rates and RTs separated by error type are shown in Figure 1. We quantified the error rate as the proportion of errors within each condition; for the statistical analyses, we used the arc sine transform. As shown in Figure 1, participants made more errors in the two high-similarity conditions than in the low-similarity condition [F(1,9) = 194.339; p< 0.000001; mean squared error (MSe) = 0.0014]. The difference between the ipsilateral and contralateral conditions was marginally significant (F(1,9) = 3.92;p = 0.079; MSe = 0.0065). Identical contrasts on the RT data indicated that RTs were longer on high-similarity trials than on low-similarity trials (F(1,9)= 6.02; p = 0.037; MSe = 1853). RTs in the two high-similarity conditions, however, did not differ from each other (F(1,9) = 2.50; p = 0.15; MSe = 877).
Fig. 1.
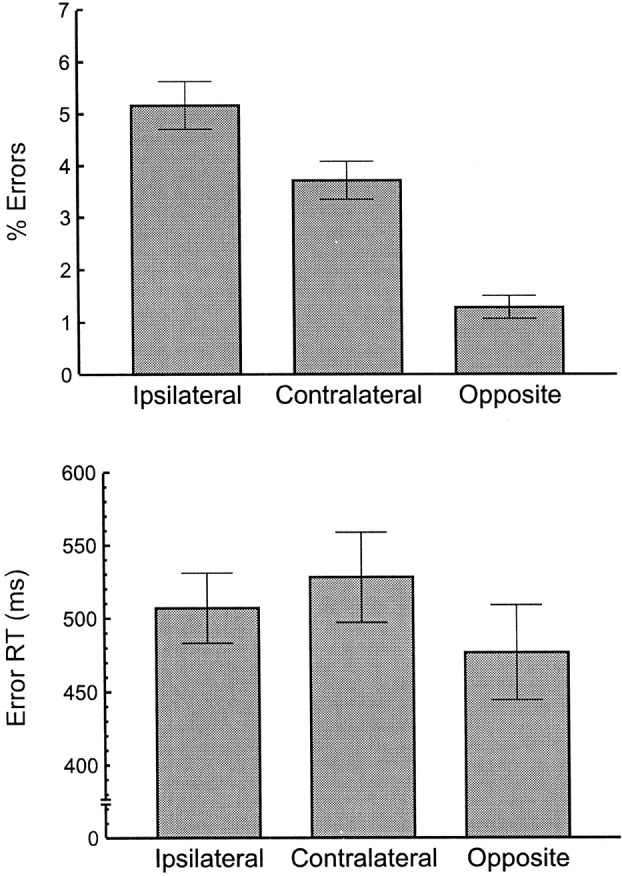
Response conflict was greatest for error responses that were similar to the correct response. Percentage of errors (top) and mean RT (bottom) are shown as a function of error type for all 10 participants.Ipsilateral denotes errors on the same side of the body as the correct response. Contralateral indicates an error committed on the incorrect side of the body, using the correct limb. Opposite indicates an error for which the limb and side were both incorrect. Error bars are ±1 SE.
To investigate individual differences in response strategy, we examined the participants who showed a pronounced tendency to make more ipsilateral than contralateral errors. This analysis was based on one by Bernstein et al. (1995), who showed that the effects of response similarity were most reliable in such participants. The rationale of the analysis was that for individuals whose errors tended to be ipsilateral, ipsilateral responses were most similar and confusable. Accordingly, we calculated the ratio of ipsilateral errors to contralateral errors for each participant. Participants whose ratio was >1 made more errors in which the side was correct but the limb was not; we refer to the error pattern in this group as ipsilateral-prevalent. Those whose ratio was <1 made more errors in which the limb was correct but the side was not; we refer to this error pattern as contralateral-prevalent. Comparing each participant's ratios from session 1 and session 2, we found that six participants consistently showed the ipsilateral-prevalent pattern, two consistently showed the contralateral-prevalent pattern, and two switched prevalence patterns from one session to the other. Our analysis focused on the six participants who showed a consistent ipsilateral-prevalent pattern.
Figure 2 shows the average error and RT pattern from the ipsilateral-prevalent group. As one would expect, there was a stronger tendency to make ipsilateral errors within the ipsilateral group than in the overall analysis. The error rate in the two high-similarity conditions was greater than in the low-similarity condition (F(1,5) = 75.12;p = 0.00034; MSe = 0.0022). Moreover, the error rate in the ipsilateral condition was greater than in the contralateral condition (F(1,5) = 16.54;p = 0.0097; MSe = 0.0035). The contrasts on RTs indicated that RTs were longer in the two high-similarity conditions than in the low-similarity condition (F(1,5) = 10.54; p = 0.023; MSe = 914). The RTs on ipsilateral trials and contralateral trials did not differ (F(1,5) = 1.10;p = 0.34; MSe = 1109).
Fig. 2.
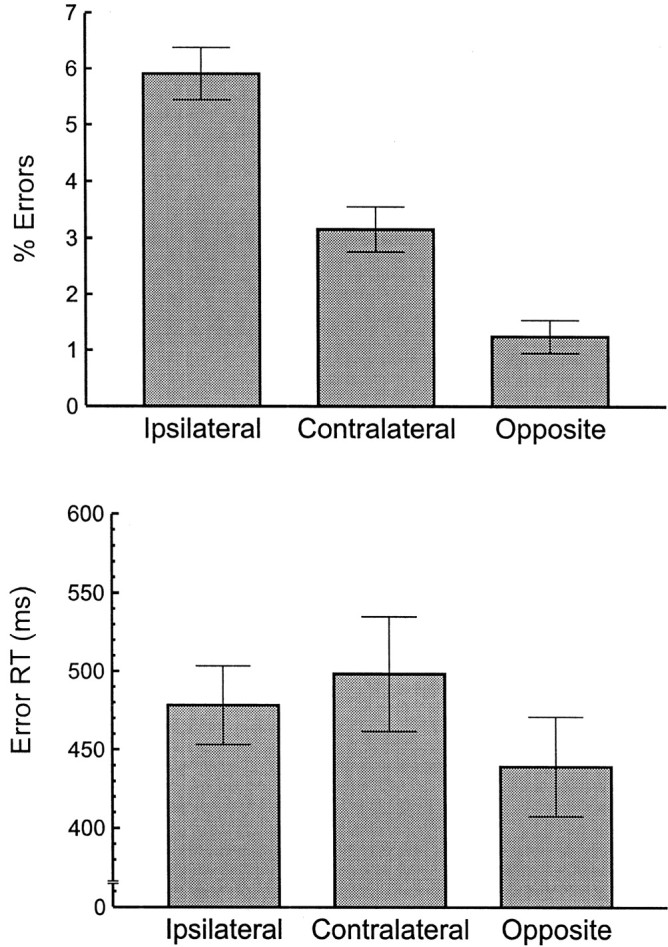
A subgroup of six participants showing the greatest tendency to make ipsilateral errors. Percentage of errors (top) and mean RT (bottom) are shown as a function of error type for participants showing more ipsilateral errors than contralateral errors (ipsilateral-prevalent participants). Error types are described in Figure 1. Error bars are ±1 SE.
Our analysis of RT and error rates establishes that the participants, in particular the subgroup with the ipsilateral-prevalent error pattern, had a greater tendency to make errors and respond slowly when the error and correct response were similar, with the greatest increase in error rate occurring for ipsilateral errors.
The ERN
We derived the ERN by aligning the EEG records from each trial at the point of EMG onset and averaging separately for correct and error responses. Consistent with previous studies, the ERN appeared as a distinct peak on error trials beginning ∼50 msec after EMG onset and peaking at ∼165 msec. The scalp maximum of the ERN occurred at the frontocentral electrode site FCz (Fig.3). Little or no ERN was present on correct trials.
Fig. 3.
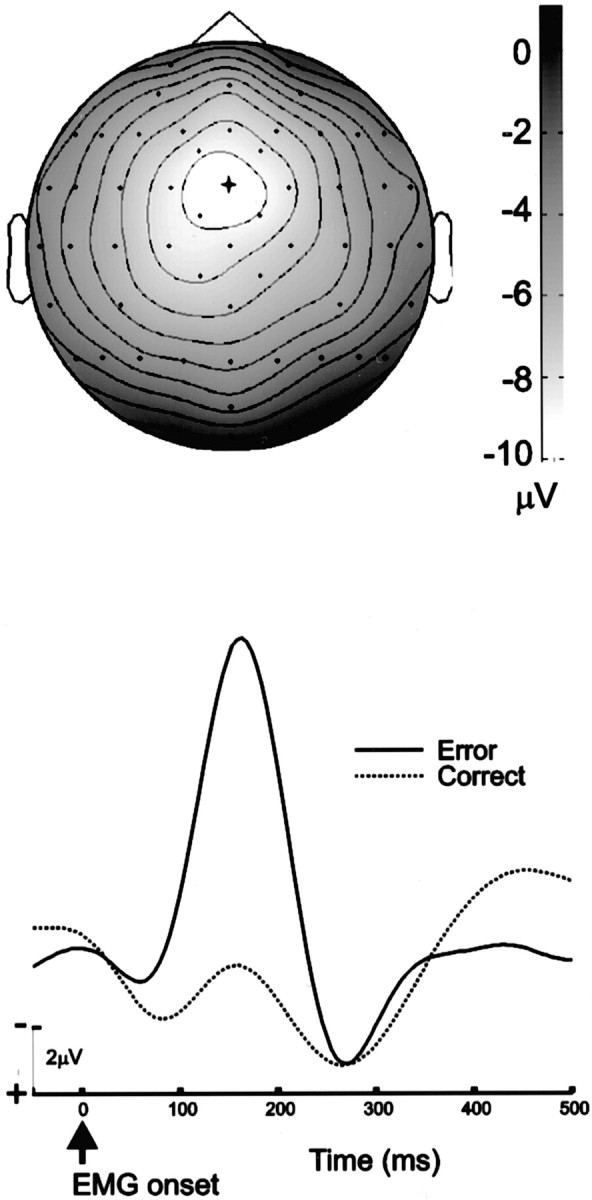
Grand average ERN scalp topography and waveform.Top, A topographic map of the ERN peak (error-correct difference) at 155–165 msec after the onset of EMG activity.Lighter colors represent regions of greater negativity;isocontour lines represent increments of 1 μV.Dots represent electrode locations. The view shows the top of the head, with the nose pointing upward. The scalp maximum of the ERN occurs at the FCz electrode, indicated by thecross. Bottom, the grand average ERN waveform at FCz. The ERN is evident as a negative-polarity peak at 165 msec after EMG onset.
As we mentioned previously, the primary analysis of interest concerns whether the ERN was larger for high-similarity errors than for low-similarity errors, supporting conflict-detection theory, or had the reverse pattern predicted by error-detection theory. To evaluate the effect of error type on the ERN, we calculated the mean amplitude at FCz for each error type in the epoch from 140 to 190 msec after EMG onset, spanning the peak of the ERN, relative to a baseline interval of 0–50 msec after the onset of the EMG. Figure4 shows that errors in the two high-similarity categories were associated with a larger ERN than errors in the low-similarity category (F(1,9) = 5.02; p = 0.052; MSe = 5.93). Of the two high-similarity conditions, the ipsilateral errors were associated with ERN amplitudes that were greater than those of contralateral errors (F(1,9) = 6.07; p = 0.034; MSe = 2.02).
Fig. 4.

The amplitude of the ERN was greatest in the high-conflict, ipsilateral error condition. Error-trial ERN waveforms for all 10 participants are plotted as a function of error type. EMG onset occurs at time 0. The waveform is from the frontocentral electrode FCz. Error types are described in Figure1.
Next we performed a separate analysis on the ipsilateral-prevalent group, who had the greatest tendency to make ipsilateral errors. The ERN data for those participants are shown in Figure5. The results were qualitatively similar to the overall analysis but appear more pronounced: ERN amplitudes in the two high-similarity conditions were greater than those in the low-similarity condition (F(1,5) = 8.05; p = 0.036; MSe = 6.17). The ipsilateral error ERN was larger than the contralateral error ERN (F(1,5) = 99.15; p = 0.00018; MSe = 0.19).
Fig. 5.

The effects of response conflict on the ERN waveform were greatest for participants whose behavior was disrupted most by response conflict. Error-trial ERN waveforms for ipsilateral-prevalent participants on error trials are plotted as a function of error type. EMG onset occurs at time 0. Error types are described in Figure 1.
To ensure that the preceding changes in ERN amplitude resulted from a change in the activity of the cortical generator of the ERN, rather than activity in some other brain region, we computed topographic maps of the ERN effects. Specifically, we subtracted the opposite error waveform from the ipsilateral waveform using the waveforms seen in Figures 4 and 5. We computed topographic maps from the difference waveforms in the 155–165 msec epoch, at the peak of the ERN. Figure6 shows these maps. The frontocentral (FCz) scalp maximum seen in both maps confirms that the modulations in ERN amplitude seen in Figures 4 and 5 result from a change in the activity of the cortical generator of the ERN and not from some other source.
Fig. 6.

Topographic maps confirm that the event-related potential conflict effects resulted from changes in the cortical generator of the ERN. Maps represent the difference between the ipsilateral errors and opposite errors at 155–165 msec after the onset of EMG activity. Lighter colors represent regions of greater negativity; isocontour lines represent increments of 1 μV. Dots represent electrode locations. The view shows the top of the head, with the nose pointing upward. The scalp maximum of the conflict effect occurs at the FCz electrode, the site of the ERN, indicated by the cross.Left, Map from all 10 participants;right, map from the ipsilateral-prevalent group.
The ERN and posterror behavior
In preliminary analyses, we determined that correct responses after errors were slower than the overall mean RT, and so we explored the relationship between the ERN and posterror slowing. Proponents of error-detection and conflict-detection theories predict that the degree of slowing on the posterror trial will be directly related to the amount of ERN activity on the preceding error trial (Coles et al., 1995; Botvinick et al., 2001). Figure7 shows the average RTs for the trials before and after an error (omitting sequences in which an error occurred in the pre-error or posterror sequence). Participants' responses became increasingly fast until an error occurred. The correct response after the error was slower than the error and other correct responses. We used paired t tests to compare the RTs in these sequences with the mean of all correct RTs (Fig. 7). Three of the four responses before the error were significantly faster than the mean correct RT. The error itself was faster than the mean correct RT, and the correct response immediately after the error was slower than the mean correct RT.
Fig. 7.

Reaction times on correct trials (C) before and after the error (E) show that participants increased their speed before the error and then slowed responses after the error. Error bar indicates mean correct reaction time for all trials except those that occur immediately after errors. The reaction times in theline represent four correct trials before the error (−4) to four correct trials after the error (+4). Error bars are +1 SE. Values differing from the mean correct reaction time on theleft are indicated by asterisks(t(9) = p < 0.05; one-tailed t test). From left toright, the t values are 2.25, 1.25, 3.12, 4.42, 3.02, −2.07, −0.65, 0.50, and 1.21.
To determine whether the ERN was associated with this slowing, we compared sequences in which slowing was clearly evident with those in which little or no slowing occurred. We matched each error trial with another error trial of the same type on the basis of RT. If no exact match was available, the trial with the closest RT was accepted as a match, unless that RT differed from the first error trial by >10 msec. (For multiple exact or near matches, a match was drawn at random.) We then sorted these two trial types according to which preceded the longest RT on the subsequent correct trial. As shown in Figure8, left, this procedure created one set of trials that on average had a comparatively large amount of slowing after the error and another set in which little or no slowing was evident. As shown in Figure 8, right, the ERN on error trials preceding fast correct responses was virtually identical to that preceding slow correct responses (F = 0.00). This result was duplicated in a separate analysis focusing on the ipsilateral-prevalent group (F = 0.00); both results indicate that posterror slowing was not related to the preceding ERN.
Fig. 8.

The degree of ERN activity was unrelated to the amount of posterror slowing. Left, Trials that were identified as associated with slowing after the error or with no slowing, where the two sets of trials had equivalent error-trial reaction times. Those trials formed the basis of the analysis on theright, which compares the ERN that preceded posterror slowing with the ERN that was not associated with slowing.
DISCUSSION
Our results disconfirm the predictions of the error-detection theory of ERN–ACC function (Bernstein et al., 1995;Falkenstein et al., 1996; Coles et al., 2001). The response-similarity-dependent increase in ERN amplitude is more consistent with the conflict-detection theory of the ERN and ACC (Carter et al., 1998; Botvinick et al., 2001). The smallest degree of response conflict (and the smallest ERN) was observed when the error and the correct response were dissimilar. The data suggest that the ipsilateral condition, showing the largest ERN, was also associated with the greatest response conflict: ERN and behavioral effects were most pronounced in those participants for whom the ipsilateral errors were most similar to the correct response. This behavioral result is consistent with Blythe's (1963) report that errors in a four-choice hand–foot task were predominantly ipsilateral. Contralateral errors were also associated with elevated reaction times, but the error rate for these errors was smaller than for the ipsilateral errors, suggesting that the contralateral errors were associated with an intermediate level of conflict between that of the ipsilateral and opposite errors.
The studies by Bernstein et al. (1995) and Falkenstein et al. (1996)used a four-finger response task and found ERN results that were essentially the opposite of our own. Nonetheless, four-finger tasks may have limited generality. Finger movements cause a number of interfinger interactions that can affect responses in a four-finger task. Movement of one finger is accompanied by movements in nearby fingers (Hager-Ross and Schieber, 2000). The pattern is complex, however, because isometric flexion of one finger in gripping movements reduces the muscle activity and strength of the adjacent finger (Ohtsuki, 1981). The interactions between fingers may result from a number of biomechanical, muscular, and neural factors (Ohtsuki, 1981; Hager-Ross and Schieber, 2000). Control mechanisms should therefore be less sensitive to ipsilateral movements in the four-finger task, in which coactivation is not a reliable indicator of response conflict, than in the hand–foot task. If sensitivity were reduced in this manner, then a decreased ERN in the ipsilateral condition, as observed by Bernstein et al. (1995), would result. In the Botvinick et al. (2001) model, such an adjustment might involve a reduction in the mutual inhibition between units corresponding to adjacent fingers.
Participants' responses gradually became faster until the error occurred and then slowed after the error, consistent with the hypothesis that participants adjusted their speed in response to the error (Rabbitt and Rodgers, 1977; Laming, 1979) or to conflict (Botvinick et al., 2001). Our finding that posterror slowing was unrelated to the size of the preceding ERN contradicts the assertions of error-detection and conflict-detection theorists that ERN and ACC activity should be related to posterror slowing (Gehring et al., 1993;Coles et al., 1995; Botvinick et al., 2001). Nonetheless, a dissociation between the ERN and posterror slowing may not be a critical disconfirmation of either theory. Posterror slowing might not be the strategic reaction to the error that some investigators have claimed (Rabbitt and Rodgers, 1977; Botvinick et al., 2001). For example, some posterror trials could represent a continuation of the breakdown in processing that caused the error. Moreover, with short intervals between trials, capacity limits related to processing the error can interfere with processing on the posterror trial (Welford, 1979). Finally, even if the slowing were a strategic reaction, the ERN might simply precede some other reaction to an error, such as autonomic, verbal, or postural activity.
Our data suggest that it is more likely that conflict detection, rather than error detection, is the computational source of the ERN. A few investigators have claimed to disconfirm the conflict-detection theory by showing a larger ERN in conditions in which the stimuli engender response conflict than in conditions involving less confusable stimuli (Falkenstein et al., 2000; Scheffers and Coles, 2000). Nonetheless, an error in response to a conflict-laden stimulus will not necessarily encounter more competition than an error in response to a simpler stimulus. Conflict will be related not only to the stimulus but also to motor activity from anticipatory guessing (Gratton et al., 1988), corrective action (our unpublished observations), and even aspecific fluctuations in readiness (Coles et al., 1985).
Another line of evidence against conflict-detection theory has attempted to dissociate measures of conflict from the ERN. These studies, however, depend on the assumption that the measures are sensitive to all of the relevant conflict. Studies have used the lateralized readiness potential (LRP) as an index of conflict and have dissociated it from the ERN (Falkenstein et al., 2000; Luu et al., 2000b). The LRP, however, is limited in its ability to measure conflict: It measures the difference in activation between responses and not the conflicting activation they share in common. EMG measures of conflict are limited in a similar manner. Coles et al. (2001)reported that the ERN on error trials was larger than on correct trials, even for correct trials that had the same amount of agonist EMG on each arm as the error trials, supporting the sensitivity of the ERN to errors rather than conflict (M. G. H. Coles, personal communication). Nevertheless, response conflict can be present with no discernable agonist-muscle EMG activity (Gratton et al., 1988), and on-line adjustments in EMG activity can reduce or reverse the effects of conflict on the agonist–muscle EMG activity (Gordon and Ghez, 1987) (W. J. Gehring and A. R. Willoughby, unpublished observations). Moreover, EMG and LRP measure preresponse activity, yet computational models of conflict indicate that the period after the error should be when conflict is maximal (Botvinick et al., 2001).
More difficult to reconcile with conflict-detection theory are studies showing medial-frontal negative-polarity brain potentials similar to the ERN in response to feedback stimuli that are temporally separate from the error response (Miltner et al., 1997), stimuli that are associated with negative affect (Tucker et al., 1999), and stimuli signifying monetary losses (Gehring and Willoughby, unpublished observations). ERN and ACC activity might therefore represent a more general evaluative system, one that processes the motivational significance of events including, but not limited to, errors and conflict (Bush et al., 2000). Consistent with this perspective, performance emphasizing accuracy over speed increases the size of the ERN (Gehring et al., 1993; Falkenstein et al., 1995). Individual differences support this perspective: ERN dysfunctions have been reported in individuals who are high in negative affect and negative emotionality (Luu et al., 2000a), individuals with obsessive-compulsive disorder (Gehring et al., 2000), and individuals with symptoms of psychopathy (Dikman and Allen, 2000). Also consistent with a broader significance of the ERN is a recent report that the ERN is part of the frontal midline θ rhythm (Luu and Tucker, 2001), which is consistent with the oscillatory appearance of the ERN in numerous articles (Gehring et al., 1995, 2000).
Yet the question of how to integrate these findings with the notion of conflict detection remains. One possibility is that processing conflict and processing the motivational significance of errors engages distinct parts of the ACC. The locus of error-related fMRI activation (Kiehl et al., 2000; Menon et al., 2001) has thus far tended to lie anterior to the locus of conflict-related activation (Carter et al., 1998). Another possibility is that a broader theory of ACC function might be necessary, one that encompasses the processing of conflict as well as motivational significance. Botvinick et al. (2001) note that many circumstances other than response conflict activate the ACC, and they suggest that the conflict detection apparatus is part of an “early warning system,” a general system for determining when cognitive control is needed to prevent negative outcomes.
Our suggestion is somewhat the reverse: that conflict, as defined byBotvinick et al. (2001), is itself a notion that might unify various “warning signal” functions of the ACC (including the function represented by the ERN). The initial cortical line of defense against negative events is a signal that something is amiss, without specifying what is wrong. This information is provided by the energy [in the sense proposed by Botvinick et al. (2001)] across multiple cognitive, affective, and motor representations. Early detection of conflict among these representations can generate fast aspecific interventions, whereas slower mechanisms determine the causes of the problem. In its function, then, conflict detection is very similar to the cyclical redundancy check used in computer systems to ensure the integrity of computer data transmissions: a computation that detects the need for additional corrective computation and retransmission without specifying exactly what went wrong. If the ERN is indeed a part of midline frontal θ, it could represent part of a signal that ensures the consistency of parallel computations in distributed cortical and subcortical areas (Luu and Tucker, 2001), becoming especially prominent on error trials, when those computations conflict.
Footnotes
This research was supported by National Institute of Mental Health Grant MH55286-01 to W.J.G. and by a National Science Foundation Graduate Fellowship to D.E.F. We gratefully acknowledge the comments provided by David E. Meyer and Adrian Willoughby.
Correspondence should be addressed to William J. Gehring, Department of Psychology, University of Michigan, 525 East University, Ann Arbor, MI 48109-1109. E-mail: wgehring@umich.edu.
REFERENCES
- 1.American Electroencephalographic Society. American Electroencephalographic Society guidelines for standard electrode position nomenclature. J Clin Neurophysiol. 1991;8:200–202. [PubMed] [Google Scholar]
- 2.Beck AT. An inventory for measuring depression. Arch Gen Psychiatry. 1961;4:561–571. doi: 10.1001/archpsyc.1961.01710120031004. [DOI] [PubMed] [Google Scholar]
- 3.Bernstein PS, Scheffers MK, Coles MGH. Where did I go wrong? A psychophysiological analysis of error-detection. J Exp Psychol Hum Percept Perform. 1995;21:1312–1322. doi: 10.1037//0096-1523.21.6.1312. [DOI] [PubMed] [Google Scholar]
- 4.Blythe KW. Ipsilateral confusion in 2-choice and 4-choice responses with the hands and feet. Nature. 1963;199:1312. doi: 10.1038/1991312a0. [DOI] [PubMed] [Google Scholar]
- 5.Botvinick MM, Braver TS, Barch DM, Carter CS, Cohen JD. Conflict monitoring and cognitive control. Psychol Rev. 2001;108:624–652. doi: 10.1037/0033-295x.108.3.624. [DOI] [PubMed] [Google Scholar]
- 6.Bush G, Luu P, Posner MI. Cognitive and emotional influences in anterior cingulate cortex. Trends Cogn Sci. 2000;4:215–222. doi: 10.1016/s1364-6613(00)01483-2. [DOI] [PubMed] [Google Scholar]
- 7.Carter CS, Braver TS, Barch DM, Botvinick MM, Noll D, Cohen JD. Anterior cingulate cortex, error detection, and the online monitoring of performance. Science. 1998;280:747–749. doi: 10.1126/science.280.5364.747. [DOI] [PubMed] [Google Scholar]
- 8.Coles MGH, Gratton G, Bashore TR, Eriksen CW, Donchin E. A psychophysiological investigation of the continuous flow model of human information processing. J Exp Psychol Hum Percept Perform. 1985;11:529–553. doi: 10.1037//0096-1523.11.5.529. [DOI] [PubMed] [Google Scholar]
- 9.Coles MGH, Scheffers MK, Fournier L. Where did you go wrong? Errors, partial errors, and the nature of human information-processing. Acta Psychol (Amst) 1995;90:129–144. doi: 10.1016/0001-6918(95)00020-u. [DOI] [PubMed] [Google Scholar]
- 10.Coles MGH, Scheffers MK, Holroyd CB. Why is there an ERN/Ne on correct trials? Response representations, stimulus-related components, and the theory of error-processing. Biol Psychol. 2001;56:173–189. doi: 10.1016/s0301-0511(01)00076-x. [DOI] [PubMed] [Google Scholar]
- 11.Dehaene S, Posner MI, Tucker DM. Localization of a neural system for error-detection and compensation. Psychol Sci. 1994;5:303–305. [Google Scholar]
- 12.Dikman ZV, Allen JJ. Error monitoring during reward and avoidance learning in high- and low-socialized individuals. Psychophysiology. 2000;37:43–54. [PubMed] [Google Scholar]
- 13.Falkenstein M, Hohnsbein J, Hoormann J, Blanke L. Effects of crossmodal divided attention on late ERP components. II. Error processing in choice reaction tasks. Electroencephalogr Clin Neurophysiol. 1991;78:447–455. doi: 10.1016/0013-4694(91)90062-9. [DOI] [PubMed] [Google Scholar]
- 14.Falkenstein M, Hohnsbein J, Hoormann J. Event-related potential correlates of errors in reaction tasks. In: Karmos G, Molnár M, Csépe V, Czigler I, Desmedt JE, editors. Perspectives of event-related potentials research. Elsevier; Amsterdam: 1995. pp. 287–296. [PubMed] [Google Scholar]
- 15.Falkenstein M, Hohnsbein J, Hoormann J. Differential processing of motor errors. In: Ogura C, Koga Y, Shimokochi M, editors. Recent advances in event-related brain potential research. Elsevier; Amsterdam: 1996. pp. 579–585. [Google Scholar]
- 16.Falkenstein M, Hoormann J, Christ S, Hohnsbein J. ERP components on reaction errors and their functional significance: a tutorial. Biol Psychol. 2000;51:87–107. doi: 10.1016/s0301-0511(99)00031-9. [DOI] [PubMed] [Google Scholar]
- 17.Gehring WJ, Goss B, Coles MGH, Meyer DE, Donchin E. A neural system for error-detection and compensation. Psychol Sci. 1993;4:385–390. [Google Scholar]
- 18.Gehring WJ, Coles MGH, Meyer DE, Donchin E. A brain potential manifestation of error-related processing. In: Karmos G, Molnár M, Csépe V, Czigler I, Desmedt JE, editors. Perspectives of event-related potentials research. Elsevier; Amsterdam: 1995. pp. 267–272. [Google Scholar]
- 19.Gehring WJ, Himle J, Nisenson LG. Action-monitoring dysfunction in obsessive-compulsive disorder. Psychol Sci. 2000;11:1–6. doi: 10.1111/1467-9280.00206. [DOI] [PubMed] [Google Scholar]
- 20.Gemba H, Sasaki K, Brooks VB. Error potentials in limbic cortex (anterior cingulate area-24) of monkeys during motor learning. Neurosci Lett. 1986;70:223–227. doi: 10.1016/0304-3940(86)90467-2. [DOI] [PubMed] [Google Scholar]
- 21.Gordon J, Ghez C. Trajectory control in targeted force impulses. III. Compensatory adjustments for initial errors. Exp Brain Res. 1987;67:253–269. doi: 10.1007/BF00248547. [DOI] [PubMed] [Google Scholar]
- 22.Gratton G, Coles MG, Donchin E. A new method for off-line removal of ocular artifact. Electroencephalogr Clin Neurophysiol. 1983;55:468–484. doi: 10.1016/0013-4694(83)90135-9. [DOI] [PubMed] [Google Scholar]
- 23.Gratton G, Coles MG, Sirevaag EJ, Eriksen CW, Donchin E. Pre- and poststimulus activation of response channels: a psychophysiological analysis. J Exp Psychol Hum Percept Perform. 1988;14:331–344. doi: 10.1037//0096-1523.14.3.331. [DOI] [PubMed] [Google Scholar]
- 24.Hager-Ross C, Schieber MH. Quantifying the independence of human finger movements: comparisons of digits, hands, and movement frequencies. J Neurosci. 2000;20:8542–8550. doi: 10.1523/JNEUROSCI.20-22-08542.2000. [DOI] [PMC free article] [PubMed] [Google Scholar]
- 25.Kiehl KA, Liddle PF, Hopfinger JB. Error processing and the rostral anterior cingulate: an event-related fMRI study. Psychophysiology. 2000;36:765–774. [PubMed] [Google Scholar]
- 26.Laming D. Choice reaction performance following an error. Acta Psychol (Amst) 1979;43:199–224. doi: 10.1016/0001-6918(79)90032-5. [DOI] [PubMed] [Google Scholar]
- 27.Luu P, Tucker DM. Regulating action: alternating activation of midline frontal and motor cortical networks. Clin Neurophysiol. 2001;112:1295–1306. doi: 10.1016/s1388-2457(01)00559-4. [DOI] [PubMed] [Google Scholar]
- 28.Luu P, Collins P, Tucker DM. Mood, personality, and self-monitoring: negative affect and emotionality in relation to frontal lobe mechanisms of error monitoring. J Exp Psychol Gen. 2000a;129:43–60. doi: 10.1037//0096-3445.129.1.43. [DOI] [PubMed] [Google Scholar]
- 29.Luu P, Flaisch T, Tucker DM. Medial frontal cortex in action monitoring. J Neurosci. 2000b;20:464–469. doi: 10.1523/JNEUROSCI.20-01-00464.2000. [DOI] [PMC free article] [PubMed] [Google Scholar]
- 30.Macleod CM. Half a century of research on the Stroop effect: an integrative review. Psychol Bull. 1991;109:163–203. doi: 10.1037/0033-2909.109.2.163. [DOI] [PubMed] [Google Scholar]
- 31.Menon V, Adleman NE, White CD, Glover GH, Reiss AL. Error-related brain activation during a Go/NoGo response inhibition task. Hum Brain Mapp. 2001;12:131–143. doi: 10.1002/1097-0193(200103)12:3<131::AID-HBM1010>3.0.CO;2-C. [DOI] [PMC free article] [PubMed] [Google Scholar]
- 32.Miltner WHR, Braun CH, Coles MGH. Event-related brain potentials following incorrect feedback in a time-estimation task: evidence for a “generic” neural system for error detection. J Cogn Neurosci. 1997;9:788–798. doi: 10.1162/jocn.1997.9.6.788. [DOI] [PubMed] [Google Scholar]
- 33.Ohtsuki T. Inhibition of individual fingers during grip strength exertion. Ergonomics. 1981;24:21–36. doi: 10.1080/00140138108924827. [DOI] [PubMed] [Google Scholar]
- 34.Paus T. Primate anterior cingulate cortex: where motor control, drive and cognition interface. Nat Rev Neurosci. 2001;2:417–424. doi: 10.1038/35077500. [DOI] [PubMed] [Google Scholar]
- 35.Rabbitt P, Rodgers B. What does a man do after he makes an error? An analysis of response programming. Q J Exp Psychol. 1977;29:727–743. [Google Scholar]
- 36.Scheffers MK, Coles MGH. Performance monitoring in a confusing world: error-related brain activity, judgments of response accuracy, and types of errors. J Exp Psychol Hum Percept Perform. 2000;26:141–151. doi: 10.1037//0096-1523.26.1.141. [DOI] [PubMed] [Google Scholar]
- 37.Sheehe PR, Bross IDJ. Latin squares to balance immediate residual and other effects. Biometrics. 1961;17:405–414. [Google Scholar]
- 38.Tucker DM, Hartry-Speiser A, McDougal L, Luu P, deGrandpre D. Mood and spatial memory: emotion and right hemisphere contribution to spatial cognition. Biol Psychol. 1999;50:103–125. doi: 10.1016/s0301-0511(99)00005-8. [DOI] [PubMed] [Google Scholar]
- 39.Van Boxtel GJ, Geraats LH, Van den Berg-Lenssen MM, Brunia CH. Detection of EMG onset in ERP research. Psychophysiology. 1993;30:405–412. doi: 10.1111/j.1469-8986.1993.tb02062.x. [DOI] [PubMed] [Google Scholar]
- 40.Welford AT. Comment on the paper “What does a man do after he makes an error? An analysis of response programming” by Patrick Rabbitt and Bryan Rodgers. Q J Exp Psychol. 1979;31:539–542. [Google Scholar]
- 41.Zipp P. Recommendations for the standardization of lead positions in surface electromyography. Eur J Appl Physiol. 1982;50:41–54. [Google Scholar]