

Abstract
Gamma-frequency (30–70 Hz) oscillations in populations of interneurons may be of functional relevance in the brain by virtue of their ability to induce synchronous firing in principal neurons. Such a role would require that neurons, 1 mm or more apart, be able to synchronize their activity, despite the presence of axonal conduction delays and of the limited axonal spread of many interneurons. We showed previously that interneuron doublet firing can help to synchronize gamma oscillations, provided that sufficiently many pyramidal neurons are active; we also suggested that gap junctions, between the axons of principal neurons, could contribute to the long-range synchrony of gamma oscillations induced in the hippocampus by carbachol in vitro. Here we consider interneuron network gamma: that is, gamma oscillations in pharmacologically isolated networks of tonically excited interneurons, with frequency gated by mutual GABAAreceptor-mediated IPSPs. We provide simulation and electrophysiological evidence that interneuronal gap junctions (presumably dendritic) can enhance the synchrony of such gamma oscillations, in spatially extended interneuron networks. There appears to be a sharp threshold conductance, below which the interneuron dendritic gap junctions do not exert a synchronizing role.
Keywords: 40 Hz, electrical coupling, synaptic inhibition, connexins, hippocampus, cortex
Synchronized oscillations of populations of neurons occur in diverse brain structures over a range of frequencies (<1 to >200 Hz) in a manner that is modulated by behavioral state and sensory input. Oscillations provide a temporal framework for the synchronous firing of principal neurons; in turn, the synchronous firing of particular subsets of principal neurons may have cognitive significance (Buzsáki and Chrobak, 1995; Singer and Gray, 1995). In the mammalian brain, synchronizing mechanisms in some cases depend in part on the ability of populations of GABAergic cells to entrain the firing of principal neurons (Lytton and Sejnowski, 1991;von Krosigk et al., 1993; Cobb et al., 1995; Whittington et al., 1995,2000).
In those gamma oscillations that involve primarily interneuron networks, an important issue is this: how synchrony can be maintained in the presence of “heterogeneity” in the intrinsic firing rates of the interneurons and also how synchrony can be maintained in the presence of spatial factors, such as axon conduction delays, and limited extent of axons relative to the size of the oscillating system. Simulation studies of simplified neuronal networks (i.e., with conduction delays and axonal spread ignored) have shown the following: networks that are coupled only by inhibition need not robustly synchronize when the network is heterogeneous (Wang and Buzsáki, 1996; White et al., 1998). Although high coherence is possible with as much as 10% heterogeneity in uncoupled frequencies, the region in parameter space in which such coherence can be maintained may be small (White et al., 1998). Outside this region, many cells may be partially or wholly suppressed, or (when driven at high rates with low inhibitory conductance) the cells may fire incoherently. These simulations ignore the additional heterogeneity that comes about as a result of spatial structure in the network, with cells in different parts of the network receiving inputs only from nearby cells.
Experimentally, however, gamma oscillations in interneuron networks do occur coherently over distances of at least 1 mm, as determined by observations of IPSPs or entraining in pairs of pyramidal cells (Whittington et al., 1995). Although the 1 mm distance is not long enough to exclude some interneurons from connecting diffusely throughout the array, it is unlikely that, in the biological system, interneurons are excited as uniformly as in the simulations. The intrinsic membrane properties and synaptic output of different interneurons are also known not to be stereotyped (Buhl et al., 1994a,1996). Thus, the limited-heterogeneity requirement of simulations of interneuron networks is unlikely to apply in biological networks.
One means that neuronal networks have for long-range synchronization involves interneuron spike doublets under the influence of phasic synaptic input from pyramidal neurons (Traub et al., 1996b, 1999;Whittington et al., 1997, 1998; Ermentrout and Kopell, 1998; Fuchs et al., 2001). This means is not available to interneuron networks that are pharmacologically isolated.
Recent studies of electrically coupled pairs of cortical interneurons have shown that electrical coupling can produce an entraining effect if both cells are injected with depolarizing current (Galarreta and Hestrin, 1999; Gibson et al., 1999) or if the coupling from one cell to the other is both electrical and GABAergic (Tamás et al., 2000). An additional study (Beierlein et al., 2000) has shown that gap junctions can synchronize neocortical low-threshold spiking (LTS) interneurons, in a 3–6 Hz rhythm, which persists when ionotropic glutamate and GABAA receptors are blocked. Here we show, in simulations and experiments, that the synchronization of IPSP-mediated gamma oscillations (in pharmacologically isolated interneuron networks) is enhanced by dendritic gap junctions, especially when synchronization over distance is considered.
MATERIALS AND METHODS
Simulation methods. Single interneurons were multicompartment objects (46 compartments for soma–dendrites, five for the axon), with spatially distributed active membrane conductances, simulated as by Traub and Miles (1995). (The only alteration made relative to the 1995 paper was to increase the resistance coupling the soma to the axon initial segment by a factor of two.) Three hundred eighty-four interneurons were laid out into a 96 × 4 array (Fig.1), whose synaptic connectivity is described in detail by Traub et al. (1999). We consider four types of interneuron, named after the connection patterns made with pyramidal cells (Traub et al., 1999), although pyramidal cells were not simulated in the present study: basket cells, axo-axonic cells, and two types of interneuron that contact pyramidal cell dendrites. (In the present study, the two types of dendrite-contacting interneurons are indistinguishable.) We used several types of interneurons to remain consistent with earlier network models and to incorporate biological detail. Synaptic connections are formed randomly between pairs of interneurons, subject to these constraints: (1) presynaptic and postsynaptic somata are within 25 units (i.e., 500 μm) along the long axis of the array (Fig. 1, Synaptic scale); and (2) each interneuron has exactly 20 inputs from basket cells and 20 inputs from each of the two types of dendrite-contacting interneurons. Each synaptic connection took place on a single compartment in the proximal dendrites. A basket cell IPSC peaked in one time step at 2.0 nS and then decayed exponentially with a time constant of 5 msec. (The fast time constant of GABAA IPSC decay in cortical interneurons is 8.33 ± 2.09 msec (Tamás et al., 2000). Compound IPSCs in stratum pyramidale CA1 interneurons, occurring during gamma oscillations evoked by pressure ejection ofl-glutamate with ionotropic glutamate and GABAB receptors blocked, decayed with time constants as short as ∼8 msec (Traub et al., 1996a). Note, however, that oriens–lacunosum moleculare interneurons can exhibit IPSCs with 50% decay times as short as 1.9 msec, hence decay time constants as short as 2.5 msec (Hájos and Mody, 1997). IPSCs at connections between dentate basket cells are even faster (Bartos et al., 2001). Thus, the 5 msec time constant that we use is probably a reasonable compromise. A dendrite-contacting interneuronal IPSC peaked at 0.2 nS and then decayed exponentially with time constant 50 msec. Thus, the maximum GABAA conductance that an interneuron can receive is 20 × 2.0 nS + 40 × 0.2 nS = 48 nS. (To put this number in context, the peak delayed rectifier K+ conductance that can develop on the soma is ∼14 nS.) Axon conduction velocity was 0.2 mm/msec.
Fig. 1.

Model structure. The network array has four layers of 96 interneurons each, spanning a 1.92 mm extent along stratum pyramidale of the CA1 in vitro hippocampal region, as byTraub et al. (1999). Single interneurons are modeled as multicompartment (axon plus soma plus dendrites) objects, as by Traub and Miles (1995). There are 96 basket cells, 96 axo-axonic cells, and 192 dendrite-contacting cells. Each interneuron (for example,Index cell) receives synaptic GABAAreceptor-mediated input onto its dendrites, from 20 basket cells and 40 dendrite-contacting interneurons but not from axo-axonic cells (Buhl et al., 1994b); the small arrows exhibit a possible set of interneurons contacting the Index cell. In addition, each interneuron has dendritic gap junctions with zero, one, two, three, or four (average of 2.0) other interneurons; the black triangles show possible interneurons electrically coupled to the Index cell. Gap junctions can form between pairs of interneurons in the basket cell–axo-axonic cell population or between pairs of dendrite-contacting interneurons. The figure shows below the spatial scales over which connections can form: for chemical synapses, the respective somata must lie within 500 μm of each other, whereas for gap junctions, the respective somata must lie within 200 μm of each other. G.J., Gap junction.
Gap junctions occurred in the network between pairs of interneurons, each of which was either a basket cell or an axo-axonic cell, or between pairs of dendrite-contacting interneurons (Gibson et al., 1999). Gap junctions were located between proximal dendritic compartments, centered 85 μm from the soma, and had a conductance between 0.00 and 2.53 nS. To simplify analysis, all gap junctions in the network, in a given simulation, were assigned an identical conductance. Gap junctions for most cases (with exceptions being specifically noted) were voltage independent and nonrectifying. With our model interneurons, a 1.4 nS dendritic gap junction produced a DC coupling ratio of 0.15, as measured between somata. For comparison, the following estimates of gap junction properties, for pairs of cortical interneurons, have been published: coupling ratio, 0.03–0.41 (mean 0.064) and conductance, 0.66 ± 0.18 nS (Galarreta and Hestrin, 1999); coupling ratio, 0.07 ± 0.06 and conductance, 1.6 ± 1.3 nS (Gibson et al., 1999); coupling ratio, 0.086 ± 0.082 for bipolar interneurons (Venance et al., 2000). For pairs of hippocampal dentate gyrus basket cells, coupling ratios of 0.026 ± 0.018 were found (Venance et al., 2000). We are not aware of similar functional data for electrically coupled CA1 or CA3 hippocampal interneurons [as opposed to anatomical data (Kosaka, 1983; Fukuda and Kosaka, 2000)].
Gap junctions were placed between the dendrites of pairs of interneurons, the pairs being chosen randomly subject to these constraints: (1) the somata must lie within 200 μm (note that the lattice spacing of the array is 20 μm) (Fig. 1); (2) an interneuron could be coupled to zero, one, two, three, or four others, but no more; (3) on average, each interneuron was coupled to two others; and (4) as noted above, gap junctions could occur only between axon- or perisomatic-contacting interneurons or between dendrite-contacting interneurons. In some simulations, each interneuron was coupled to an average of eight other interneurons. In a given network simulation, all gap junctions had the same conductance. Note that the maximum possible gap junction conductance in an interneuron is 4 × 2.53 nS = 10.12 nS, or ∼20% of the maximum possible GABAA conductance; in a typical simulation with a single gap junction conductance of 1 nS, the average total gap junction conductance in an interneuron is 2 nS.
Figure 2 illustrates an example of the simulated behavior of a pair of interneurons, when cell 1 produces a compound GABAA receptor-mediated IPSC in cell 2 (2 nS with decay τ = 5 msec; 0.2 nS with decay τ = 50 msec), and both cells are electrically coupled by a dendritic gap junction (0.7 nS). Cell 1 was forced to fire at 20 Hz with brief current pulses. The gap junction is then responsible for a spikelet in cell 2 (∼0.4 mV), coincident with the spike in cell 1, and the gap junction produces an apparent increase in the IPSP in cell 2 via coupling of the spike afterhyperpolarization of cell 1 to cell 2.
Fig. 2.

Example of combined chemical synaptic and gap junction connection between a pair of model interneurons. Top left, Schematic of the interactions. Cell 1 produces a sum of two GABAA receptor-mediated IPSCs in the soma of cell 2 (peak conductance of 2 nS, decay time constant of 5 msec; and peak conductance of 0.2 nS, decay time constant of 50 msec; each with reversal potential −15 mV relative to resting potential). The cells are also connected by a nonrectifying gap junction in the proximal dendrites of each cell (85 μm from the soma, conductance of 0.7 nS).Bottom, Both cells were held with −0.05 nA tonic currents, whereas cell 1 was induced to fire (▴) with current pulses delivered every 50 msec, inducing rhythmic IPSPs in cell 2.Traces are superimposed for cases when the gap junction was either open or shut. (Data shown correspond to the fifth and sixth spikes in a train in cell 1.) The gap junction has two effects on the potential in cell 2; cell 2 is relatively hyperpolarized for most of the cycle (attributable to gap junctional communication of the afterhyperpolarization in cell 1), and cell 2 develops a ∼0.4 mV spikelet (coupling potential) in association with the spike of cell 1.Top right, Detail of the spikelet. Thick line, Gap junction closed. Thin line, Gap junction open. Compare Galarreta and Hestrin (1999) with Gibson et al. (1999).
In some simulations, the conductance of gap junctions was voltage dependent, specified in a manner to provide physical intuition rather than determined by biological data; that is, it might be arranged that gap junctions conduct only if one or the other side of each respective gap junction is depolarized >10 mV from rest (as would happen if one of the cells fires). This was done to study the synchronizing effects produced by spikelets. Alternatively, it might be arranged that gap junctions conduct only when the voltage on each side of a junction is depolarized <10 mV from rest. This was done to study the synchronizing effects of the conductance of slow potentials.
To evoke interneuron network gamma (ING), the interneurons were stimulated with tonic depolarizing currents, 0.2–0.225 nA. In most cases, the amplitudes of the driving currents were distributed in a linear gradient along the long axis of the array (Fig. 1), although spatially random distributions were sometimes used as well. (A linear gradient corresponds approximately to the experimental situation in which a solution is puffed onto the slice. A random distribution of driving currents may correspond to the situation in which a drug is present in the bath.) We deliberately used a large degree of heterogeneity (12.5%) in the driving currents, which, together with the spatial extensiveness of the array, would favor gamma oscillations that were not globally synchronized, at least in the absence of gap junctions (Wang and Buzsáki, 1996; White et al., 1998). The 12.5% spread in driving current corresponds, however, to only a 5% difference in network frequency (36.2 vs 38.1 Hz), comparing cases when the interneurons all received the same drive (either 0.2 or 0.225 nA) with 1.05 nS gap junction conductances present. The spread of driving currents of 0.2–0.225 nA corresponded to intrinsic firing frequencies of 82.1 to 93.6 Hz, under conditions when the model interneurons were uncoupled both synaptically and electrically.
To examine transient coupling potentials, three of the interneurons were held hyperpolarized (−0.10, −0.15, and −0.20 nA tonic currents). Noise was present in the system in the form of ectopic axonal activity: brief current pulses delivered to the most distal axonal compartments, capable of spike initiation if the cell was not too hyperpolarized, at a mean frequency of 2 Hz per axon. (This noise also adds to the heterogeneity of the interneuron stimulation.) For gamma oscillations to be present at all, it was necessary to have IPSCs; that is, tonic depolarization plus dendritic gap junctions alone did not lead to a population gamma rhythm (data not shown).
Simulation analysis methods. To illustrate and analyze the simulations, several types of plots and signals were used: (1) raster plots of somatic spikes of a subpopulation of interneurons (e.g., the basket cells); (2) the average somatic potential of 28 nearby cells, and autocorrelations and cross-correlations of such signals selected from opposite ends of the array; (3) superimposed somatic potentials of five nearby interneurons; and (4) the signal T, the total number of spiking distal axons of some selected group of interneurons (e.g., all of the cells, or the basket cells plus axo-axonic cells).
The signal T provides a measure of spatial synchrony in the global oscillating network. As groups of cells shift phase with respect to each other, the peaks of T become smaller and broader, and T has a less rhythmic appearance. This can be quantitated by using the amplitude of the first side peak in the autocorrelation of T (constructed from the last 500 msec of data in a 1000 msec simulation) and then normalizing by dividing by the square of the time average of T. This normalized amplitude constitutes the “synchronization” measure used in the graphs of Figure 5.
Fig. 5.
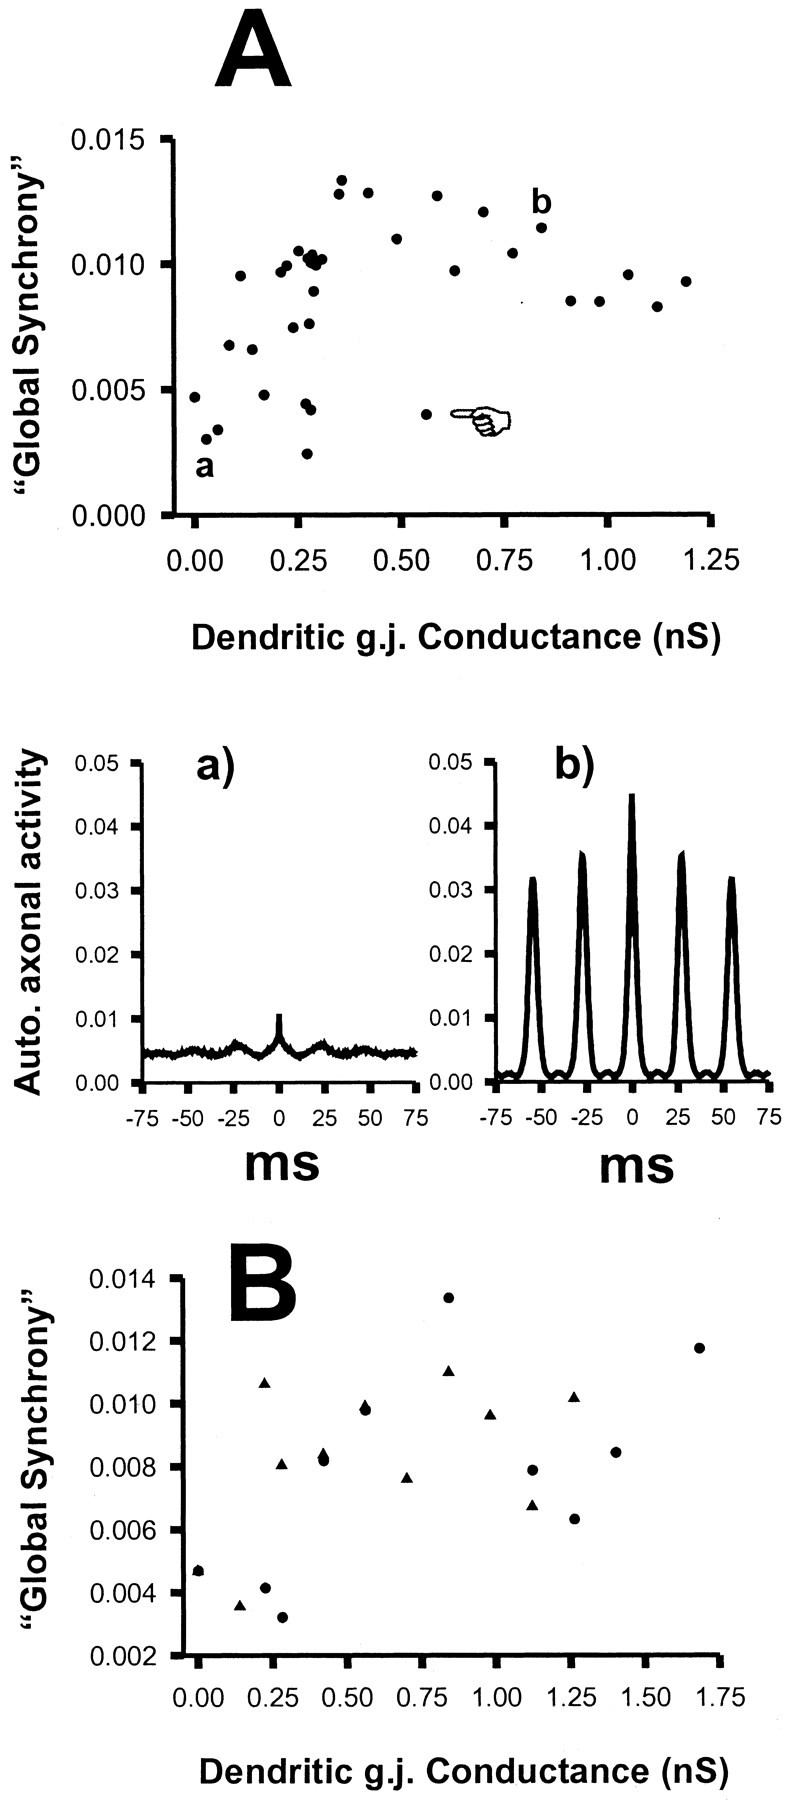
Dependence of global network synchronization on dendritic gap junction (g.j.) conductance. Global synchrony was quantitated by computing the autocorrelation of the signal representing total axonal activity (as at thebottom of Fig. 3; 500 msec of data used), taking the amplitude of the first positive side peak and normalizing by dividing by [average activity]2. (Examples of such autocorrelations are shown in Aa and Ab.)A, There are two categories of synchronization. With dendritic gap junction conductance <0.31 nS, the global synchrony is <0.105, fluctuating widely for small changes in conductance, but on average the global synchrony is small (average of 0.00736 ± 0.00276; median of 0.00761; n = 21). With dendritic gap junction conductance >0.35 nS, the synchrony is uniformly large (with the exception of one outlying point, indicated withhand) (average of 0.01028 ± 0.00235; median of 0.01041; n = 15). The difference in synchrony between the two categories is significant (p< 0.007; Mann–Whitney rank sum test). Aa,Ab, Example autocorrelations of axonal activity, corresponding to points a and b in the plot. B, Simulations were run as in A but with gap junctions only open when each dendritic voltage was <10 mV relative to rest (▴), hence communicating subthreshold potentials, or open only when one or the other dendritic voltage was >10 mV relative to rest (●), hence communicating suprathreshold potentials. Communication of either subthreshold, or of suprathreshold, potentials can induce synchrony if the gap junction conductance is more than ∼0.35 nS.
The code for simulations was written in FORTRAN, augmented with instructions for a parallel operating environment; programs were run on a 12-node IBM SP2 parallel computer. Simulation of 1000 msec of interneuron network activity took ∼1.3 hr. (For details on programming, please contact the corresponding author.)
Slice electrophysiology. Adult male Wistar rats (∼150–200 gm) were anesthetized with inhaled isoflurane followed by injection of ketamine (100 mg/kg, i.m.) and xylazine (10 mg/kg, i.m.). After the abolition of all pain reflexes, the animals were perfused intracardially with ∼50 ml of modified artificial CSF (ACSF), which was composed of (in mm): 252 sucrose, 3.0 KCl, 1.25 NaH2PO4, 24 NaHCO3, 2.0 MgSO4, 2.0 CaCl2, and 10 glucose. After brain removal, 450-μm-thick horizontal slices were cut and then maintained at room temperature, at the interface between normal ACSF (in which sucrose was replaced with 126 mm NaCl) and humidified 95% O2–5% CO2. For recording, hippocampal slices were transferred to an interface chamber at 34–35°C. Drugs were bicuculline methiodide (20 μm; Tocris Cookson, Bristol, UK), carbenoxolone (0.1–0.2 mm; Sigma, Poole, UK), 2,3,-dioxo-6-nitro-1,2,3,4-tetrahydrobenzo[f]quinoxaline-7-sulfonamide disodium (NBQX) (20 μm; Tocris Cookson),d(−)-2-amino-5-phosphonopentanoic acid (d-AP-5) (50–100 μm; Tocris Cookson), (3-((R)-2-carboyxpiperazin-4-yl)-propyl-1-phosphonic acid (R-CPP) (20 μm; Tocris Cookson), 2-hydroxysaclofen (0.2 mm; Tocris Cookson), and ((S)-3,5,dihydroxyphenylglycine) (DHPG) (100–200 μm; Tocris Cookson).
To evoke oscillations with hypertonic potassium solution, extracellular recording electrodes were filled with ACSF (resistance of 2–5 MΩ) and placed in stratum radiatum of the CA3 region. Pressure application of potassium solution (1.5 m potassium methylsulfate) was performed with glass pipettes using a Picospritzer (World Precision Instruments, Sarasota, FL) (∼60 psi, duration of 3–60 msec) (F. E. N. LeBeau, S. K. Towers, R. D. Traub, M. A. Whittington, and E. H. Buhl, unpublished observations). Data were recorded with an Axoprobe-1A amplifier (Axon Instruments, Foster City, CA) and recorded on computer via an ITC-16 interface (Digitimer, Hertfordshire, UK). Data were acquired from four slices in both control conditions and after >60 min perfusion with carbenoxolone. Analysis was performed using Axograph software (Axon Instruments).
To study IPSC trains, gamma oscillations were evoked by brief pressure ejection (60 psi, 4 msec) of 1 mm glutamate onto stratum pyramidale of CA1, with ionotropic glutamate and GABAB receptors blocked by bath application of NBQX (10 μm), R-CPP (20 μm), and 2-hydroxysaclofen (0.2 mm). CA1 pyramidal cells were impaled with sharp electrodes (resistance of 35–60 MΩ) filled with 2m potassium acetate and 50 mm QX314. Cells were voltage clamped with holding potential of −30 mV.
To study a more spatially distributed form of network gamma than can be achieved by pressure ejection, the group I metabotropic glutamate receptor agonist DHPG (0.1–0.2 mm) was bath applied in the presence of NBQX (10 μm). Field potentials were recorded from stratum pyramidale and bandpass filtered at 30–90 Hz.
RESULTS
Dendritic gap junctions enhance synchrony of interneurons participating in IPSP-dependent ING: simulations
Figure 3 illustrates raster plots of the 96 basket cells (which are distributed along the entire length of the array) for ING under two different simulation conditions: with interneuron dendritic gap junctions open, having conductance of 1.12 nS (left); and with the gap junctions closed (right). Shown below, on the same time scale and in register, are the total number of basket cell and axo-axonic cell axons firing (distal compartment >70 mV relative to rest). Both the raster plots and the graphs below convey a similar qualitative impression: that spatial synchrony is “tighter” with interneuron gap junctions open. (The dependence of this behavior on parameters will be explored below.) The data from Figure 3, with gap junctions closed, indicate that, on average, ING exists but that the length of clusters that are synchronized to within 1 msec or so is not as long as when the gap junctions are open; in addition, when gap junctions are closed, the lengths of the clusters fluctuate in time. It is as if groups of interneurons are continually separating into “islands” of synchronized cells, in a temporally unstable manner. Note as well that, in the raster on the right of Figure 3 (gap junctions closed), in regions of the array that are not synchronized, activity can take the form of locally propagating waves (e.g., at the site marked by the small arrow). This local propagation might be considered to result from the spatial gradient of driving currents to the interneurons (see Materials and Methods), but this cannot be so: similar locally propagating waves were seen also when the driving currents were spatially random (data not shown).
Fig. 3.
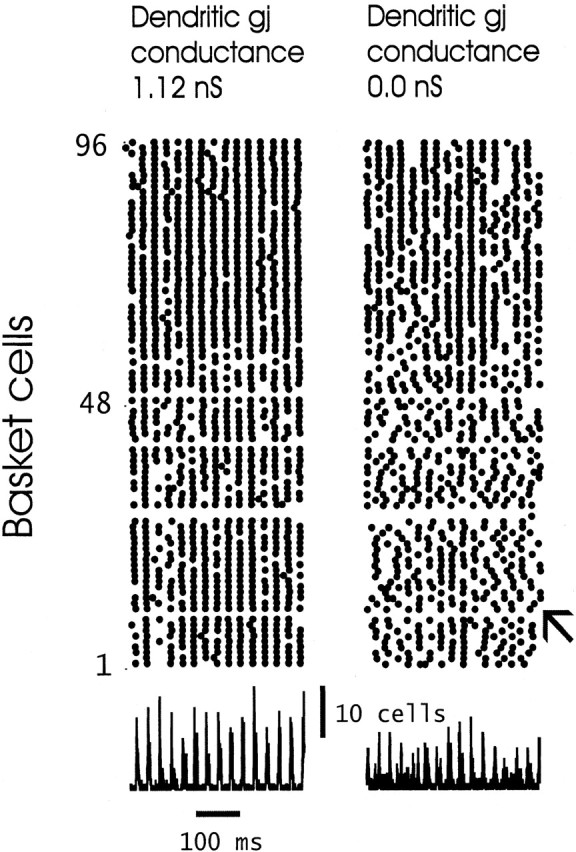
Dendritic gap junctions enhance the global synchrony of interneuron network gamma. The top plotsare rasters of the firing times of the 96 basket cells, over a 500 msec time interval, for a case in which the dendritic gap junctions are open (1.12 nS conductance; left) or closed (0.0 nS conductance; right). Time is represented on thehorizontal axis, and position in the array is represented along the vertical axis (see Fig. 1); adot signifies that the soma of the respective interneuron is depolarized >60 mV at the respective time. Thesmall arrow, in the raster on the right, marks one of a number of sites in which the activity resembles a locally propagating wave. The traces below, on the same time scale, are the total number of basket cell and axo-axonic cell axons depolarized >70 mV; this is one means of quantitating global synchrony in the distributed network. (Three of the basket cells are hyperpolarized with tonic currents and do not fire.) gj, Gap junction.
The basic result of Figure 3 was repeated with a large number of values of the gap junction conductance (see below). In addition, using a value of this conductance of 1.052 nS (which gives results comparable with Fig. 3), we repeated the simulations with variations of other parameters. Gap junctions clearly enhanced coherence under the following conditions: (1) when the fast time constant of GABAA IPSC was 10 msec rather than 5 msec (although, as expected, the oscillation slowed from 36.7 to 34.5 Hz); (2) the spread in driving currents was doubled to a range of 0.20–0.25 nA rather than 0.20–0.225 nA; (3) when the driving currents to the interneurons were randomly distributed in space; and (4) when there were an average of eight gap junctions per interneuron instead of two (data not shown).
Figure 4 illustrates two additional means of visualizing the network effects of interneuron dendritic gap junctions. The top two panels each show superimposed somatic potentials from five nearby basket cells, chosen to lie near the center of the array. When the gap junctional conductance is “large” (1.05 nS; left), the potentials are almost precisely in register, even when, as sometimes happens, an interneuron fails to spike on a particular cycle. On the other hand, when the gap junction conductance is “small” (0.03 nS; right), then it is difficult to recognize population rhythmicity at all, at least from the signals illustrated. The bottom two panels of Figure 4 illustrate an aspect of the local average behavior. To do this, local averages were taken of the somatic potentials of 28 nearby interneurons, taken at two sites, one near either end of the array; autocorrelations and cross-correlations were then calculated from 500 msec of such data. With the large value of the gap junction conductance (left), the rhythmicity and relative long-range synchrony are obvious (the peak of the cross-correlation is at −3.4 msec). With the small value of the gap junction conductance (right), the local average signal is barely rhythmic. This is true despite the small local variation in driving conductances to the different neurons [although global variation in driving conductance is large (see Materials and Methods)]. Nearby cells have similar driving conductances, because the conductances are distributed in a gradient along the long axis of the array (see Materials and Methods).
Fig. 4.
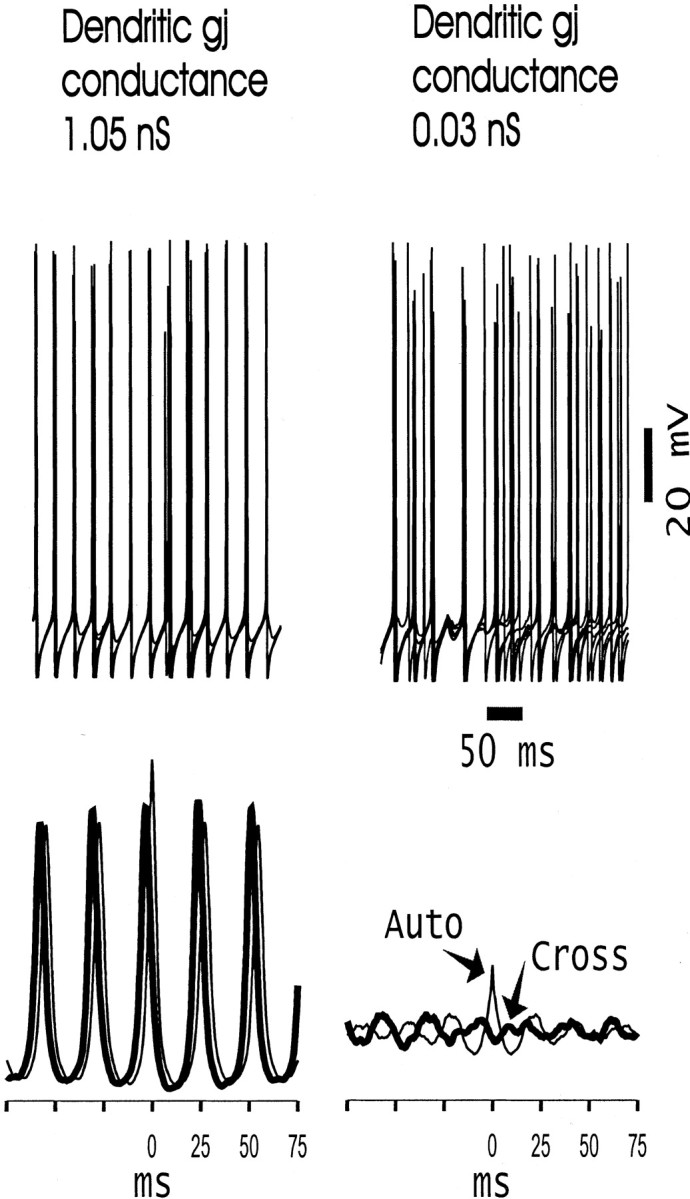
Alternative means of viewing synchronization in the interneuron network. The top traces show superimposed somatic voltages of five nearby basket cells, in the middle of the array, for cases in which the dendritic gap junctions are open (1.05 nS conductance; left) or nearly shut (0.03 nS conductance; right). Traces below are autocorrelations (thin lines; Auto) and cross-correlations (thick lines; Cross) of average somatic signals (28 nearby interneurons, 500 msec of data) taken from either end of the array. The horizontal axisof these traces is in milliseconds, and thevertical axes are the same in each case.gj, Gap junction.
The simulation with 0.03 nS gap junction was repeated but with the value of unitary IPSCs increased by 25%; this produced only a marginal enhancement of long-range synchronization (data not shown). Thus, increasing GABAA synaptic conductances does not compensate, in the network being modeled, for the absence of a sufficient gap junctional conductance.
Effects of interneuron dendritic gap junctions on ING synchrony depend on the conductance; synchronization and desynchronization have different time courses: simulations
Figure 5 provides insight into how synchronization in this system depends on the conductance of the interneuron dendritic gap junctions. In A, we plot the “global synchrony” [see Materials and Methods, Simulation analysis methods (4)] in the last 500 msec of 1000 msec runs, for 36 values of the dendritic gap junction conductance. With the exception of a single outlying point (indicated in the graph), the synchrony falls into two obvious categories: when the gap junction conductance is small (<0.31 nS), synchrony is also small on average, although there are fluctuations for small changes in the conductance. [These fluctuations probably reflect the long time that the system can take to settle into a desynchronized state (Fig. 6)]. On the other hand, when the gap junction conductance is large (>0.35 nS), the average value of the synchrony is also large. The difference between average synchrony in the two categories is highly significant statistically (details are given in the figure legend). Figure 5,Aa and Ab, shows two examples of the data from which the global synchrony was calculated: autocorrelations of the total axonal activity (the signal T defined in Materials and Methods), for two different values of the gap junction conductance, at the points marked a and b in the top graph.
Fig. 6.

Difference in time course of synchronization versus desynchronization after conductance change of dendritic gap junctions (g.j.). Three-second simulations were run in which the conductance of dendritic gap junctions, throughout the network, was abruptly switched from one value to another (vertical arrows; Switch). In each case, we plot the number of depolarized interneuron axons as a function of time to give a sense of global synchrony. Simulations begin with uniform values of membrane potentials and state variables so that the network begins in a highly synchronized state. A, The initial value of the gap junction conductance is small (0.14 nS). The system begins synchronously and relaxes to a low level of synchrony over ∼1 sec; this low level then persists. On switching to a high value of the gap junction conductance (1.12 nS), the system attains a high level of synchrony within four cycles, only ∼100 msec.B, Here the initial value of the gap junction conductance is large (1.12 nS). Synchrony is stably high. After switching abruptly to a low gap junction conductance (0.14 nS), the system remains synchronized for over 1 sec before relaxing to a desynchronized state.
In Figure 5B, we plot the global synchrony again for different values of the dendritic gap junction conductance but with constraints placed on the behavior of the gap junctions. The ▴points correspond to simulations in which each gap junction conducts only when the voltages on either side of it are both <10 mV depolarized from rest (that is, approximately, only subthreshold activity is transmitted across the gap junctions); and the ●points correspond to simulations in which each gap junction conducts only if one or the other voltage on either side is depolarized >10 mV from rest (that is, suprathreshold activity is transmitted across the gap junctions). In each case, the behavior falls into two categories (low synchrony and high synchrony), separated by a threshold conductance of ∼0.3 nS, as in Figure 5A. These data indicate that both subthreshold and suprathreshold activity contribute to global synchrony.
We were interested in the time course of settling into an equilibrium state and how the system would alter its behavior if the conductance of the gap junctions was to be abruptly changed. Because of the uniform initial conditions, the initial behavior of our simulated networks is synchronized, at least transiently, no matter what the gap junction conductance. Figure 6A shows that with a small value of the conductance, the system can take as long as ∼1 sec to settle from the initial “transient” behavior into a desynchronized state. On the other hand, abruptly increasing the gap junction conductance leads to the development of synchrony over just a few cycles. Figure6B provides additional confirmation of the behavior indicated at the start of Figure 6A. In Figure6B, the system runs synchronously with a large gap junction conductance for 1 sec, and then the gap junction conductance was decreased abruptly to a small value. In this case, the system continues to oscillate synchronously for over 1 sec before settling into its desynchronized state.
A possible clue to the difference in transient dynamics, after a switch, is given by the wave-like behavior seen in local areas of the network in Figure 3. Such wave-like behavior is known to appear in networks in which there is a gradient in either natural frequency or local connections (Cohen et al., 1982; Kopell, 1987). Many of our simulations have gradients in natural frequency, and all have topological structure in the coupling, which may be the cause of the local waves. In a part of the network in which the behavior is wave-like, the phases of the oscillation are spread out in time; because the coupling current of gap junctions increases with the difference in the voltages of the coupled cells (Chow and Kopell, 2000), this situation enhances the effects of gap junctions on the creation of fast synchrony. In contrast, when the cells are almost synchronized, the voltage differences between the cells are small, so the gap junctional coupling is also small. The network is then held together by the inhibitory coupling, which has maximal effect when the cells are synchronized. The transition from the coherent state to the disorganized one, when the gap junctional coupling is abruptly switched, displays a slow drift away from the coherent state, likely attributable to noise, until the inhibitory coupling signals are no longer coherent enough to keep the network together.
Effects of interneuron dendritic gap junctions on compound GABAA conductances in an index cell: simulation
The phenomena illustrated so far (raster plots, superimpositions of five interneurons, average axonal activity, etc.) should give the reader a feel for the qualitative physical behavior of the network being simulated; however, these phenomena are difficult to access experimentally in a slice. To make a more direct connection between simulation and experiment, we examined in the model network the total GABAA conductance in a single index cell, a basket cell, in simulations run with different values of the interneuron dendritic gap junction conductance. Figure7 shows an example of the clear difference in the amplitude and rhythmicity of this signal, observed when comparing cases with large (1.12 nS) or small (0.03 nS) gap junctional conductances.
Fig. 7.

Synaptic conductance to a single neuron: another measure of global synchrony. The figure shows the total GABAA conductance in a single basket cell for two simulations: with dendritic gap junction (g.j.) conductance 1.12 nS (top) and with the dendritic gap junction conductance 0.03 nS (bottom). Raw data are on the left; normalized autocorrelations of 500 msec of data are on the right. With the lower gap junction conductance, the peaks of the induced synaptic conductance are both smaller and less regular.
The gap junction blocker carbenoxolone reduces the synchrony of interneuron network gamma evoked by puffing hypertonic K+ solution, by puffing glutamate, or by DHPG in the bath
The effects of interneuron gap junctions on gamma oscillation synchrony were examined in three experimental protocols. In each of the protocols, the gamma oscillation depends on IPSPs (Whittington et al., 1995; Traub et al., 1996a; LeBeau et al., 2000) (M. Gillies and M. A. Whittington, unpublished data.) The first protocol consisted of evoking interneuron network gamma with hypertonic K+ solution (1.5 m), in the presence of blockers of ionotropic glutamate receptors (see Materials and Methods). (This experimental arrangement is expected to produce a spatial gradient of neuronal excitability, partly analogous to the gradient in driving conductance used in most of the simulations.) In control conditions (Fig. 8), puffing on the potassium solution evoked gamma-frequency oscillations that lasted >1 sec and that (as judged by the autocorrelation of the field-potential signal) were highly rhythmic. In four of four slices, carbenoxolone in the bath (0.1–0.2 m, >60 min) caused a reduction in power and rhythmicity of interneuron network gamma, without abolishing the oscillation. Carbenoxolone appears to have minimal effects on the intrinsic properties of hippocampal neurons, at least principal cells (Schmitz et al., 2001). In one experiment (data not shown), carbenoxolone was washed out of the bathing medium for 1 hr, and full recovery of the power and rhythmicity of the oscillation occurred. It should be noted that, in the hypertonic K+ protocol, pyramidal cells fire rarely (LeBeau, Towers, Traub, Whittington, and Buhl, unpublished observations), so that population spikes are unlikely to contribute to the recorded field potentials.
Fig. 8.

The gap junction-blocking compound carbenoxolone disrupts but does not abolish interneuron network gamma.A, Top traces are examples showing 1 sec of field potential oscillations after pressure ejection of 1.5m potassium solution to area CA3 stratum radiatum, with ionotropic glutamate receptors blocked (20 μm NBQX; 50 μm d-AP-5). Left panel shows control data, and right panel shows data obtained in the presence of 0.2 mm carbenoxolone in the bathing medium. Calibration: 0.2 mV, 200 msec. Bottom traces are pooled autocorrelation data of field potential oscillations from three slices showing disruption of rhythmicity in the presence of 0.1–0.2 mm carbenoxolone. B, Top traces are examples showing 0.5 sec epochs of IPSCs (in a pyramidal cell) during gamma oscillations evoked by pressure ejection of glutamate in CA1 stratum pyramidale, with ionotropic glutamate and GABAB receptors pharmacologically blocked (see Materials and Methods). Control is on the left, and after wash in of carbenoxolone is on the right. Bottom traces are autocorrelations from 1 sec epochs of pooled data (n = 5 in each case). Calibration: 0.3 nA, 200 msec. C, Global ING was evoked by bath application of DHPG and NBQX (see Materials and Methods). Top tracesare examples of field potentials from CA1 stratum pyramidale, bandpass filtered at 30–90 Hz. Lower traces are autocorrelations from 1 sec epochs of data. Calibration: 0.1 mV, 200 msec. Carbenoxolone disrupts the rhythmicity of interneuron network gamma in all three experimental protocols.
In the second protocol, interneuron network gamma was evoked by pressure ejection of glutamate in CA1 stratum pyramidale during pharmacological blockade of ionotropic glutamate and GABAB receptors, whereas IPSC trains were recorded in a pyramidal cell held at −30 mV (see Materials and Methods) (compare with Traub et al., 1996a). Figure8B again shows that carbenoxolone disrupts IPSC rhythmicity, without abolishing the oscillation entirely. These data are qualitatively similar to the simulation data in Figure 7, although in the latter case, it is interneuron IPSC trains that are illustrated.
In the third protocol, interneuron network gamma was evoked by bath application of the group I metabotropic glutamate receptor agonist DHPG along with NBQX (see Materials and Methods) so as to evoke oscillations on a larger spatial scale than obtainable by pressure ejection. In this case as well (Fig. 8C), oscillation rhythmicity (even as measured with local field potentials) is disrupted by carbenoxolone. Note that the raster plot in Figure 3 (and comparable plots with spatially random driving currents) show that oscillations (at least for many oscillation periods) are disrupted both locally and globally when gap junctions are blocked. In DHPG as well, pyramidal cells fire infrequently (Gillies and Whittington, unpublished observations.)
DISCUSSION
An hypothesis on the biological significance of interneuron dendritic gap junctions
Cortical and hippocampal interneuronal networks can, by virtue of mutual inhibitory chemical synaptic connections, generate gamma-frequency network oscillations when the neurons are tonically depolarized (Whittington et al., 1995; Traub et al., 1996a), so-called interneuron network gamma. This mechanism may underlie, or at least contribute to, certain types of in vivo gamma activity, including the gamma superimposed on theta waves in the rat hippocampus as, in this latter case, pyramidal cells fire at low frequency, and the oscillations appear to be generated primarily by interneurons (Soltesz and Deschênes, 1993; Sik et al., 1995; Penttonen et al., 1998). There have been concerns, however, about the relevance of ING to any form of in vivo gamma, however, for two main reasons. First, models of ING possess considerable sensitivity of their oscillation stability to dispersion in excitabilities of the interneurons, the so-called heterogeneity issue, and, indeed, it appears that heterogeneity must be extremely limited for ING to occur, at least in theoretical–simulation models containing synaptic inhibition but lacking gap junctions (Wang and Buzsáki, 1996; White et al., 1998). Second, there were experimental and theoretical concerns that ING might not be capable of synchronizing over more than 1 or 2 mm, at least in certain protocols in the hippocampal slice (Whittington et al., 1997; Traub et al., 1999b). The distance scale over which gamma oscillations might be expected to synchronize in the in vivohippocampus, along the dentate hilus, is ∼2 mm at least (Bragin et al., 1995).
The data in the present study suggest, however, that neither the heterogeneity problem nor the long-range synchrony problem need be germane for ING if interneurons are interconnected by dendritic gap junctions, in addition to chemical inhibitory synapses. Note that, in our simulations, we used a spread of driving currents of 12.5% and used an array almost 2 mm long, and yet global synchronization was still observed, even for relatively low gap junction conductances, provided that the latter were above some threshold (Fig. 3). In addition, the number of gap junctions used in the model was quite small, averaging only two per neuron. The existence of interneuron dendritic gap junctions in hippocampus and cortex is supported by considerable direct evidence, including ultrastructure and dual simultaneous interneuronal recordings (Kosaka, 1983; Galarreta and Hestrin, 1999; Gibson et al., 1999; Fukuda and Kosaka, 2000;Tamás et al., 2000).
Interestingly, in simulations in which there was no spatial structure to the interconnectivity (random synaptic and gap junctional connectivity but other parameters as usual), then coherence occurred equally well with large (1.05 nS) or small (0.03 nS) gap junction conductance and was comparable with the situation in a distributed network with a large gap junction conductance (data not shown). Apparently, it is the spatial characteristics of the connectivity (i.e., the limited mean spread of the axons and dendrites) that creates a situation wherein dendritic gap junctions enhance the coherence: spatially structured networks are more sensitive to heterogeneity effects than are random networks. Indeed, a number of previous models of ING in spatially random networks have demonstrated coherence of the oscillation without a requirement for gap junctions (Traub et al., 1996a; Wang and Buzsáki, 1996; White et al., 1998; Bartos et al., 2001).
We do not suggest that stabilization–synchrony enhancement of ING is the only function that interneuron dendritic gap junctions might subserve. Thus, for example, electrical coupling between low-threshold spiking cortical interneurons could contribute to synchronized inhibition developing at frequencies of ∼5 Hz, i.e., much lower than gamma frequency (Beierlein et al., 2000). The metabotropically activated oscillations studied by Beierlein et al. (2000) differed from interneuron network gamma in that the former do not require GABAA receptors, whereas ING, by definition, does require them. The LTS cells recorded by Beierlein et al. (2000) exhibit bursts during the oscillations, and hyperpolarized LTS neurons show several millivolt depolarizing waves lasting ∼200 msec, a phenomenon not seen in ING. Interestingly, the spatial scale over which synchrony occurs, in the LTS 3–5 Hz oscillation, extends some hundreds of micrometers, perhaps a reflection of the distance scale over which dendritic gap junctions can couple interneurons.
The model yields enhanced ING synchrony with a gap junction conductance agreeing with measurements in cortex
The model suggests that enhanced ING synchrony, in networks with two gap junctions per neuron on average, could be obtained with gap junction conductances in the range of ∼0.5–1.5 nS (Fig. 5). This estimate compares well with experimental estimates derived from electrically coupled pairs of cortical interneurons: 0.66 ± 0.18 nS (Galarreta and Hestrin, 1999) and 1.6 ± 1.3 nS (Gibson et al., 1999).
Note that gap junctions in the model have an obvious effect on oscillation coherence, even when there are only an average of two gap junctions per interneuron. Electrical coupling between nearby interneurons, in experiments, occurs with rather high probability, with estimates of this probability including the following: for dentate basket cells, 82% (Venance et al., 2000) and 29% (Bartos et al., 2001); and for fast-spiking cortical interneurons, 66% (somata <80 μm apart) (Galarreta and Hestrin, 1999) and 62% (Gibson et al., 1999). Extrapolating the average number of gap junctions per interneuron, from such data, is not straightforward because this number depends on the layout of the neurons in space and on the distance between somata for which a junction may or may not occur. To see this, consider a Gedanken experiment: imagine a set of interneurons arranged in a line, with each cell coupled to the cell on its left and also to the cell on its right. The probability that adjacent neurons are coupled is high, 100%; on the other hand, each neuron is coupled to only two others (except at the ends of the line). Increasing the number of gap junctions in our model, to an average of eight per neuron, provides an even larger enhancing effect on synchrony than does an average of two per neuron; this suggests that the density of gap junctions is not a critical parameter for the observed effect, provided this density is above some threshold value.
Comparison of predicted effects of interneuron dendritic gap junctions vis-à-vis interneuron axonal gap junctions: weak coupling versus strong coupling
The effects proposed here for dendritic gap junctions (enhancement of the synchrony of underlying oscillation) should not be confused with the effects we proposed for axonal gap junctions (Traub et al., 1999a,2000, 2001; Traub and Bibbig, 2000; Schmitz et al., 2001). In certain systems that we have studied experimentally and with simulations, action potentials are presumed to cross from one axon to coupled axon; the electrical coupling in such a situation is strong, unlike the weak coupling presumed to exist between interneuron dendrites in this paper. (Weak coupling does not allow spikes to cross.) With strong coupling, entirely new effects appear: networks of electrically coupled cells can generate fast oscillations on their own, without chemical synapses and without strong depolarization of the neurons, although the resulting fast oscillations can be shaped into slower oscillations by chemical synapses should the latter be functional (Traub and Bibbig, 2000; Traub et al., 2000). In a previous model (Traub, 1995) of networks of dendritically coupled interneurons, strong coupling was postulated to occur between dendrites, and the networks could generate autonomous population bursts, without chemical synapses or strong depolarization; the coupling conductance used in that previous model (up to 10 nS) appears to be larger, however, than exists biologically.
Generality of results
The experimental underpinnings of this study derive from hippocampus and neocortex. We suspect, however, that the physical principles should apply to any network of fast-spiking interneurons, mutually interconnected by both inhibitory synapses and by gap junctions. One possible structure to examine is the nucleus reticularis thalami, under conditions when neurons are depolarized enough to inactivate T-channels; these neurons exhibit mutual synaptic inhibition (Zhang et al., 1997) and gap junctions (Landisman et al., 2000). Additional theoretical work, with simplified and reduced models, will be required to better understand the mathematical–physical principles underlying the effects of gap junctions on network behavior and, in particular, why there appears to be a threshold effect for the gap junction conductance (Fig. 5).
Footnotes
This work was supported by the Wellcome Trust, the National Science Foundation, National Institutes of Health Grant MH47150 (to N.K.), and Medical Research Council (United Kingdom) Program Grant G9901235. R.D.T. was a Wellcome Principal Research Fellow.
In memory of Dr. Philip E. Seiden.
Correspondence should be addressed to Dr. Roger D. Traub, Department of Physiology and Pharmacology, State University of New York Health Sciences Center, Brooklyn, NY 11203. E-mail:rtraub@netmail.hscbklyn.edu.
REFERENCES
- 1.Bartos M, Vida I, Frotscher F, Geiger JRP, Jonas P. Rapid signaling at inhibitory synapses in a dentate gyrus interneuron network. J Neurosci. 2001;21:2687–2698. doi: 10.1523/JNEUROSCI.21-08-02687.2001. [DOI] [PMC free article] [PubMed] [Google Scholar]
- 2.Beierlein M, Gibson JR, Connors BW. A network of electrically coupled interneurons drives synchronized inhibition in neocortex. Nat Neurosci. 2000;3:904–910. doi: 10.1038/78809. [DOI] [PubMed] [Google Scholar]
- 3.Bragin A, Jandó G, Nádasdy Z, Hetke J, Wise K, Buzsáki G. Gamma (40–100 Hz) oscillation in the hippocampus of the behaving rat. J Neurosci. 1995;15:47–60. doi: 10.1523/JNEUROSCI.15-01-00047.1995. [DOI] [PMC free article] [PubMed] [Google Scholar]
- 4.Buhl EH, Halasy K, Somogyi P. Diverse sources of hippocampal unitary inhibitory postsynaptic potentials and the number of synaptic release sites. Nature. 1994a;368:823–828. doi: 10.1038/368823a0. [DOI] [PubMed] [Google Scholar]
- 5.Buhl EH, Han Z-S, Lörinczi Z, Stezhka VV, Karnup SV, Somogyi P. Physiological properties of anatomically identified axo-axonic cells in the rat hippocampus. J Neurophysiol. 1994b;71:1289–1307. doi: 10.1152/jn.1994.71.4.1289. [DOI] [PubMed] [Google Scholar]
- 6.Buhl EH, Szilágyi T, Halasy K, Somogyi P. Physiological properties of anatomically identified basket and bistratified cells in the CA1 area of the rat hippocampus in vitro. Hippocampus. 1996;6:294–305. doi: 10.1002/(SICI)1098-1063(1996)6:3<294::AID-HIPO7>3.0.CO;2-N. [DOI] [PubMed] [Google Scholar]
- 7.Buzsáki G, Chrobak JJ. Temporal structure in spatially organized neuronal ensembles: a role for interneuronal networks. Curr Opin Neurobiol. 1995;5:504–510. doi: 10.1016/0959-4388(95)80012-3. [DOI] [PubMed] [Google Scholar]
- 8.Chow CC, Kopell N. Dynamics of spiking neurons with electrical coupling. Neural Comput. 2000;12:1643–1678. doi: 10.1162/089976600300015295. [DOI] [PubMed] [Google Scholar]
- 9.Cobb SR, Buhl EH, Halasy K, Paulsen O, Somogyi P. Synchronization of neuronal activity in hippocampus by individual GABAergic interneurons. Nature. 1995;378:75–78. doi: 10.1038/378075a0. [DOI] [PubMed] [Google Scholar]
- 10.Cohen AH, Holmes PJ, Rand RH. The nature of the coupling between segmental oscillators of the lamprey spinal generator for locomotion: a mathematical model. J Math Biol. 1982;13:345–369. doi: 10.1007/BF00276069. [DOI] [PubMed] [Google Scholar]
- 11.Ermentrout GB, Kopell N. Fine structure of neural spiking and synchronization in the presence of conduction delays. Proc Natl Acad Sci USA. 1998;95:1259–1264. doi: 10.1073/pnas.95.3.1259. [DOI] [PMC free article] [PubMed] [Google Scholar]
- 12.Fuchs E, Doheny HC, Faulkner HJ, Caputi A, Traub RD, Bibbig A, Kopell N, Whittington MA, Monyer H. Genetically altered AMPA-type glutamate receptor kinetics in interneurons disrupt long-range synchrony of gamma oscillation. Proc Natl Acad Sci USA. 2001;98:3571–3576. doi: 10.1073/pnas.051631898. [DOI] [PMC free article] [PubMed] [Google Scholar]
- 13.Fukuda T, Kosaka T. Gap junctions linking the dendritic network of GABAergic interneurons in the hippocampus. J Neurosci. 2000;20:1519–1528. doi: 10.1523/JNEUROSCI.20-04-01519.2000. [DOI] [PMC free article] [PubMed] [Google Scholar]
- 14.Galarreta M, Hestrin S. A network of fast-spiking cells in the neocortex connected by electrical synapses. Nature. 1999;402:72–75. doi: 10.1038/47029. [DOI] [PubMed] [Google Scholar]
- 15.Galarreta M, Hestrin S. Spike transmission and synchrony detection in networks of GABAergic interneurons. Science. 2001;292:2295–2299. doi: 10.1126/science.1061395. [DOI] [PubMed] [Google Scholar]
- 16.Gibson JR, Beierlein M, Connors BW. Two networks of electrically coupled inhibitory neurons in neocortex. Nature. 1999;402:75–79. doi: 10.1038/47035. [DOI] [PubMed] [Google Scholar]
- 17.Hájos N, Mody I. Synaptic communication among hippocampal interneurons: properties of spontaneous IPSCs in morphologically identified cells. J Neurosci. 1997;17:8427–8442. doi: 10.1523/JNEUROSCI.17-21-08427.1997. [DOI] [PMC free article] [PubMed] [Google Scholar]
- 18.Kopell N. Toward a theory of modelling central pattern generators. In: Cohen A, Grillner S, Rossignol S, editors. Neural control of rhythmic movements. Wiley; New York: 1987. pp. 369–413. [Google Scholar]
- 19.Kosaka T. Gap junctions between non-pyramidal cell dendrites in the rat hippocampus (CA1 and CA3 regions). Brain Res. 1983;271:157–161. doi: 10.1016/0006-8993(83)91377-x. [DOI] [PubMed] [Google Scholar]
- 20.Landisman CE, Beierlein M, Connors BW. Electrical synapses between thalamic reticular neurons. Soc Neurosci Abstr. 2000;26:308.13. doi: 10.1523/JNEUROSCI.22-03-01002.2002. [DOI] [PMC free article] [PubMed] [Google Scholar]
- 21.LeBeau FEN, Towers SK, Traub RD, Whittington MA, Buhl EH. Fast and ultrafast oscillations in the hippocampus in vitro. Soc Neurosci Abstr. 2000;26:69.12. [Google Scholar]
- 22.Lytton WW, Sejnowski TJ. Simulations of cortical pyramidal neurons synchronized by inhibitory interneurons. J Neurophysiol. 1991;66:1059–1079. doi: 10.1152/jn.1991.66.3.1059. [DOI] [PubMed] [Google Scholar]
- 23.Penttonen M, Kamondi A, Acsády L, Buzsáki G. Gamma frequency oscillation in the hippocampus: intracellular analysis in vivo. Eur J Neurosci. 1998;10:718–728. doi: 10.1046/j.1460-9568.1998.00096.x. [DOI] [PubMed] [Google Scholar]
- 24.Schmitz D, Schuchmann S, Fisahn A, Draguhn A, Buhl EH, Petrasch-Parwez RE, Dermietzel R, Heinemann U, Traub RD. Axo-axonal coupling: a novel mechanism for ultrafast neuronal communication. Neuron. 2001;31:831–840. doi: 10.1016/s0896-6273(01)00410-x. [DOI] [PubMed] [Google Scholar]
- 25.Sik A, Penttonen M, Ylinen A, Buzsáki G. Hippocampal CA1 interneurons: an in vivo intracellular labeling study. J Neurosci. 1995;15:6651–6665. doi: 10.1523/JNEUROSCI.15-10-06651.1995. [DOI] [PMC free article] [PubMed] [Google Scholar]
- 26.Singer W, Gray C. Visual feature integration and the temporal correlation hypothesis. Annu Rev Neurosci. 1995;18:555–586. doi: 10.1146/annurev.ne.18.030195.003011. [DOI] [PubMed] [Google Scholar]
- 27.Soltesz I, Deschênes M. Low- and high-frequency membrane potential oscillations during theta activity in CA1 and CA3 pyramidal neurons of the rat hippocampus under ketamine-xylazine anesthesia. J Neurophysiol. 1993;70:97–116. doi: 10.1152/jn.1993.70.1.97. [DOI] [PubMed] [Google Scholar]
- 28.Tamás G, Buhl EH, Lörincz A, Somogyi P. Proximally targeted GABAergic synapses and gap junctions precisely synchronize cortical interneurons. Nat Neurosci. 2000;3:366–371. doi: 10.1038/73936. [DOI] [PubMed] [Google Scholar]
- 29.Traub RD. Model of synchronized population bursts in electrically coupled interneurons containing active dendritic conductances. J Comput Neurosci. 1995;2:283–289. doi: 10.1007/BF00961440. [DOI] [PubMed] [Google Scholar]
- 30.Traub RD, Bibbig A. A model of high-frequency ripples in the hippocampus, based on synaptic coupling plus axon-axon gap junctions between pyramidal neurons. J Neurosci. 2000;20:2086–2093. doi: 10.1523/JNEUROSCI.20-06-02086.2000. [DOI] [PMC free article] [PubMed] [Google Scholar]
- 31.Traub RD, Miles R. Pyramidal cell-to-inhibitory cell spike transduction explicable by active dendritic conductances in inhibitory cell. J Comput Neurosci. 1995;2:291–298. doi: 10.1007/BF00961441. [DOI] [PubMed] [Google Scholar]
- 32.Traub RD, Whittington MA, Colling SB, Buzsáki G, Jefferys JGR. Analysis of gamma rhythms in the rat hippocampus in vitro and in vivo. J Physiol (Lond) 1996a;493:471–484. doi: 10.1113/jphysiol.1996.sp021397. [DOI] [PMC free article] [PubMed] [Google Scholar]
- 33.Traub RD, Whittington MA, Buhl EH, Jefferys JGR, Faulkner HJ. On the mechanism of the γ→β frequency shift in neuronal oscillations induced in rat hippocampal slices by tetanic stimulation. J Neurosci. 1999b;19:1088–1105. doi: 10.1523/JNEUROSCI.19-03-01088.1999. [DOI] [PMC free article] [PubMed] [Google Scholar]
- 34.Traub RD, Schmitz D, Jefferys JGR, Draguhn A. High-frequency population oscillations are predicted to occur in hippocampal pyramidal neuronal networks interconnected by axoaxonal gap junctions. Neuroscience. 1999a;92:407–426. doi: 10.1016/s0306-4522(98)00755-6. [DOI] [PubMed] [Google Scholar]
- 35.Traub RD, Whittington MA, Stanford IM, Jefferys JGR. A mechanism for generation of long-range synchronous fast oscillations in the cortex. Nature. 1996b;383:621–624. doi: 10.1038/383621a0. [DOI] [PubMed] [Google Scholar]
- 36.Traub RD, Bibbig A, Fisahn A, LeBeau FEN, Whittington MA, Buhl EH. A model of gamma-frequency network oscillations induced in the rat CA3 region by carbachol in vitro. Eur J Neurosci. 2000;12:4093–4106. doi: 10.1046/j.1460-9568.2000.00300.x. [DOI] [PubMed] [Google Scholar]
- 37.Traub RD, Bibbig A, Piechotta A, Draguhn A, Schmitz D. Synaptic and nonsynaptic contributions to giant IPSPs and ectopic spikes induced by 4-aminopyridine in the hippocampus in vitro. J Neurophysiol. 2001;85:1246–1256. doi: 10.1152/jn.2001.85.3.1246. [DOI] [PubMed] [Google Scholar]
- 38.Venance L, Rozov A, Blatow M, Burnashev N, Feldmeyer D, Monyer H. Connexin expression in electrically coupled postnatal rat brain neurons. Proc Natl Acad Sci USA. 2000;97:10260–10265. doi: 10.1073/pnas.160037097. [DOI] [PMC free article] [PubMed] [Google Scholar]
- 39.von Krosigk M, Bal T, McCormick DA. Cellular mechanisms of a synchronized oscillation in the thalamus. Science. 1993;261:361–364. doi: 10.1126/science.8392750. [DOI] [PubMed] [Google Scholar]
- 40.Wang X-J, Buzsáki G. Gamma oscillation by synaptic inhibition in a hippocampal interneuronal network model. J Neurosci. 1996;16:6402–6413. doi: 10.1523/JNEUROSCI.16-20-06402.1996. [DOI] [PMC free article] [PubMed] [Google Scholar]
- 41.White JA, Chow CC, Ritt J, Soto-Treviño C, Kopell N. Synchronization and oscillatory dynamics in heterogeneous, mutually inhibited neurons. J Comput Neurosci. 1998;5:5–16. doi: 10.1023/a:1008841325921. [DOI] [PubMed] [Google Scholar]
- 42.Whittington MA, Traub RD, Jefferys JGR. Synchronized oscillations in interneuron networks driven by metabotropic glutamate receptor activation. Nature. 1995;373:612–615. doi: 10.1038/373612a0. [DOI] [PubMed] [Google Scholar]
- 43.Whittington MA, Stanford IM, Colling SB, Jefferys JGR, Traub RD. Spatiotemporal patterns of γ frequency oscillations tetanically induced in the rat hippocampal slice. J Physiol (Lond) 1997;502:591–607. doi: 10.1111/j.1469-7793.1997.591bj.x. [DOI] [PMC free article] [PubMed] [Google Scholar]
- 44.Whittington MA, Traub RD, Faulkner HJ, Jefferys JGR, Chettiar K. Morphine disrupts long-range synchrony of gamma oscillations in hippocampal slices. Proc Natl Acad Sci USA. 1998;95:5807–5811. doi: 10.1073/pnas.95.10.5807. [DOI] [PMC free article] [PubMed] [Google Scholar]
- 45.Whittington MA, Traub RD, Kopell N, Ermentrout B, Buhl EH. Inhibition-based rhythms: experimental and mathematical observations on network dynamics. Int J Psychophysiol. 2000;38:315–336. doi: 10.1016/s0167-8760(00)00173-2. [DOI] [PubMed] [Google Scholar]
- 46.Zhang SJ, Huguenard JR, Prince DA. GABAA receptor-mediated Cl− currents in rat thalamic reticular and relay neurons. J Neurophysiol. 1997;78:2280–2286. doi: 10.1152/jn.1997.78.5.2280. [DOI] [PubMed] [Google Scholar]