Abstract
In adaptive radiation therapy of head and neck cancer, any significant anatomical changes observed are used to adapt the treatment plan to maintain target coverage without elevating the risk of xerostomia. However, the additional resources required for adaptive radiation therapy pose a challenge for broad-based implementation. It is hypothesized that a change in transit fluence is associated with volumetric change in the vicinity of the target and therefore can be used as a decision support metric for adaptive radiation therapy. This was evaluated by comparing the fluence with volumetric changes in 12 patients. Transit fluence was measured by an in vivo portal dosimetry system. Weekly cone beam computed tomography was used to determine volume change in the rectangular region of interest from condyloid process to C6. The integrated transit fluence through the region of interest on the day of the cone beam computed tomography scan was calculated with the first treatment as the baseline. The correlation between fluence change and volume change was determined. A logistic regression model was also used to associate the 5% region of interest volume reduction replanning trigger point and the fluence change. The model was assessed by a chi-square test. The area under the receiver–operating characteristic curve was also determined. A total of 46 pairs of measurements were obtained. The correlation between fluence and volumetric changes was found to be −0.776 (P value <.001). The negative correlation is attributed to the increase in the photon fluence transport resulting from the volume reduction. The chi-square of the logistic regression was found to be 17.4 (P value <.001). The area under the receiver–operating characteristic curve was found to be 0.88. Results indicate the change in transit fluence, which can be measured without consuming clinical resources or requiring additional time in the treatment room, can be used as a decision support metric for adaptive therapy.
Keywords: radiation dosage, software, xerostomia, head and neck neoplasms, cone-beam computed tomography, transit fluence
Introduction
Xerostomia is a devastating late effect of head and neck cancer (HNC) radiation therapy.1 Because of the proximity of the salivary glands to the tumor site, they may overlap with the planning target volume (PTV) that receives prescription dose; thus, radiation exposure to the glands is often unavoidable. Advanced radiation delivery techniques, such as intensity-modulated radiotherapy2 and volumetric-modulated arc therapy (VMAT), are used to maximally spare surrounding normal tissues2,3 while delivering the prescription dose to the PTV. Even with these techniques, significant toxicity to the salivary glands and xerostomia risks are still observed.4,5 During a course of a radiation therapy, a patient with HNC can experience significant anatomical changes. Factors such as tumor shrinkage, weight loss, body fluid redistribution,6 and possible shifts of the parotid glands (PGs) toward the high-dose region6 can result in an unexpected dose increase to the PGs and higher risk of xerostomia.1,7,8
Adaptive radiotherapy (ART), the adaption of the treatment plan to account for such anatomical changes,6,9-12 is the only clinical strategy that can be used to ensure the PTV coverage and sparing of the organs at risk (OARs) is maintained throughout the treatment course.
Implementation of ART is a significant clinical challenge. Although dosimetric measures such as the mean PG dose and normal tissue complication probability are very effective in predicting high-grade xerostomia,8,13-15 Van Dijk et al,16,17 Belli et al,18 Sanguineti et al,19 and You et al20 find they are not effective predictors of acute xerostomia during normally fractionated 54- to 70-Gy treatments. Volumetric changes determined from PG contours16,18,19,21 and neck separation20 are found to be stronger and earlier predictors. At 6 to 12 months follow-up, it is found that the early PG volumetric changes during treatment are associated with late xerostomia.16 Volumetric changes are also believed to be more strongly associated with stem cell sterilization22 than dosimetric metrics.16 Three-dimensional imaging procedures,6,9-11,23,24 such as cone beam computed tomography (CBCT) and magnetic resonance imaging, performed on a regular basis throughout the treatment course can be used to capture anatomical changes. This technique has been shown to be effective in reducing dose to the PGs.6,9,11 However, the additional imaging procedures and physician assessment are time consuming and costly, thus hindering ART from being more broadly implemented.6 As the scans are taken only weekly, there is potential that the best time point to adapt has been missed. Furthermore, significant variability in the timing of anatomic change during a treatment course among patients is observed.16,25
Electronic portal image detector (EPID) dosimetry systems that use exit radiation, or transit fluence, from patients during treatments have been investigated and implemented for both real-time and off-line in vivo delivery monitoring.26-29 Such approaches compare the transit fluence detected by the EPID with the transit fluence expected based on the treatment plan. The results are used as a daily quality assurance of the delivery process and of patient safety. No additional patient exposure or significant workload for the therapists is incurred. Unlike other EPID-based in vivo systems27,28 requiring postprocessing, Watchdog26,29 (WD) is a real-time in vivo transit fluence verification system that provides immediate feedback to therapists during treatment of the accuracy of dose delivery.
The relationship between the change in transit fluence (▵ϕ) and the anatomy change in patients over the course of treatment has not been investigated. If established, such a relationship could be used to provide a daily signal to the clinic at very low cost that anatomic change in the treated tissues was occurring, and the need for plan adaptation should be reviewed. In this study, it is hypothesized that the change in transit fluence is associated with volumetric change in local anatomy, which is a decision support metric (DSM) in the ART process. This hypothesis is evaluated by comparing change in transit fluence with the change in the irradiated volume in 12 patients with HNC.
Method
The records of 12 randomly selected patients with HNC were studied under an IRB-approved retrospective protocol. All treatments were delivered with a 6-MV photon beam using a VMAT technique with millennium 120 multileaf collimators. Patients were immobilized with custom thermoplastic facemasks. The in vivo transit portal images were measured with the EPID set at a source to detector distance of 150 cm. The acquisition mode was set at portal dosimetry to facilitate nonsynchronized image acquisition. The images were acquired and recorded at a rate of approximately 100 milliseconds per frame. The transit fluence was measured by an in vivo portal dosimetry system, WD,26,29 on a daily basis.
The primary photon fluence incident on the patient, support couch, and immobilization system is attenuated and scattered before being detected at the EPID. Note that the transit fluence detected is the sum of the attenuated primary fluence and the scattered fluence. The EPID images were captured by WD in cine mode, typically 3000 to 4000 images per treatment. All the images for a given treatment session were summed across all treatment arcs to give an integrated transit fluence at EPID pixel e. Assuming a fixed treatment plan and patient’s bony anatomy being repositioned perfectly, any change in ϕe at a given treatment can be attributed to anatomical changes in the patient. The change of ϕe of any session i is defined as
| 1 |
where ϕe,i and ϕe,o are the exit fluence of session i and the baseline, respectively. The first session of a treatment course is used as the baseline. The objective here is to monitor the change in anatomy in the region of the patients’ lower face and neck. A fixed rectangular region of interest (ROI) corresponding to the projection of this region of each patient (Figure 1) on the transit fluence plane was used to calculate the average fluence change < ▵ϕe,i>.
Figure 1.
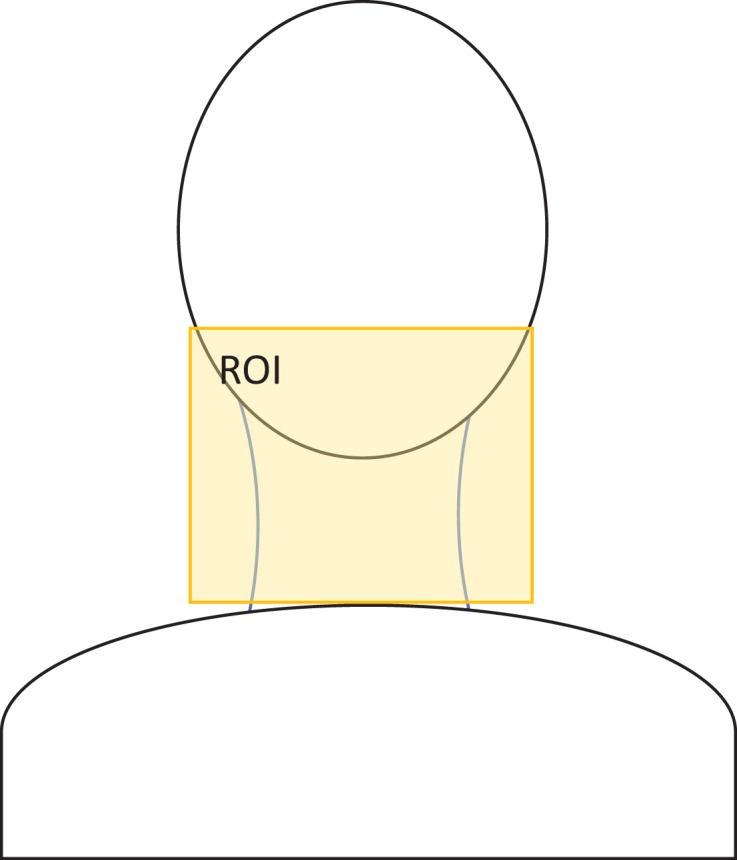
A schematic of a patient with head and neck cancer (HNC) with a rectangular regional of interest (ROI) defined around the neck region used in the transit fluence calculation.
During the course of the treatment, a weekly CBCT scan was acquired for each patient. A pair of kV–kV images was used for daily treatment setup. The residual daily setup variation is typically small but contributes to the uncertainty of the measurements. The CBCT was used to determine the volume change in the ROI. The planning computed tomography (CT) and the corresponding planning structures were deformably registered to the CBCT scan. The deformed structures and the CBCTs were imported into a commercial treatment planning system (TPS). The change in the mean dose of the salivary glands, <▵Dose>sg,i, and the percentage volume receiving at least 95% of the prescription dose, ▵V95PTV,i, of the PTV representing the OAR and target coverage were calculated. A structure, corresponding to the ROI, was created in the TPS for each CBCT spanning from condyloid process to C6 of the patient’s spinal cord. The volumetric change (▵VROI,i) in the ROI of each CBCT was measured in the TPS as the standard measure of the volume change. The correlations and P values of ▵VROI,i with <▵Dose>sg,i, ▵V95PTV,i, and <▵ϕe,i> were analyzed to determine their statistical significance. Linear regression between ▵VROI,i and the <▵ϕe,i> was also performed to determine the predictivity.
A significant increase in grade 2 xerostomia risk with a decrease of 10% or greater neck separation has been reported.20 If the ROI is modeled as a combination half sphere of radius R representing the head, and a cylinder of radius r and height h representing the neck, then,
| 2 |
Using the typical dimensions of head and neck,30 the dimensions h, R, and r were calculated to be 88 ∼ 94 mm, 89 ∼ 94 mm, and 49 ∼ 63 mm, respectively. A decrease of 10% neck separation corresponds to a decrease in VROI between 5% and 8%. In this study, a threshold of 5.0% decrease in volume is used as the trigger for replanning. A set of replanning decisions based on CBCT, assumed to follow binomial distribution, was obtained. The probability of replanning at session i, Pi, was modeled using logistical regression with the transit fluence change and the CBCT-based decision.
| 3 |
The P values of the χ2, β0, and β1 coefficients were evaluated for the statistical significances of the logistic regression fit and the resulting coefficients. The association between the volumetric change and the transit fluence change was assessed by the logarithmic odds ratio (OR). The reliability of the transit fluence signal in supporting the decision-making of replanning was assessed by area under the curve (AUC) of the receiver operating characteristic (ROC) curve.
Results
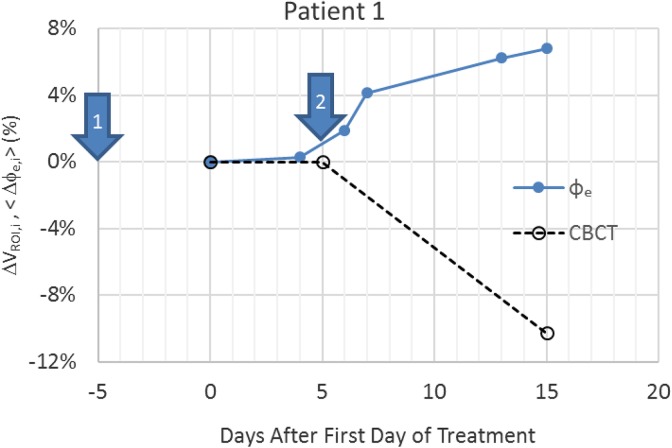
Table 1 shows the correlation and P values of <▵Dose>sg,i and ▵V95PTV,i with ▵VROI,i. The results indicate that there is a statistically significant relationship between mean dose change to salivary gland and ▵VROI,i. However, no significant relationship with ▵V95PTV,i was found implying PTV coverage was not affected by ▵VROI,i. Figure 2 shows an example of the variation in measured ▵VROI,i and <▵ϕe,i> for a single patient as a function of day after the start of treatment. The patient received treatment 5 times a week. The unequal gaps between daily transit fluence data are due to weekends and machine downtime, which resulted in the patient being treated on a dosimetrically equivalent machine but not equipped with WD. The volume change by treatment day 15 for this patient was 6.8%. Seven of the 12 patients exhibited larger than 5.0% volumetric reduction during their treatment courses.
Table 1.
Correlation Factor and P Value of ΔVROI,i With <ΔDose>sg,i and ΔV95PTV,i.
| Correlation | Factor | P Value | R 2 |
|---|---|---|---|
| <ΔDose>sg,i | −0.56 | <.001 | .308 |
| ΔV95PTV,i | −0.02 | .89 | 8.0 × 10⁻⁶ |
Figure 2.
The fluence change <ϕe,i> and volumetric change (▵VROI,i). Results measured from ϕe (solid line) and cone beam computed tomography (CBCT; dotted line), respectively.
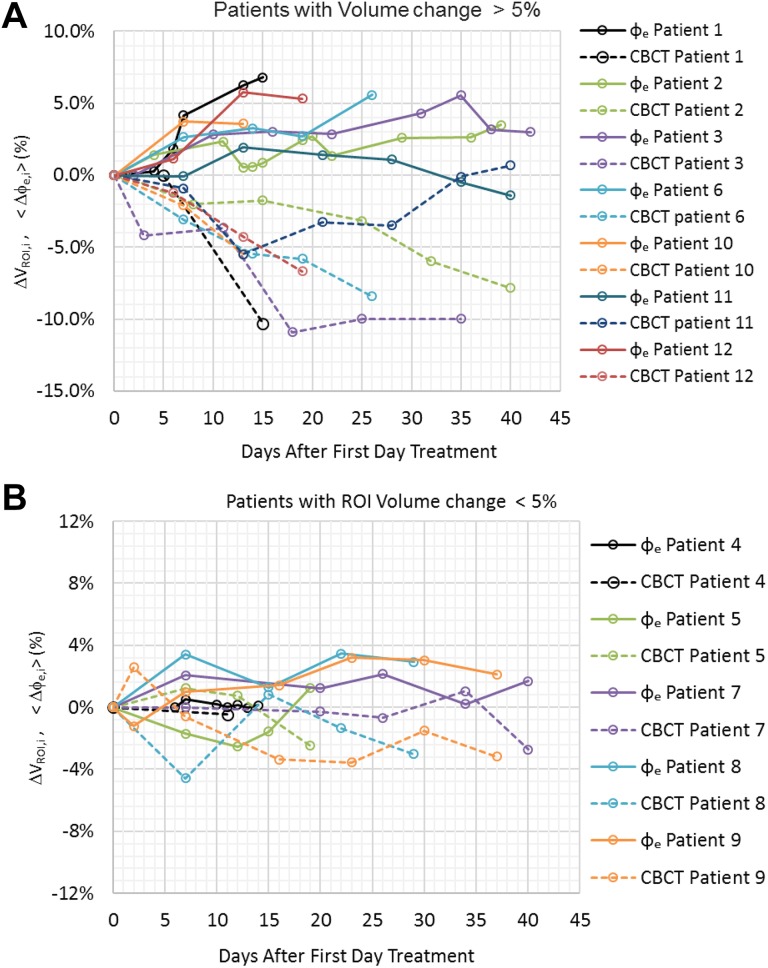
Figure 3A shows the ▵VROI,i and <▵ϕe,i> variation in patients with more than 5.0% volumetric decrease. The maximum ▵VROI,i ranges between −5.5% and −10.9% and corresponds to an increase of <▵ϕe,i> between 1.9% to 7.7%. The time observed for the volume to decrease 5.0% or more ranges from 10 to 29 days. For patients with a maximum decrease in ▵VROI,i less than −5.0%, the change in transit fluence was correspondingly smaller, with all <▵ϕe,i> values, being less than 3.5% (Figure 3B).
Figure 3.
The variation in transit fluence change and volumetric change in patients at different treatment days. A, Patients with volume reduction of more than 5%. B, Patients with volume reduction less than 5%.
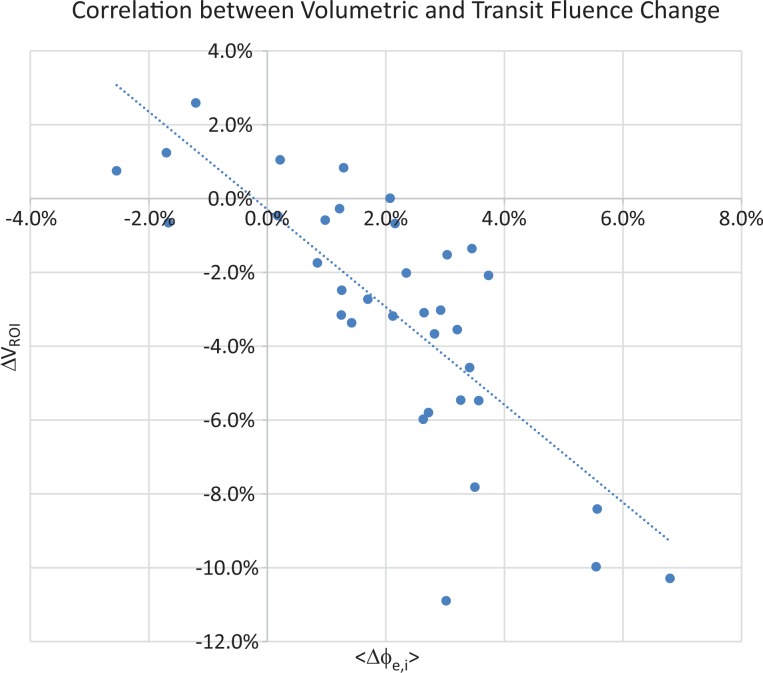
Excluding the baseline points, a total of 46 pairs of ▵VROI,i and <▵ϕe,i> were obtained. The correlation was found to be −0.776 with the P value less than .001. Figure 4 shows the scatter plot of ▵VROI,i and <▵ϕe,i>. The R2 of the linear regression between ▵VROI,i and <▵ϕe,i> is .60 with a slope of the regression of −1.15.
Figure 4.
Scatter plot of the transit fluence variation and cone beam computed tomography (CBCT) volumetric changes in the 10 patients to assess the correlation between fluence and volume change during the course of treatment.
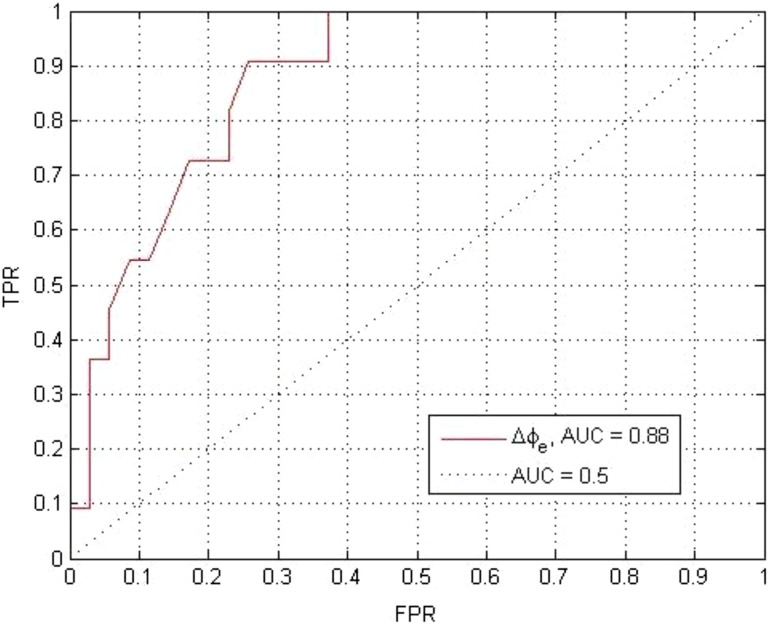
The χ2 statistic of the model is 17.4 with a P value less than .001. The β0 and β1 of the logistic regression are −6.84 and 87.0, respectively. The corresponding P values are .001 and .003 indicating both factors are statistically significant. The OR of <▵ϕe,i> was found to be 87.04 with the 95% confident interval of (27.4-146.6). The AUC of the ROC (Figure 5) is 0.88. This indicates a statistically significant association between the transit fluence change and the corresponding volumetric change and the associated replanning trigger.
Figure 5.
The receiver–operating characteristic curve (ROC) of the logistical regression model of the Watchdog (WD) signal based on 10 patients and a replanning threshold of 5% volume reduction corresponding to an increase risk of grade 2 xerostomia.
Discussion
Over the course of treatment, the change in the transit fluence signal was found to be significantly negatively correlated with the volumetric changes measured by CBCT. The negativity of the correlation can be attributed to the increased transmission of photon fluence with the reduction in radiological pathlength from the decreased volume. The <▵ϕe,i> correlates well with the ▵VROI,i both in cases where large changes in the volume of the neck ROI and where small changes in the ROI were observed. In the case of patient 1 (Figure 2), the original planning CT was taken a week prior to the beginning of the treatment (arrow “1”). A second CT was taken a week after the start of the treatment (arrow “2”) and was used for ART. Both CBCT and WD signal indicate significant volumetric changes after the second CT was taken. In effect, the CT scan for plan adaption was taken too early. In the cases with volume decrease less than 5%, both CBCT and WD show only minor volumetric change, indicating ART likely to be unnecessary for these patients. Similar to the findings by van Dijk et al16 and Marzi et al,25 the wide timing range of replanning trigger points observed indicates that a predetermined replanning time may not be an optimal strategy. Coupled with the logistic regression model, this limited data set indicates that WD can provide useful decision support information to physicians to determine whether ART is necessary and a more precise timing of ART without incurring more resources.
From the linear regression analysis, the ROI volume change accounts for about 60% of the change in transit fluence. The change in fluence is associated with the average change in radiological pathlength. The correlation between the change in fluence and volume depends on the shape of underlying anatomy with the ROI. The day-to-day variability in patient setup and machine performance will contribute some noise to the transit fluence signal. Using the daily <▵ϕe,i> of a patient over several stable anatomical time periods with ▵VROI,i < 1%, the setup error contribution to <▵ϕe,i> was estimated to be ±0.5%. Both β0 and β1 of the logistic regression model are shown to be statistically significant. The high OR shows a strong association between the WD signal change and replanning decision. As volumetric change is a good predictor for grade 2 xerostomia,20 change in transit fluence has a potential to predict the volumetric changes in during radiation therapy and acts a DSM for ART. The volumetric changes were found to be significantly correlated with the change in the mean dose to the salivary glands. However, the R2 indicates only 30% of the dose change can be explained by the volumetric change. This can be attributed to the large uncertainty in salivary glands deformable registration.31 Similar to Rozendaal et al’s finding,27 no significant correlation was found between PTV coverage changes and volumetric changes.
The current study is based on relatively small sample of 12 patients to demonstrate the feasibility of the metric. More data are being acquired to verify the volumetric predictability of the transit fluence signal. Improving the specificity of the signal using projections of the parotids and other OARs as the ROI is being investigated. Automation of this analysis process can expedite the current labor-intensive ART workflow and broaden its clinical implementation.
Conclusions
The statistically significant negative correlation between < ▵ϕe> and ▵VROI,i is attributed to the increase in the photon fluence transport resulting from the ROI volume reduction. Change in transit fluence over the course of treatment can likely be used as a DSM for clinicians to expedite the patient selection for replanning in ART without the need for serial CBCT. Such an automatically acquired metric would greatly assist physicians in the difficult task of deciding if and when a patient’s radiation therapy plan needed to be adapted to changing anatomy of the tissues being treated and support a broader based ART implementation.
Abbreviations
- ART
adaptive radiation therapy
- ROI
region of interest
- CBCT
cone beam computed tomography
- AUC
area under the receiver–operating characteristic curve
- ROC
receiver–operating characteristic curve
- HNC
head and neck cancer
- PTV
planning target volume
- VMAT
volumetric modulated arc therapy
- PGs
parotid glands
- OAR
organs at risk
- EPID
electronic portal image detector
- WD
Watchdog
- DSM
decision support metric
- TPS
treatment planning system
- β0
constant term of the logistic regression
- β1
coefficient of an input parameter of the logistic regression
- CT
computed tomography
- <▵Dose>sg,i
the change of mean dose to the salivary glands at session i transit fluence
- ▵ϕ
change of transit fluence
- ϕe,o
baseline transit fluence of pixel e
- ϕe,i
the ith session transit fluence of pixel e
- ϕe
integrated transit fluence of pixel e
- ▵ϕe,i
the change of ϕe of any session i
- <▵ϕe,i>
average change of ϕe of any session i
- OR
logarithmic odds ratio
- Pi
probability of replanning at session i
- R
radius of the half sphere representing the head in the ROI
- R
radius of the cylinder representing the neck in the ROI
- ▵r
the change of the radius of the cylinder in the ROI
- ▵V95PTV,i
the change of the percent volume receiving at least 95% of the prescription dose of the PTV at session i
- ▵VROI,i
the volumetric change of the ROI of each CBCT of any session i.
Footnotes
Declaration of Conflicting Interests: The author(s) declared no potential conflicts of interest with respect to the research, authorship, and/or publication of this article.
Funding: The author(s) disclosed receipt of the following financial support for the research, authorship, and/or publication of this article: The research was funded in part through the NIH/NCI Cancer Center Support Grant P30 CA008748.
ORCID iD: S. B. Lim  https://orcid.org/0000-0002-4054-8789
References
- 1. Cooper JS, Fu K, Marks J, Silverman S. Late effects of radiation therapy in the head and neck region. Int J Radiat Oncol Biol Phys. 1995;31(5):1141–1164. [DOI] [PubMed] [Google Scholar]
- 2. Ling CC, Burman C, Chui CS, et al. Conformal radiation treatment of prostate cancer using inversely-planned intensity-modulated photon beams produced with dynamic multileaf collimation. Int J Radiat Oncol Biol Phys. 1996;35(4):721–730. [DOI] [PubMed] [Google Scholar]
- 3. Hunt MA, Zelefsky MJ, Wolden S, et al. Treatment planning and delivery of intensity-modulated radiation therapy for primary nasopharynx cancer. Int J Radiat Oncol Biol Phys. 2001;49(3):623–632. [DOI] [PubMed] [Google Scholar]
- 4. Lee N, Xia P, Quivey JM, et al. Intensity-modulated radiotherapy in the treatment of nasopharyngeal carcinoma: an update of the UCSF experience. Int J Radiat Oncol Biol Phys. 2002;53(1):12–22. [DOI] [PubMed] [Google Scholar]
- 5. Nutting CM, Morden JP, Harrington KJ, et al. Parotid-sparing intensity modulated versus conventional radiotherapy in head and neck cancer (PARSPORT): a phase 3 multicentre randomised controlled trial. Lancet Oncol. 2011;12(2):127–136. [DOI] [PMC free article] [PubMed] [Google Scholar]
- 6. Castadot P, Lee JA, Geets X, Gregoire V. Adaptive radiotherapy of head and neck cancer. Semin Radiat Oncol. 2010;20(2):84–93. [DOI] [PubMed] [Google Scholar]
- 7. Dijkema T, Raaijmakers CPJ, Ten Haken RK, et al. Parotid gland function after radiotherapy: the combined michigan and utrecht experience. Int J Radiat Oncol Biol Phys. 2010;78(2):449–453. [DOI] [PMC free article] [PubMed] [Google Scholar]
- 8. Deasy JO, Moiseenko V, Marks L, Chao KSC, Nam J, Eisbruch A. Radiotherapy dose-volume effects on salivary gland function. Int J Radiat Oncol Biol Phys. 2010;76(3): S58–S63. [DOI] [PMC free article] [PubMed] [Google Scholar]
- 9. Brouwer CL, Steenbakkers R, Langendijk JA, Sijtsema NM. Identifying patients who may benefit from adaptive radiotherapy: does the literature on anatomic and dosimetric changes in head and neck organs at risk during radiotherapy provide information to help? Radiother Oncol. 2015;115(3):285–294. [DOI] [PubMed] [Google Scholar]
- 10. Brown E, Owen R, Harden F, et al. Predicting the need for adaptive radiotherapy in head and neck cancer. Radiother Oncol. 2015;116(1):57–63. [DOI] [PubMed] [Google Scholar]
- 11. Castelli J, Simon A, Louvel G, et al. Impact of head and neck cancer adaptive radiotherapy to spare the parotid glands and decrease the risk of xerostomia. Radiat oncol. 2015;10(1):6. [DOI] [PMC free article] [PubMed] [Google Scholar]
- 12. Guidi G, Maffei N, Meduri B, et al. A machine learning tool for re-planning and adaptive RT: a multicenter cohort investigation. Phys Medica. 2016;32(12):1659–1666. [DOI] [PubMed] [Google Scholar]
- 13. Chao KSC, Deasy JO, Markman J, et al. A prospective study of salivary function sparing in patients with head-and-neck cancers receiving intensity-modulated or three-dimensional radiation therapy: Initial results. Int J Radiat Oncol Biol Phys. 2001;49(4):907–916. [DOI] [PubMed] [Google Scholar]
- 14. Hawkins PG, Lee JY, Mao YP, et al. Sparing all salivary glands with IMRT for head and neck cancer: Longitudinal study of patient-reported xerostomia and head-and-neck quality of life. Radiother Oncol. 2018;126(1):68–74. [DOI] [PubMed] [Google Scholar]
- 15. Lee SW, Kang KW, Wu HG. Prospective investigation and literature review of tolerance dose on salivary glands using quantitative salivary gland scintigraphy in the intensity-modulated radiotherapy era. Head Neck. 2016;38(suppl 1):E1746–E1755. [DOI] [PubMed] [Google Scholar]
- 16. van Dijk LV, Brouwer CL, van der Laan HP, et al. geometric image biomarker changes of the parotid gland are associated with late xerostomia. Int J Radiat Oncol Biol Phys. 2017;99(5):1101–1110. [DOI] [PubMed] [Google Scholar]
- 17. van Dijk LV, Brouwer CL, van der Schaaf A, et al. CT image biomarkers to improve patient-specific prediction of radiation-induced xerostomia and sticky saliva. Radiother Oncol. 2017;122(2):185–191. [DOI] [PubMed] [Google Scholar]
- 18. Belli ML, Scalco E, Sanguineti G, et al. Early changes of parotid density and volume predict modifications at the end of therapy and intensity of acute xerostomia. Strahlenther Onkol. 2014;190(11):1001–1007. [DOI] [PubMed] [Google Scholar]
- 19. Sanguineti G, Ricchetti F, Wu B, McNutt T, Fiorino C. Parotid gland shrinkage during IMRT predicts the time to xerostomia resolution. Radiat Oncol. 2015;10(1):19. [DOI] [PMC free article] [PubMed] [Google Scholar]
- 20. You SH, Kim SY, Lee CG, et al. Is there a clinical benefit to adaptive planning during tomotherapy in patients with head and neck cancer at risk for xerostomia? Am J Clin Oncol. 2012;35(3):261–266. [DOI] [PubMed] [Google Scholar]
- 21. Schwartz DL, Garden AS, Thomas J, et al. Adaptive radiotherapy for head-and-neck cancer: initial clinical outcomes from a prospective trial. Int J Radiat Oncol Biol Phys. 2012;83(3):986–993. [DOI] [PMC free article] [PubMed] [Google Scholar]
- 22. Vissink A, van Luijk P, Langendijk JA, Coppes RP. Current ideas to reduce or salvage radiation damage to salivary glands. Oral Dis. 2015;21(1): E1–E10. [DOI] [PubMed] [Google Scholar]
- 23. Wu Q, Chi Y, Chen PY, Krauss DJ, Yan D, Martinez A. Adaptive replanning strategies accounting for shrinkage in head and neck IMRT. Int J Radiat Oncol Biol Phys. 2009;75(3):924–932. [DOI] [PubMed] [Google Scholar]
- 24. Zhang P, Simon A, Rigaud B, et al. Optimal adaptive IMRT strategy to spare the parotid glands in oropharyngeal cancer. Radiother Oncol. 2016;120(1):41–47. [DOI] [PubMed] [Google Scholar]
- 25. Marzi S, Pinnaro P, D’Alessio D, et al. Anatomical and dose changes of gross tumour volume and parotid glands for head and neck cancer patients during intensity-modulated radiotherapy: effect on the probability of xerostomia incidence. Clin Oncol. 2012;24(3): E54–E62. [DOI] [PubMed] [Google Scholar]
- 26. Fuangrod T, Greer PB, Woodruff HC, et al. Investigation of a real-time EPID-based patient dose monitoring safety system using site-specific control limits. Radiat Oncol. 2016;11(1):106. [DOI] [PMC free article] [PubMed] [Google Scholar]
- 27. Rozendaal RA, Mijnheer B, Hamming-Vrieze O, Mans A, van Herk M. Impact of daily anatomical changes on EPID-based in vivo dosimetry of VMAT treatments of head-and-neck cancer. Radiother Oncol. 2015;116(1):70–74. [DOI] [PubMed] [Google Scholar]
- 28. Rozendaal RA, Mijnheer BJ, van Herk M, Mans A. In vivo portal dosimetry for head-and-neck VMAT and lung IMRT: linking gamma-analysis with differences in dose-volume histograms of the PTV. Radiother Oncol. 2014;112(3):396–401. [DOI] [PubMed] [Google Scholar]
- 29. Woodruff HC, Fuangrod T, Van Uytven E, et al. First experience with real-time EPID-based delivery verification during IMRT and VMAT sessions. Int J Radiat Oncol Biol Phys. 2015;93(3):516–522. [DOI] [PubMed] [Google Scholar]
- 30. Vasavada AN, Danaraj J, Siegmund GP. Head and neck anthropometry, vertebral geometry and neck strength in height-matched men and women. J biomech. 2008;41(1):114–121. [DOI] [PubMed] [Google Scholar]
- 31. Pukala J, Johnson PB, Shah AP, et al. Benchmarking of five commercial deformable image registration algorithms for head and neck patients. J Appl Clin Med Phy. 2016;17(3):25–40. [DOI] [PMC free article] [PubMed] [Google Scholar]


