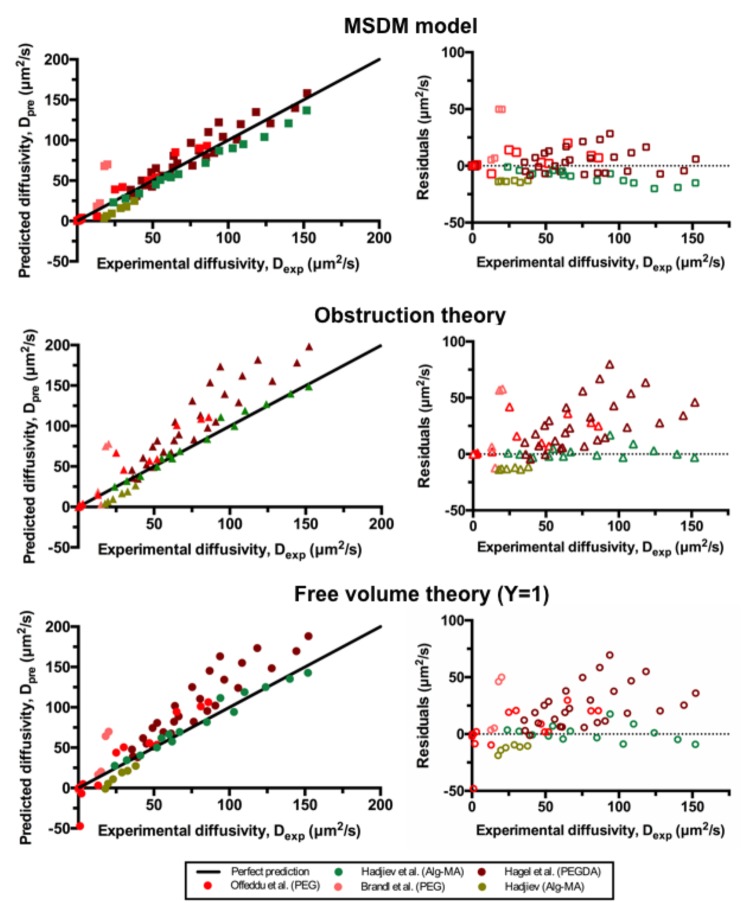
Figure 5.
Parity plot of predicted versus experimental diffusivity. The perfect prediction is illustrated as the 1–1 line plotted in black. The MSDM model (squares) by eq 6 predicts the experimental diffusivity of dextran solutes in both poly(ethylene glycol) hydrogels (PEG)42,46,48 and alginate-based hydrogels36,49 more accurately than eqs 3 and 4—free volume theory (triangles) and obstruction theory (circles). Each color of data points represents a different study of the meta-analysis. In the residuals versus experimental diffusivity plot, the perfect prediction is shown as a black dotted line.

