

Abstract
This study is a retrospective cohort study that examines the association between weight-for-age percentile and pediatric admission incidence from the emergency department (ED) for all diagnoses. The charts of 1432 pediatric patients under 18 years with ED visits from 2013 to 2015 at a tertiary children’s hospital were reviewed. Analyses of subject age/weight stratifications were performed, along with ED disposition, reason for visit, and Emergency Severity Index (ESI). Multivariable logistic regression models were used to evaluate the independent effect of weight-for-age percentile on ED disposition while controlling for age, ESI, and reason for visit. Underweight subjects were more likely to be admitted than their normal weight counterparts when analyzed overall (odds ratio [OR] = 2.58, P < .01) and by age: less than 2.0 years of age (OR = 2.04, P = .033), between 2.01 and 6.0 years of age (OR = 8.60, P = .004), and between 6.01 and 13.0 years of age (OR = 3.83, P = .053). Younger age (OR = 0.935, P < .001) and higher acuity (OR = 3.49, P < .001) were also significant predictors of admission. No significant associations were found between weight and likelihood of admission for patients older than 13.01 years or between overweight/obese weight categories and admission for any age subgroups. This study suggests that underweight children younger than 13 years are at higher risk to be admitted from the ED than their normal weight, overweight, and obese counterparts. Even when controlling for other key factors, such as the ESI, a lower weight-for-age percentile was a reliable predictor of hospitalization.
Keywords: weight, emergency department, admission
Introduction
About 1 in 5 children is obese in the United States, a number that has tripled since 1970, and about 3.8% of American children are underweight.1-3 A child’s weight is an important reflection of his or her development and overall health. Due to rising rates of obesity, children now face diseases once thought to be encountered only in adulthood such as cardiovascular disease, hyperlipidemia, type 2 diabetes, joint problems, and asthma in addition to developmental and mental health concerns.4,5 On the other hand, underweight status in children has been associated with increased infection and bone fracture rate.6,7 With increasing data demonstrating negative outcomes associated with abnormal weight status, it is important to study whether weight may be a risk factor for hospitalization in pediatric patients.
In the pediatric emergency department (ED), it is standard practice to measure a child’s weight-for-age percentile (weight-age %) using the Centers for Disease Control and Prevention and World Health Organization weight-age % curves.8-10 The weight-age % is the most common reference standard for a child’s weight status in the ED, likely due to its time efficiency and applicability to all age groups of children.
Results from studies evaluating the association between weight and ED disposition (ie, discharge home or hospital admission) have been limited and inconsistent.6,10-13 No pediatric study has examined weight-age % as a predictor of ED disposition across all diagnoses. Furthermore, no previous pediatric studies have considered acuity with a validated triage tool, such as the Emergency Severity Index (ESI), in addition to weight-age % as predictors for ED disposition. Therefore, the objective of this study was to examine the association between pediatric weight-age % and ED disposition. Our hypothesis was that underweight and obese children would be at greater risk for hospital admission post-ED than those of normal weight.
Materials and Methods
Study Population
Prior to study initiation and approval, waiver of consent and HIPAA (Health Insurance Portability and Accountability Act) authorization were obtained from the local institutional review board for this retrospective cohort chart review. Subjects younger than 18 years of age were included if they received treatment in the Level 1 pediatric ED of a tertiary care children’s hospital between August 1, 2013, and July 31, 2015. Patients were excluded if weight, age, or ED-disposition data were missing from the record. If a patient had multiple ED visits during the 2-year study time frame, only first visit data were retained in the dataset.
Randomization and Data Collection
To ensure data were unaffected by seasonal illness patterns, patients were randomly selected in 3-month intervals throughout the 2-year study period. Data collected from each chart included demographic characteristics (gender, age, race, and ethnicity), weight-age %, reason for visit, ED disposition (ie, hospital admission or discharge home), and ESI.
Group Assignments and Operational Definitions
Subjects were divided into groups based on the weight-age % categories defined as follows: underweight, less than the 5th percentile; normal, between the 5th and 85th percentile; overweight, between the 85th and 95th percentile; and obese, greater than the 95th percentile.14 Subjects were also categorized into groups by their age in years: (1) younger than 2.0, (2) 2.01 to 6.0, (3) 6.01 to 13.0, and (4) 13.01 to 18.0.
To determine the effect of the ED-presenting diagnosis as a potential factor in disposition, the reason for visit was collected for subanalysis. Each reason for visit was retrospectively assigned into 1 of 7 diagnostic categories: Gastrointestinal, Respiratory, Endocrine, Infectious, Orthopedic/Trauma, Neurological, and Other (eg, postsurgical, psychological, parental concern, etc).
The ESI algorithm (version 4) was used to determine ESI scores for all study subjects. The ESI algorithm uses clinical parameters to triage and classify ED patients into a 5-level stratification grouping based on the degree of both acuity and resource needs.15 A Level 1 assignment indicates that care is required most urgently, and a Level 5 designation is given to those whose needs are the least urgent. All pediatric ED triage nurses at this tertiary center were trained in use of the ESI algorithm to eliminate a potential confounding factor for this study.
Statistical Analysis
An estimated sample size of 1459 was calculated to achieve 80% power at a .05 significance level with a change in a continuous independent variable corresponding to an odds ratio of 1.4.12 Descriptive analysis and appropriate parametric or nonparametric tests, (ie, Pearson’s χ2, Mann-Whitney U, and Kruskal-Wallis) were used to examine group comparisons and associations between weight classification and demographic variables or outcomes. An overall multivariable logistic regression model tested associations among age in categorical groups, weight-age % categories, and ESI score. Secondary models were tested within each age subgroup to evaluate the independent effect of weight-age % category on ED disposition while adjusting for effects of ESI. An exploratory analysis using multivariable logistic regression to identify predictors of ED disposition while adjusting for the covariates of age (treated as a continuous variable), weight-age % categories, reason for ED visit, and ESI score. For regression analyses, ESI scores were treated as a continuous variable (eg, 5 to represent most urgent need through 1 to represent least urgent need) as has been done previously in the literature.16 ESI scores were further reverse-coded so the odds ratio would reflect a positive direction in the relationship between ESI and odds of admission. Within regression models, normal weight was treated as the reference group within weight-age % variable, and when reason for visit was treated as a covariate, “other” was used as the reference group. Each model output met statistical relevance for goodness-of-fit based on the Hosmer and Lemeshow test and Wald statistic. Adjusted odds ratios with 95% confidence intervals were obtained and reported. A P value of .05 was considered statistically significant in all tests. All analyses were conducted using SPSS (version 22.0; IBM Corp, Released 2013; IBM SPSS Statistics for Windows, Version 22.0, IBM Corp, Armonk, NY).
Ethical Approval and Informed Consent
This study received expedited institutional review board (IRB) approval by the hospital IRB (Approval # 5658). According to the retrospective nature of the study, the IRB waived the requirement for HIPAA and informed consent.
Results
A total of 1513 patient records were initially reviewed and 81 (5.3%) cases were excluded due to proportion of missing data. Of the 1432 cases, an additional 22 charts were missing ESI scores; thus, all analyses including ESI were conducted on a sample of 1410 (Figure 1). Patient characteristics of the 1432 enrolled subjects are summarized in Table 1. The weight distribution of the overall sample demonstrated that 76/1432 (5%) were classified as underweight and 437/1432 (31%) were classified as overweight or obese (Figure 2). On average, patients in the overweight and obese categories were older and there was a significant (P < .01) difference in the mean age of patients among the 4 different weight groups. A total of 272/1432 (19.0%) patients were admitted to the hospital from the ED. Within the 3 age groups representing those 13 years and younger, there was a significant association between weight group and ED disposition (Figure 3). In all age groups less than 13 years, there was a significantly (P < .05) higher proportion of underweight patients admitted to the hospital from the ED. In all weight groups, the median ESI was 3 (Table 1). The ESI score was significantly lower (indicating higher acuity) for those who were admitted compared with those discharged home (Table 2).
Figure 1.

Subject eligibility, enrollment, and analyses.
Table 1.
Patient Characteristics.
| Characteristics | Underweight (n = 76) | Normal (n = 919) | Overweight (n = 215) | Obese (n = 222) | P | |
|---|---|---|---|---|---|---|
| Age (years), mean ± SD; median (IQR) | 4.3 ± 5.3; 1.4 (0.8-8.5) | 6.7 ± 6.2; 4.6 (0.9-12.7) | 8.0 ± 6.3; 7.7 (1.5-14.1) | 9.7 ± 5.9; 11.0 (3.3-14.8) | <.01 | |
| Age (years), mean ± SD | 0-2.0 | 0.8 ± 0.5 | 0.7 ± 0.5 | 0.7 ± 0.6 | 0.8 ± 0.6 | .60 |
| 2.01-6.0 | 3.2 ± 1.2 | 4.1 ± 1.2 | 4.3 ± 1.1 | 4.0 ± 1.3 | .05 | |
| 6.01-13.0 | 9.8 ± 1.8 | 9.8 ± 2.0 | 10.1 ± 2.0 | 10.2 ± 1.7 | .44 | |
| 13.01-18.0 | 15.5 ± 1.8 | 15.7 ± 1.3 | 15.6 ± 1.4 | 15.4 ± 1.5 | .67 | |
| Gender, n (%) | Female | 33 (43) | 446 (49) | 101 (47) | 85 (38) | .05 |
| Male | 43 (57) | 473 (51) | 114 (53) | 137 (62) | ||
| Race, n (%) | Asian | 8 (11) | 64 (7) | 8 (4) | 12 (5) | .57 |
| Black | 3 (4) | 21 (2) | 10 (5) | 14 (6) | ||
| Caucasian | 45 (59) | 514 (56) | 135 (63) | 110 (50) | ||
| Hispanic | 11 (15) | 206 (22) | 41 (19) | 51 (23) | ||
| American Indian | 1 (1) | 16 (2) | 3 (1) | 4 (2) | ||
| Unknown | 4 (5) | 62 (7) | 9 (4) | 15 (7) | ||
| Other | 4 (5) | 36 (4) | 9 (4) | 16 (7) | ||
| Reason for visit, n (%)a | Gastrointestinal | 15 (20) | 161 (17) | 33 (15) | 21 (9) | <.01 |
| Respiratory | 11 (14) | 90 (10) | 15 (7) | 18 (8) | ||
| Endocrine | 6 (8) | 15 (2) | 3 (1) | 8 (4) | ||
| Infectious | 15 (20) | 202 (22) | 48 (23) | 35 (16) | ||
| Orthopedic/trauma | 20 (26) | 370 (40) | 98 (46) | 110 (49) | ||
| Neurological | 4 (5) | 46 (5) | 10 (5) | 17 (8) | ||
| Other | 5 (7) | 35 (4) | 7 (3) | 13 (6) | ||
| ED disposition, n (%) | Discharge | 42 (55) | 751 (82) | 173 (80) | 194 (87) | <.001 |
| Hospital admission | 34 (45) | 168 (18) | 42 (20) | 28 (13) | ||
| ESI score, mean ± SDb | 3.0 ± 0.7 | 3.3 ± 0.7 | 3.3 ± 0.7 | 3.4 ± 0.8 | <.01 | |
| Median (interquartile range) | 3.0 (3.0-3.0) | 3.0 (3.0-4.0) | 3.0 (3.0-4.0) | 3.0 (3.0-4.0) | ||
Abbreviations: SD, standard deviation; IQR, interquartile range; ED, emergency department; ESI, Emergency Severity Index.
Sample 1431 due to one missing data point.
Sample 1410 due to missing ESI data.
Figure 2.
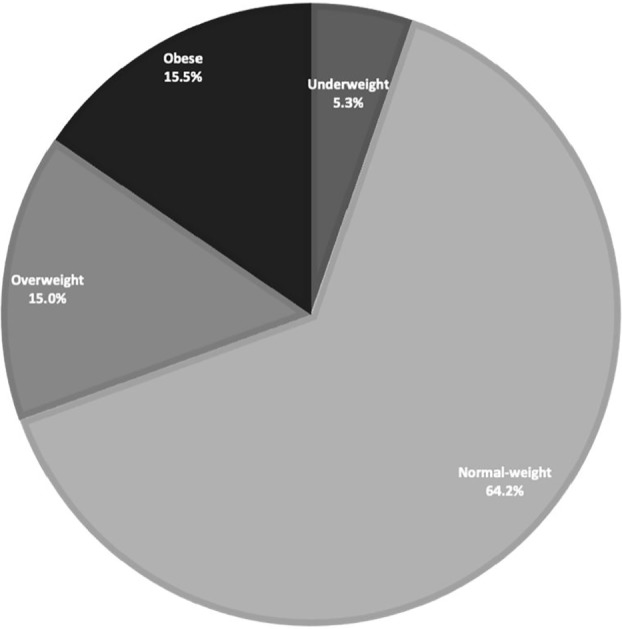
Weight group composition.
Figure 3.

Patient admission across weight and age groups.
*P = .011; +P = .004; **P = .014; ‡P = .499.
Table 2.
Mean ESI Score by Weight and ED Disposition.
| Underweight (n = 76) | Normal (n = 904) | Overweight (n = 215) | Obese (n = 215) | |
|---|---|---|---|---|
| Discharge | 3.24 ± 0.76 | 3.39 ± 0.68 | 3.46 ± 0.63 | 3.49 ± 0.68 |
| Hospital admission | 2.71 ± 0.52 | 2.75 ± 0.71 | 2.67 ± 0.61 | 2.74 ± 0.90 |
| P a | <.01 | <.001 | <.001 | <.001 |
Abbreviation: ESI, Emergency Severity Index; ED, emergency department.
Mann-Whitney U for comparison of disposition within each weight class.
Weight-for-Age Categories and Age Subgroups
A multivariable logistic regression testing the overall association of age in categorical groups, weight-age % categories, and ESI score (see Table 3). The results demonstrate a highly significant overall effect for weight-age % category (Wald = 16.6, P = .001), age group (Wald = 30.38, P < .001), and ESI (Wald = 140.561, P < .001). An examination of the odds ratio for age groups shows that the younger age is associated with higher odds of admission. Similarly, the lower weight-age % category is associated with higher odds of admission.
Table 3.
Results of Logistic Regression Model for Age, Weight, and ESI.
| Independent Variable | OR (95% CI) | P | |
|---|---|---|---|
| Age group (years) | 13.01-18.0 | Reference | |
| 0-2.0 | 2.82 (1.88-4.22) | <.001 | |
| 2.01-6.0 | 1.63 (0.97-2.73) | .06 | |
| 6.01-13.0 | 1.36 (0.83-2.23) | .23 | |
| Weight group | Normal weight | Reference | |
| Underweight | 2.81 (1.64-4.80) | <.001 | |
| Overweight | 1.31 (0.87-1.97) | .20 | |
| Obese | 0.83 (0.51-1.34) | .45 | |
| Reverse-coded ESIa | 3.71 (3.04-4.725) | <.001 | |
Abbreviations: CI, confidence interval; ESI, Emergency Severity Index; OR, odds ratio.
ESI scores were reverse coded and treated as a continuous variable (eg, 5 to represent most urgent need through 1 to represent least urgent need) so the odds ratio would reflect a positive direction in the relationship between ESI and odds of admission.
To elucidate additional meaning of the impact of weight within each age group, secondary logistic regression models were tested. Associations with ED disposition from multivariable analysis within the 4 age subgroups are displayed in Table 4. Within the 3 age groups representing those 13 years and younger, underweight subjects less than 2.0 years of age (odds ratio [OR] = 2.04, P = .033), between 2.01 and 6.0 years of age (OR = 8.60, P = .004), and between 6.01 and 13.0 years of age (OR = 3.83; P = .053) were more likely to be hospitalized than normal weight children while controlling for ESI.
Table 4.
Age Subgroup Models for Post-ED Hospital Admission.
| Variable | Age Group (Years) | |||
|---|---|---|---|---|
| 0-2.0 (n = 524), OR (95% CI) | 2.01-6.0 (n = 207), OR (95% CI) | 6.01-13.0 (n = 299), OR (95% CI) | 13.01-18.0 (n = 380), OR (95% CI) | |
| Normal weight | Reference | Reference | Reference | Reference |
| Underweight | 2.04 (1.06-3.93) | 8.60 (1.97-37.46) | 3.83 (0.98-14.94) | 3.29 (0.42-25.59) |
| Overweight | 1.09 (0.60-2.00) | 1.34 (0.45-3.99) | 1.23 (0.45-3.35) | 1.86 (0.74-4.72) |
| Obese | 0.60 (0.26-1.35) | 0.98 (0.23-4.07) | 0.47 (0.15-1.50) | 1.63 (0.65-4.08) |
| Reverse-coded ESIa | 2.30 (1.71-3.10) | 6.16 (3.12-12.16) | 5.35 (3.12-9.15) | 7.23 (4.13-12.66) |
Abbreviations: CI, confidence interval; ED, emergency department; ESI, Emergency Severity Index; OR, odds ratio.
ESI scores were reverse coded and treated as a continuous variable (eg, 5 to represent most urgent need through 1 to represent least urgent need) so the odds ratio would reflect a positive direction in the relationship between ESI and odds of admission.
Reason for ED Visit
Distribution of the reason for visit across the entire study population was as follows: Orthopedic/Trauma (n = 598, 42%), Infectious (n = 300, 21%), Gastrointestinal (n = 230, 16%), Respiratory (n = 134, 9%), Neurological (n = 77, 5%), Other (n = 60, 4%), and Endocrine (n = 32, 2%). In the secondary model, age in years and ESI (reverse-coded) were treated as continuous variables (Table 5). Patients who were underweight or presented with an endocrine reason for the ED visit were significantly more likely to be admitted than those of normal weight. There was no interaction effect with age, ESI as a continuous variable, or weight category. Age and ESI were also significant predictors in this model. For each additional year of age, the patient was 7% less likely to be admitted. An increase in acuity equal to 1 or greater ESI value score resulted in a 49% greater likelihood of hospital admission.
Table 5.
Results of Logistic Regression Model for Post-ED Admission.
| Independent Variable | OR (95% CI) | P | |
|---|---|---|---|
| Age in years | 0.93 (0.90-0.95) | <.001 | |
| Weight group | Normal weight | Reference | |
| Underweight | 2.58 (1.48-4.49) | .001 | |
| Overweight | 1.34 (0.88-2.04) | .17 | |
| Obese | 0.75 (0.45-1.24) | .26 | |
| Reason for ED visit | Other | Reference | |
| Orthopedic/trauma | 1.59 (0.69-3.65) | .28 | |
| Infectious | 1.44 (0.61-3.41) | .40 | |
| Gastrointestinal | 1.98 (0.85-4.65) | .12 | |
| Respiratory | 2.16 (0.89-5.24) | .09 | |
| Neurological | 1.86 (0.70-4.93) | .21 | |
| Endocrine | 16.55 (5.11-53.64) | <.001 | |
| Reverse-coded ESIa | 3.49 (2.76-4.41) | <.001 | |
Abbreviations: CI, confidence interval; ED, emergency department; ESI, Emergency Severity Index; OR, odds ratio.
ESI scores were reverse-coded and treated as a continuous variable (eg, 5 to represent most urgent need through 1 to represent least urgent need) so the odds ratio would reflect a positive direction in the relationship between ESI and odds of admission.
Discussion
Pediatric studies investigating weight and ED admission have attempted to draw associations similar to adult studies that have repeatedly linked overweight status with increased ED admissions.10,12,13 Our study is the first to examine the effect of weight-age %, ESI, and ED reason for visit on hospital admission in a single analysis. We found that the pediatric weight-age % had a significant impact on the likelihood of admission to the hospital from the ED, particularly in those patients younger than 13 years of age.
Wyrick et al12 examined the influence of weight using body mass index (BMI) rather than a weight-age % measurement. In their sample of children aged 2 to 18 years, they found that those with a lower BMI had a higher proportion of admissions from the ED than normal weight or overweight/obese children but did not show underweight status as a significant predictor for hospital admission when controlling for age and sex. In contrast, we tested different models within subgroups based on age, which allowed us to differentiate the effect of weight-age % and highlight a difference for those younger than 13 years. Furthermore, our study included patients younger than the age of 2 years because weight-age % does not carry the same age limitations as BMI. However, similar to Wyrick et al, we also did not find an association between obesity and hospitalization from the ED.
It was surprising to see overweight and obese children with no increased risk of admission across all age groups, especially when the literature points to morbidity and earlier physiologic change secondary to increased weight. It may be that pediatric patients have not been living with obesity for a long enough duration of time to experience the comorbidities of obesity that are responsible for the increased admission rate of obese adults. In fact, the additional energy stores from fat may be protective in children, especially at younger ages. Sabhaney et al6 demonstrated this protection as they found that children with higher weight have a lower odds ratio for skeletal fractures relative to children of normal weight.
A strength of our study was the inclusion of the ESI ED acuity scale as part of the analysis. We found a lower weight-age % to be a reliable predictor of hospitalization for specific age groups, as weight-age % and ESI had similar odds in the multiple regression. Based on our findings, practitioners may consider using weight-age % as an added metric, or tool, when assessing risk for admission in children presenting to the ED. The use of weight-age % in emergency triage scoring is an area of future prospective investigation. Furthermore, our findings should give the ED clinician a reason to employ extra vigilance when caring for underweight infants, toddlers, and preschoolers across all diagnostic categories.
Few studies in the literature have examined the relationship of weight, ED diagnosis, and risk of hospital admission. Within a sample of children who presented to the ED with acute asthma exacerbations, Carroll et al10 found 27% of patients with asthma were overweight based on a dichotomous definition as either less than or greater than the 95th percentile weight for age. Additionally, overweight children presenting with an asthma exacerbation were significantly more likely to be admitted than normal weight children when controlling for age, gender, and race. This finding was not reproduced in our population. When controlling for weight-age %, we did not find a risk associated with respiratory-related disorders. Instead, our examination of all diagnostic categories responsible for pediatric hospital admission post-ED revealed that endocrine disorders are a high-risk diagnosis. Therefore, our results highlight the need for further study of weight-age % class and diagnoses beyond asthma.
Our data demonstrate that underweight children seen in the emergency room are at higher odds of admission than those who are of normal weight. Many other studies have also linked an underweight status with morbidity in children, including an increased incidence of infection, bone fracture, and poor nutrition.6,7,17,18 These data do suggest that when an underweight child presents to the ED, staff should be more alert that this patient may require admission.
There were several limitations in this study. When further stratified into age groups, the number of patients in each age and weight category decreased. It may be possible that our analyses of older, underweight children may have been nonsignificant due to low subject numbers in this subgroup. Furthermore, it is possible that the final disposition of certain patients was influenced by chronic disease or other comorbidity. However, with the inclusion of the presenting diagnosis in our regression analysis, this is likely mitigated as a potential bias. It is also possible that our findings may be specific to our middle-income and suburban study population in which morbidity due to obesity may be alleviated by greater access to health care resources.
Conclusion
This is the first pediatric study to examine the relationship of weight-age % and ED admissions across all diagnoses and age groups, while also controlling for an independent and validated acuity scoring system. Our results show that underweight children younger than 13 years who present to a tertiary care ED are at higher risk of admission as compared with their normal weight peer group. This suggests that underweight children may require added attention from staff for their increased probability of hospital admission. Future studies in this area may further validate these findings and help establish a pediatric emergency triage scoring methodology that incorporates weight-age % and ESI.
Acknowledgments
We would like to acknowledge Lorene Schweig, MS, RN, CCRC, Sr Research Nurse Coordinator, Advocate Center for Pediatric Research Communications, for her exceptional work in reviewing and helping revise this study.
Footnotes
Author Contributions: VN: Contributed to conception and design; contributed to acquisition and interpretation; drafted the manuscript; gave final approval; agrees to be accountable for all aspects of work ensuring integrity and accuracy.
CL: Contributed to design; contributed to analysis and interpretation; critically revised the manuscript; gave final approval; agrees to be accountable for all aspects of work ensuring integrity and accuracy.
AD: Contributed to design; contributed to acquisition; critically revised the manuscript; gave final approval; agrees to be accountable for all aspects of work ensuring integrity and accuracy.
VH: Contributed to conception and design; contributed to analysis and interpretation; critically revised the manuscript; gave final approval; agrees to be accountable for all aspects of work ensuring integrity and accuracy.
Declaration of Conflicting Interests: The author(s) declared no potential conflicts of interest with respect to the research, authorship, and/or publication of this article.
Funding: The author(s) received no financial support for the research, authorship, and/or publication of this article.
Clinical Trial Registration: No clinical trial registration required.
ORCID iD: Vishal Naik  https://orcid.org/0000-0002-4833-7038
References
- 1. Fryar CD, Carroll MD, Ogden CL. Prevalence of Overweight and Obesity Among Children and Adolescents: United States, 1963-1965 Through 2011-2012. Atlanta, GA: Centers for Disease Control and Prevention; 2014. [Google Scholar]
- 2. Fryar CD, Carroll MD, Ogden CL. Prevalence of Underweight Among Children and Adolescents Aged 2-19 Years: United States, 1963-1965 Through 2013-2014. Hyattsville, MD: National Center for Health Statistics; 2016. [Google Scholar]
- 3. Hales CM, Carroll MD, Fryar CD, Ogden CL. Prevalence of obesity among adults and youth: United States, 2015-2016. NCHS Data Brief. 2017;(288):1-8. [PubMed] [Google Scholar]
- 4. Sahoo K, Sahoo B, Choudhury AK, Sofi NY, Kumar R, Bhadoria AS. Childhood obesity: causes and consequences. J Family Med Prim Care. 2015;4:187-192. [DOI] [PMC free article] [PubMed] [Google Scholar]
- 5. Halfon N, Larson K, Slusser W. Associations between obesity and comorbid mental health, developmental, and physical health conditions in a nationally representative sample of US children aged 10 to 17. Acad Pediatr. 2013;13:6-13. [DOI] [PubMed] [Google Scholar]
- 6. Sabhaney V, Boutis K, Yang G, et al. Bone fractures in children: is there an association with obesity? J Pediatr. 2014;165:313-318.e1. [DOI] [PubMed] [Google Scholar]
- 7. Dobner J, Kaser S. Body mass index and the risk of infection - from underweight to obesity. Clin Microbiol Infect. 2018;24:24-28. [DOI] [PubMed] [Google Scholar]
- 8. Barlow SE, Dietz WH, Klish WJ, Trowbridge FL. Medical evaluation of overweight children and adolescents: reports from pediatricians, pediatric nurse practitioners, and registered dietitians. Pediatrics. 2002;110(1 pt 2):222-228. [PubMed] [Google Scholar]
- 9. Dorsey KB, Wells C, Krumholz HM, Concato J. Diagnosis, evaluation, and treatment of childhood obesity in pediatric practice. Arch Pediatr Adolesc Med. 2005;159:632-638. [DOI] [PubMed] [Google Scholar]
- 10. Carroll CL, Stoltz P, Raykov N, Smith SR, Zucker AR. Childhood overweight increases hospital admission rates for asthma. Pediatrics. 2007;120:734-740. [DOI] [PubMed] [Google Scholar]
- 11. Nielsen JDJ, Laverty AA, Millett C, Mainous AG, 3rd, Majeed A, Saxena S. Rising obesity-related hospital admissions among children and young people in England: national time trends study. PLoS One. 2013;8:e65764. [DOI] [PMC free article] [PubMed] [Google Scholar]
- 12. Wyrick S, Hester C, Sparkman A, et al. What role does body mass index play in hospital admission rates from the pediatric emergency department? Pediatr Emerg Care. 2013;29:974-978. [DOI] [PubMed] [Google Scholar]
- 13. Chen Y, Jiang Y, Mao Y. Hospital admissions associated with body mass index in Canadian adults. Int J Obes (Lond). 2007;31:962-967. [DOI] [PubMed] [Google Scholar]
- 14. Center for Disease Control and Prevention. Use and interpretation of the WHO and CDC growth charts for children from birth to 20 years in the United States. https://www.cdc.gov/nccdphp/dnpa/growthcharts/resources/growthchart.pdf. Accessed September 3, 2019.
- 15. Gilboy N, Paula T, Travers D, Rosenau AM. Emergency Severity Index (ESI): A Triage Tool for Emergency Department Care, Version 4. Implementation Handbook 2012 Edition. Rockville, MD: Agency for Healthcare Research and Quality; 2011. [Google Scholar]
- 16. Vigil JM, Coulombe P, Alcock J, et al. Patient ethnicity affects triage assessments and patient prioritization in US Department of Veterans Affairs emergency departments. Medicine (Baltimore). 2016;95:e3191. [DOI] [PMC free article] [PubMed] [Google Scholar]
- 17. Van Grieken A, Renders CM, Wijtzes AI, Hirasing RA, Raat H. Overweight, obesity and underweight is associated with adverse psychosocial and physical health outcomes among 7-year-old children: the “Be active, eat right” study. PLoS One. 2013;8:e67383. [DOI] [PMC free article] [PubMed] [Google Scholar]
- 18. Katona P, Katona-Apte J. The interaction between nutrition and infection. Clin Infect Dis. 2008;46:1582-1588. [DOI] [PubMed] [Google Scholar]