

Abstract
Synapses are fundamental information processing units of the brain and synaptic dysregulation is central to many brain disorders (‘synaptopathies’). However, systematic annotation of synaptic genes and ontology of synaptic processes are currently lacking. We established SynGO, an interactive knowledgebase that accumulates available research about synapse biology using Gene Ontology (GO) annotations to novel ontology terms: 87 synaptic locations and 179 synaptic processes. SynGO annotations are exclusively based on published, expert-curated evidence. Using 2922 annotations for 1112 genes, we show that synaptic genes are exceptionally well conserved and less tolerant to mutations than other genes. Many SynGO terms are significantly overrepresented among gene variation associated with intelligence, educational attainment, ADHD, autism and bipolar disorder and among de novo variants associated with neurodevelopmental disorders including schizophrenia. SynGO is a public, universal reference for synapse research and an online analysis-platform for interpretation of large scale -omics data (https://syngoportal.org and http://geneontology.org).
Keywords: synapse, gene annotation, Gene Ontology, synaptic plasticity, synaptopathies, enrichment study, gene-set analysis, synaptic proteome network, synaptome
INTRODUCTION
Synapses are information processing units of the brain that provide the foundation for higher level information integration in dendrites, neurons and networks. Use-dependent changes in synaptic strength (synaptic plasticity) are firmly established as main underlying principles of cognitive processes, such as memory formation and retrieval, perception, sensory processing, attention, associative learning, and decision making (Abdou et al., 2018; Groschner et al., 2018; Kandel, 2001; Petersen and Crochet, 2013; Ripolles et al., 2018). Based on both genetic and neurobiological evidence, synaptic dysregulation is widely recognized as an important component of risk in many brain disorders (termed ‘synaptopathies’ (Boda et al., 2010; Bourgeron, 2015; Grant, 2012; Monday and Castillo, 2017)), such as autism spectrum disorder (ASD), attention deficit hyperactivity disorder (ADHD), schizophrenia, Alzheimer’s disease and Parkinson’s disease (Arnsten et al., 2012; Bourgeron, 2015; De Rubeis et al., 2014; Fromer et al., 2014; Heutink and Verhage, 2012; Hong et al., 2016; Selkoe, 2002; Soukup et al., 2018; Spires-Jones and Hyman, 2014; Sudhof, 2008). Despite these intense investigations and a large variety of research efforts focused synaptic proteins and on their subcellular organization and specific functions, only sparse efforts have been made to establish systematic resources for synapse biology in health and disease. In particular, the ontology of synaptic processes has been poorly defined, which has precluded the systematic annotation of synaptic proteins/genes.
The Gene Ontology (GO) is the most widely used resource for gene function annotations. The resource has two components: (i) the ontology, a framework of definitions called ‘terms’ to describe gene functions and locations and their relationships, and (ii) GO annotations, statements linking genes to specific terms (Ashburner et al., 2000; The Gene Ontology, 2018). The ontology is divided into three aspects: (i) molecular function (MF), defining the molecular activities of gene products (e.g., protein kinase activity); (ii) Cellular Component, defining where they are active (e.g., on synaptic vesicle); and (iii) Biological Process, defining the processes that they carry out (e.g., synaptic vesicle exocytosis). Relationships between CC terms generally specify how smaller structures are parts of larger ones. Relationships between BP terms specify how sub-processes contribute to larger ones. The accuracy of GO annotations depends on (i) how well the ontology represents Molecular Function, Cellular Component (CC) and Biological Process (BP) terms for given systems, e.g., synapses; and (ii) how well experimental evidence supports the annotations.
Using existing annotations to synaptic GO terms and synaptic gene sets, several studies have shown that synaptic genes, i.e., genes encoding synaptic proteins, are significantly enriched in genetic variation associated with several brain traits (Savage et al., 2018; Zwir et al., 2018) and have produced valuable leads to understand the role of synapse function and dysfunction in these traits (De Rubeis et al., 2014; Fromer et al., 2014; Mattheisen et al., 2015; Pedroso et al., 2012; Thapar et al., 2016). However, it is evident that the lack of systematic annotation of synaptic genes also limits progress. Available resources, including GO, have only limited representations of synapse biology, and lacked a comprehensive ontology of synaptic processes and subcellular locations in the synapse. Rather than capturing current understanding of the synapse, existing resources are biased by uneven and patchy coverage of different aspects of synapse biology. Moreover, existing resources include data that have not been curated by synapse experts and a large fraction of the data has been aggregated in an unsupervised manner, for example by automated text mining, or by large-scale experiments that result in high rates of false-positives, such as bulk proteomics analyses and yeast two-hybrid studies. Thresholds for inclusion are not systematically defined and are typically set quite low. Together these shortcomings limit the impact of such resources and may engender incorrect conclusions, for instance in studies reporting associations between genetic findings and synapses and between synapses and brain related traits..
To overcome these limitations, we established SynGO, a partnership between the GO Consortium and 15 synapse expert laboratories in Europe, North America and Asia, for the systematic annotation of synaptic proteins. SynGO experts have developed an extensive ontology to represent synaptic locations (87 terms) and synaptic processes (179 terms) and generated almost 3000 annotations of synaptic genes/proteins to these terms, based on a novel comprehensive evidence tracking system that classifies evidence according to experiment types, model systems and target engagement types (gene modifications, antibody binding etc.), using only published data sets. Using SynGO, we observed that synaptic genes are exceptionally well conserved, relatively much more intolerant to mutations than non-synaptic genes and are associated with many brain traits, such as IQ and educational attainment, and brain disorders such as ASD, ADHD and bipolar disorder. SynGO provides a unique, publicly accessible knowledgebase (https://syngoportal.org) as a universal reference for synapse research and education, and for enrichment studies on genomic associations, mRNA profiling and proteomic data.
RESULTS
SynGO ontologies provide comprehensive frameworks for synaptic gene annotation
To systematically annotate synaptic genes, we designed a generic synapse model as a conceptual starting point, defining locations at the synapse and processes related to the synapse, and refined this model iteratively until consensus was reached among expert laboratories worldwide (Fig. 1). Subsequently, we created GO terms for Cellular Components (CC) and Biological Processes (BP) for synapses and defined their relationships. At the top level of the CC hierarchy (Fig. 2A), synaptic proteins can be described as localized to the presynapse, the postsynapse, the synaptic cleft, the extra-synaptic space and synaptic membranes (the latter term is used when no distinction is possible between pre- and postsynaptic membranes). From these high-level terms, up to 4 additional hierarchical levels were defined for pre- or postsynaptic cytosol or membrane, or organelles within these compartments. The SynGO CC ontology adds substantial precision to the preexisting GO ontology that contained 13 terms directly connected to the central ‘synapse’ term (and 19 additional terms). SynGO maintained only two of these 13 terms (Fig. 2A, green symbols) and excluded 11 (Fig. 2A, purple symbols). Some of the GO terms were replaced by similar but more precise terms, e.g. “presynaptic active zone dense projection” (GO) by “presynaptic active zone” (SynGO), others were replaced with more specific terms further down in the hierarchical SynGO ontology, e.g. instead of “symmetric synapse” and “excitatory synapse”, we created a general term “postsynaptic specialization” with first level subclassifiers “postsynaptic specialization of symmetric synapse” and “postsynaptic density”. All together, 142 SynGO CC ontology terms were designed for accurate annotation of synaptic localizations (Table S2). To visualize this elaborate ontology hierarchy and provide a standardized visualization of SynGO annotations, all CC terms populated with gene annotations in SynGO 1.0 (92/142 terms) were plotted in a circular fashion with the highest hierarchical term (synapse) in the center and each layer of subclasses in outward concentric rings (Fig. 2C, see Table S2 for all term names). SynGO did not define mitochondria as part of a specific synaptic CC, as mitochondrial proteins are already well annotated (Calvo et al., 2016; Smith and Robinson, 2018).
Figure 1. Conceptual framework of synapse ontology in SynGO.

The top-level Cellular Component (location, shown in green) and Biological Process (function, shown in blue) terms are depicted in a schematic representation of a synapse. For the full set of ontology terms, which also include all subclassifiers that further specialize terms shown here, see Figure 2 and Supplementary Table 2. *The mitochondrion is depicted for completeness, but is not part of SynGO ontology (see text).
Figure 2. Increased resolution in synaptic ontology terms.

Comparison between new terms in SynGO (orange) and pre-existing synapse ontology terms in GO (green and purple) for A) Cellular Components (CC, locations) and B) Biological Processes (BP, functions). SynGO adds resolution by creating increasingly detailed terms in a consistent systematic for Cellular Component (129 new terms) and Biological Process (212 new terms). Some existing GO terms identical to SynGO ontologies were re-used (green nodes, 13 for CC and 44 for BP) and some existing GO synapse-related terms that did not overlap with the SynGO ontologies were discarded or replaced (purple nodes, 18 for CC and 22 for BP). Supplementary Table 1 contains a complete list of pre-existing GO terms indicated in green and purple. SynGO ontology terms shown in panels A and B (in orange or green) that were populated with at least one gene annotation in SynGO v1.0 were visualized as ‘sunburst plots’, an alternative representation of tree structures, for C) Cellular Components and D) Biological Processes. The top-level terms in these CC and BP ontology trees, ‘synapse’ and ‘process in the synapse’ respectively, are represented by a white circle in the center of the sunburst. Terms on the second level of the ontology term tree, previously highlighted in A and B, are color coded as indicated in the legend. Subclassifiers in outer circles are shown in progressive darker colors. Supplementary Table 2 contains the complete list of SynGO ontology terms matching the sunburst plots.
BP terms for synaptic processes and their relationships were also defined consistently with existing GO-terms, with pre- and postsynaptic processes, synaptic organization, synaptic signaling, axonal/dendritic transport, and metabolism as main terms, with up to 5 levels of subclasses (Fig. 2B). In total, the BP ontology features 256 terms of which 212 are new. 192 of these BP ontology terms were populated with gene annotations in SynGO 1.0 and visualized in a sunburst plot (Fig. 2D, analogous to Fig. 2B, see Table S2 for all term names). Hence, these novel CC- and BP-ontologies provide a substantial innovation and also a substantially increased precision for the ontology of the synapse. Together, these ontologies provide a comprehensive structure for the systematic annotation of synaptic genes and for future computational models of synapse biology and pathophysiology.
SynGO is based on expert annotation and systematic evidence tracking
Currently available synaptic protein lists contain many unsupervised inclusions, in particular from large-scale, automated experiments expected to have substantial false positive rates. SynGO established a systematic evidence tracking protocol and annotation by synapse experts only, based exclusively on published experimental data (PubMed). The SynGO workflow (Fig. S1) was implemented in a web-interface and used by synapse experts to annotate synaptic genes. To systematically track evidence, classifications were designed for the model systems used (Fig. S2). For synaptic localization (CC), microscopy and biochemical studies were defined as the main experimental classes, each with several sub-classes. For functional studies, experimental classes were defined based on perturbation type and the methodology (assay) used to detect the consequences, again with several sub-classes (Fig. S2). These classifications were made coherent with the Evidence and Conclusions Ontology (ECO) (Giglio et al., 2018), and new ECO terms were defined. Together, these three dimensions of evidence, (i) model system/preparation, (ii) experimental perturbation and (iii) assay, provide a systematic, coherent and detailed definition of the evidence to annotate synaptic genes.
Detailed reference to these three dimensions of evidence was stored as part of each annotation (PubMed ID, figure numbers, panels, see Table S3), providing a detailed rationale for each annotation, which can be reviewed by SynGO users. For any given study, annotations were made for the species used and these were subsequently mapped to the consensus human ortholog using HUGO Gene Nomenclature Committee (HGNC) data resource (Yates et al., 2017). Annotations for orthologous genes in different species were possible and encouraged, yielding multiple annotations to the same consensus human ortholog originating from different species. In addition, we applied SynGO annotations in GO Phylogenetic Annotation (Gaudet et al., 2011) to infer annotations to evolutionarily-related genes, using the experimentally-supported SynGO annotations as evidence. In this process, an expert biocurator reviewed all experimentally-supported GO annotations for all members of a gene family in >100 species in the context of a phylogenetic tree and inferred functions of experimentally uncharacterized genes in tens of other organisms. In the current SynGO 1.0 we did not systematically annotate different splice forms of single genes, because systematic evidence for splice site-specific subcellular localizations or functions is currently sparse. In cases where studies used different approaches to reach the same conclusion, multiple annotations for the same gene to the same CC or BP terms were made frequently and were encouraged. Similarly, when evidence existed for annotating a single gene to multiple CC or BP terms (multiple locations or functions), multiple annotations were made and encouraged. Following standard GO annotation practice, the same gene/protein may be annotated at different levels along the SynGO hierarchical ontology tree. For instance, initial evidence may indicate that a protein is involved in synaptic transmission (SynGO term chemical synaptic transmission; GO:0007268), a subsequent study may reveal the protein regulates presynaptic secretion (SynGO term synaptic vesicle exocytosis; GO:0016079) and the most recent study may show that the protein regulates vesicle priming (SynGO term synaptic vesicle priming; GO:0016082).
Annotations completed by expert laboratories first passed through a quality control pipeline by the SynGO support team (Fig. S1) and were then added either directly to the SynGO database (https://syngoportal.org) or returned to the expert laboratories if further editing was required. These annotations were also deposited in the Gene Ontology annotation repository (http://geneontology.org) as GO-CAM models (The Gene Ontology, 2018). GO-CAM is an extension of the standard GO annotation format that allows more expressive annotations, e.g. specifying the cell type using Cell Ontology terms (The Gene Ontology, 2018), and multiple pieces of evidence for a single annotation. Together, this evidence tracking system, including detailed reference to the evidence (PMID, figure, panel), provides an excellent framework for comprehensive, transparent annotation of synaptic genes.
SynGO 1.0 provides 2922 expert-curated annotations on 1112 synaptic genes
Using the three dimensions of evidence tracking (model system/preparation, experimental perturbation and assay), 2922 expert-curated annotations were generated using a cumulative candidate synaptic gene lists from published (Lips et al., 2012; Ruano et al., 2010) and unpublished data resources (EU-funded projects EUROSPIN and SYNSYS, see acknowledgements), proteomic data and specific input from expert laboratories. The annotations were subjected to quality control and, typically after iterative optimization, deposited in the SynGO database and the central Gene Ontology knowledgebase (The Gene Ontology, 2018), see Fig S1. In total, we found compelling evidence for 1112 unique synaptic genes. These were admitted to the SynGO 1.0 knowledgebase. The full list of 1112 genes/proteins can be downloaded from https://syngoportal.org. For most genes, both subcellular localization (CC) and Biological Process (BP) evidence was found (60%, Fig. S3A), for the remaining 40%, evidence was lacking for either CC or BP and only one term was included. A core set of synaptic proteins was annotated to ≥3 CC or BP terms (Fig. S3B). Most evidence was obtained from studies of rodent species (Fig. S3C) of either intact tissue or cultured neurons (Fig. S3D). Microscopy and biochemical fractionation were the two main assay types used to make CC annotations, whereas BP annotations were based on a larger array of assay types assessing synaptic function (Fig. S3E). Together, these 2922 expert-curated annotations on 1112 synaptic genes, with a core set annotated to ≥3 CC or BP terms, provide an excellent annotation collection for descriptive studies, functional analyses of synaptic genes and gene enrichment studies.
The structure of synaptic genes is very different from other genes
As a first descriptive analysis, we compared basic structural features of SynGO-annotated synaptic genes with other genes. Human gene features were extracted from BioMart (GRCh38.p12) and Ensembl web services. Interestingly, synaptic genes were found to be different from other (non-SynGO) genes in many respects. Synaptic genes were on average more than twice as long as other genes (2.6 fold of non-SynGO genes, Fig. 3A), with 1.6-fold longer cDNA (Fig. 3B). The number of known protein coding transcripts was 1.7-fold higher (Fig. 3C) and the sequence of introns + exons (immature transcript length) for protein coding transcripts was more than 2 fold longer (Fig. 3D). Protein coding transcripts for synaptic genes also contained 1.4 fold more introns (Fig. 3E) and these were 1.7 fold longer (Fig. 3F).
Figure 3. Gene features compared between synaptic genes and the rest of the genome.

A) Total gene length, B) cDNA length, C) number of known protein coding splice variants, D) total length of protein coding transcripts, E) number of introns in protein coding transcripts and F) mean length of introns in protein coding transcripts. Vertical lines indicate median values for respective data distributions, which were also used to compute the percentage increase for synaptic genes. Two-sample student’s t-test were applied to log transformed data to confirm overall distributions are significantly distinct, a Wilcoxon rank-sum test was used for the count data in panels C and E, “pval” in each panel denotes the resulting p-values. Analogous comparison between SynGO and brain-enriched or brain most-expressed genes is shown in Supplementary Figure S4.
To compare SynGO genes to other brain-expressed genes, we defined two control gene sets: (A) brain-enriched genes: 6600 genes with the most brain-enriched expression patterns, i.e., maximal expression difference between brain and other tissues (Ganna et al., 2016); and (B) ‘top N’ genes most highly expressed in brain, with N equal to the number of unique genes in the SynGO set (1112). Differences between SynGO genes and control sets A and B were generally smaller in comparisons of gene size, introns and cDNA length, but still highly significant (Fig. S4A–L). Finally, we tested the possibility that SynGO annotated genes have a higher structural/topological complexity than other genes, especially more transmembrane regions (TMR), and that this may explain the observed differences between SynGO genes and others. A TMR prediction algorithm (Krogh et al., 2001) indicated that SynGO annotated genes indeed encode significantly more proteins with at least one TMR (35.2% versus 29.7% for the whole genome; p-value = 6.1e-5, using a two-sided Fisher exact test). However, when comparing SynGO annotated proteins to all membrane proteins, SynGO proteins are still significantly different to a similar extent and in all aspects indicated in Fig 3 and Fig S4A–L, see Fig S4M–R.
We also investigated the complexity of isoform expression of synaptic genes in cerebellar neurons using recently published full-length RNA sequencing data (Gupta et al., 2018). Synaptic genes expressed a higher number of distinct isoforms, as compared to non-SynGO genes, per equal read counts, than non-synaptic genes (Fig. S5).
We also analysed the number of posttranslational modifications, as important determinants of cell signalling, by testing the number of experimentally verified modifications obtained from dbPTM (Huang et al., 2016) and UniProt (Consortium, 2018) per protein and per amino acid (to correct for difference in average protein length; Fig. S6). The incidence of all major modifications, phosphorylation, ubiquitination, acetylation and S-nitrosylation appear to be all significantly higher in synaptic proteins as compared to other proteins. However, these observations might emerge, at least in part, from the fact that synaptic proteins are more extensively studied experimentally.
Synaptic genes emerged earlier in evolution than other genes, primarily in three major waves
We tested when SynGO genes emerged in evolution relative to other genes. We found that their evolution follows a pattern that differs substantially from the overall pattern for all human genes (Fig. 4A). Specifically, SynGO genes evolved primarily in three “waves” of innovation, during which modern-day synaptic genes were gained at a faster rate than other human genes. The first wave of emergence of SynGO genes, was prior to the last eukaryotic common ancestor (LECA), approximately 1800 million years (Mya) (Kumar et al., 2017). While LECA was unicellular and obviously did not form synapses, it did possess cellular machinery that would later be co-opted for the synapse, such as vesicle trafficking, exocytosis and signal reception. The second wave was prior to the last common ancestor of the eumetazoa (multicellular animals) and corresponds with the first appearance of the synapse. Among SynGO genes gained during this wave, we found strong enrichments for pre- and postsynaptic membranes and the postsynaptic density (Fig. S7B) and weak enrichments for a few synaptic processes (Fig. S7C). The third wave was prior to the last common ancestor of vertebrates, suggesting significant synaptic evolution in this period. SynGO genes gained during this last wave are enriched again for the postsynaptic density and now also the active zone; and for more specific, largely regulatory processes: regulation of synaptic organization, synapse adhesion, modulation of synaptic signaling, and regulation of postsynaptic neurotransmitter receptors (Fig. S7E). By this time, approximately 450 Mya, about 95% of all SynGO genes were already in place, with very few additional synaptic genes appearing after that point. A similar trend, albeit with smaller differences, was observed when gene duplication events were not weighted (Fig. S7). Figure 4B shows one of the few exceptions to this rule: the carnitine palmitoyltransferase gene family expanded via a gene duplication prior the last common ancestor of placental mammals, resulting in an additional, neuron-specific paralog found only in placental mammals (CPT1C), whereas other amniotes have only two paralogs (CPT1A, CPT1B) expressed primarily in other tissues. CPT1C is localized to the endoplasmic reticulum in neurons and has been shown to directly regulate the levels of AMPA receptors in the postsynapse (Fado et al., 2015). Overall, however, our analysis indicates that the synapse is highly conserved among modern vertebrates, as suggested before (Emes et al., 2008), and that 95% of the human synaptic genes in SynGO 1.0 are shared among vertebrates. As the invertebrates C. elegans and D. melanogaster have been important model organisms in synapse biology, we also explored how many paralogs emerged in these invertebrates and how many in the vertebrate lineage (until humans) for any shared gene. For both invertebrates, we found that almost 30% of all genes have a 1:1 relationship with human genes (one paralog identified in each species, Fig. 4C). For most genes, more than a single paralog is identified (‘many’) with one a single paralog in C. elegans and D. melanogaster (many;1) or more than one in all species (many:many, Fig. 4C). Interestingly for synaptic genes, we found fewer 1:1 relationships and more many:1 and many:many (Fig. 4C). This indicates that synaptic genes underwent gene duplication at a higher rate than other genes after the vertebrate/invertebrate bifurcation.
Figure 4. Synaptic genes are exceptionally well conserved.

(A) Cumulative distribution of synaptic genes (orange) and all human genes (blue), by gene age. Highlighted areas (grey) show periods of rapid gain of synaptic genes. Ages (time in Million Years Ago) are obtained from dating of gene duplication events (relative to speciation events) in PANTHER gene trees (Mi et al., 2018). Clades are shown on the y-axis, their names on the left and estimated speciation times on the right. LCA: Last Common Ancestor. LUCA: Last Universal Common Ancestor. Eras; CE: Cenozoic, ME: Mesozoic, PA: Paleozoic, NPR: Neo-Proterozoic, MPR: Meso-Proterozoic, EO: Eoarchean. Periods; NE: Neogene, PA: Paleogene, CRE: Cretaceous, JU: Jurassic, PE: Pennsylvanian, MI: Mississipian, DE: Devonian, CRY: Cryogenian, TO: Tonian, ST: Stenian, CA: Calymmian. Note that unlike the phylostratigraphic approach (Domazet-Lošo et al., 2007), ages reflect not simply the oldest traceable gene age, but explicitly consider gene duplication, by adding a fractional count for each duplication event along the evolutionary path to a modern gene (see Methods for details). This is critical due to the prevalence of gene duplication in the evolution of eukaryotic genomes. (B) Evolution of the family of genes containing CPT1C (highlighted in grey), a synaptic gene annotated in SynGO. There are three tissue-specific isoforms in this family; CPT1A (liver), CPT1B (muscle) and CPT1C (brain). The latter is only found in placental mammals. C) Orthology relations between human genes and their counterparts in Caenorhabditis elegans and Drosophila melanogaster were classified by the number of paralogs matching respective organisms. For example, the many-to-one group contains all human genes that have undergone gene duplication from their ancestral gene while the given model organism has not.
Synaptic gene expression is enriched in the brain
We predicted that expression levels of SynGO genes is higher in the brain than in other tissues. To test this, we compared tissue specific expression using different gene-sets in GTEx v7 (Consortium et al., 2017). Brain enrichment was computed by dividing the number of transcripts detected in brain over those in other tissues, expressed as log2 fold change (see Methods) and plotted against the expression level of this transcript in brain. As shown in Fig S8A, expression of SynGO genes is generally higher in brain than in other tissues, although some SynGO genes are in fact de-enriched in brain (below horizontal line at zero). SynGO genes with high expression levels in the brain are, on average, enriched to a similar extent as those with lower expression levels in the brain (Fig. S8A–B).
We compared brain expression enrichment for different SynGO CC and BP terms. Several terms within these ontologies, especially in BP, are predicted to be highly brain specific, e.g., trans-synaptic signaling, active zone assembly or postsynaptic density organization, whereas others are expected to be similar to terms outside the synapse and outside the brain, e.g., phosphatase and kinase pathways. Indeed, specific analyses of individual SynGO terms in CC and BP ontologies revealed a large degree of heterogeneity among proteins annotated for different terms (Fig. S8C–D). The pre- and postsynaptic plasma membranes and especially the postsynaptic density contain proteins that are highly significantly enriched in brain (Fig. S8C). Active zones and synaptic vesicles, but not dense core vesicles, also contain significantly enriched proteins (Fig. S8C). For BP, a strong enrichment was observed for most major synaptic processes except metabolism and transport (Fig. S8D). Taken together, these data indicate that expression of SynGO genes is higher in brain than in other tissues, especially for ‘synapse-specific’ locations/functions.
Synaptic proteins are exceptionally intolerant to mutations
The frequency of coding variants in the general population is an indication of the functional constraints. To test whether SynGO genes have the same loss-of-function mutation incidence as other genes, we used the probability of being loss-of-function intolerant (pLI) obtained from the Exome Aggregation Consortium (ExAC, (Karczewski et al., 2017). The pLI was compared between all SynGO genes and other genes. A major difference in loss-of-function intolerance was observed; SynGO genes are exceptionally intolerant to loss-of-function mutations relative to non-SynGO, brain-enriched and ‘top N’ most highly brain expressed control genes (Fig. 5A–C). The distribution of high pLI values was similar among different CC and BP terms (Fig. 5D–E). In the CC ontology, pLI scores were particularly high (mean value ≥ 0.7) for PSD and active zone genes (which also contribute to parent terms). Interestingly, the synaptic vesicle and dense core vesicle annotated genes showed much lower pLI scores (mean value ≤ 0.5). Taken together, these data indicate that synaptic genes are exceptionally intolerant to loss-of-function mutations, suggesting that functional constraints and evolutionary selection pressure on synaptic genes are much stronger than for other genes.
Figure 5. Gene pLI scores, indicating probability of intolerance to Loss of Function (LoF) mutation.
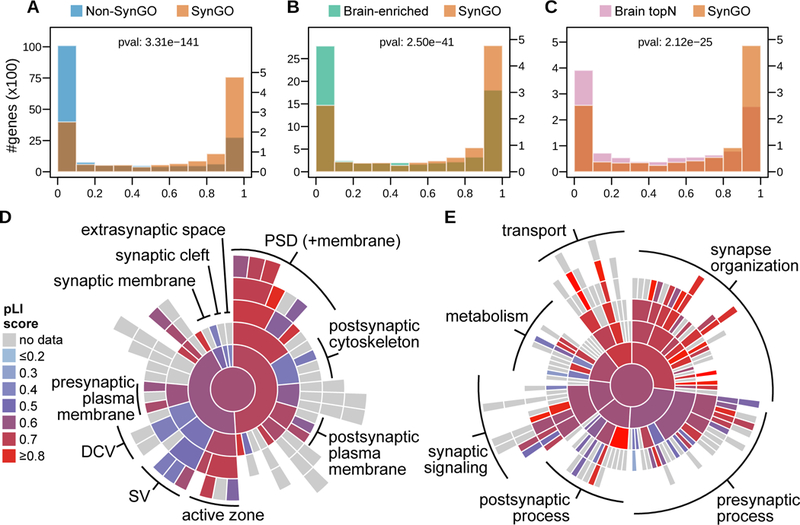
pLI scores compared between synaptic genes and A) rest of the genome, B) brain enriched genes and C) 1112 genes most highly expressed in brain. Two-sample Wilcoxon signed-rank test p-values indicate that overall distributions are significantly different (denoted as “pval” in panels A-C). Mean pLI scores for respective synaptic genes annotated against D) SynGO Cellular Component terms and E) Biological Process terms are visualized in a sunburst plot, for terms with at least 5 unique annotated genes with a pLI score. Terms where annotated genes are typically LoF tolerant are shown in blue, while terms with mostly LoF intolerant genes are shown in red. Note that the CC and BP sunburst plots are aligned with Figures 2C and 2D, respectively.
Synaptic proteins annotated to closely related SynGO terms are more likely to interact
SynGO proteins annotated to the same ontology term or to closely related terms are predicted to often be in the same protein complexes or be involved in the same process and are thus more likely to interact. This prediction was tested using protein-protein interaction data available through StringDB v10.5 (Jeanquartier et al., 2015), using the ‘high confidence’ interaction filter. Proteins reported to be in the same protein complexes were significantly overrepresented in synaptic genes annotated against the same CC term in SynGO (Fig. S9A) and also for the same BP term (Fig. S9B). Hence, synaptic proteins annotated for the same CC or BP term are much more likely to interact and, vice versa, interacting synaptic proteins are much more likely to have the same localization or be part of a similar process.
Different synaptic preparations contain largely overlapping synaptic protein collections
SynGO enables the analysis of existing, large-scale proteomics data from biochemical preparations enriched for synaptic components. We extracted data from 19 well-described and quantitative proteomic studies on 3 biochemical preparations enriched for synaptic components: (A) synaptosome fractions (7 studies, (Bayes et al., 2017; Biesemann et al., 2014; Chang et al., 2015; Filiou et al., 2010; Moczulska et al., 2014; Pandya et al., 2017; Wilhelm et al., 2014)); (B) postsynaptic density fractions (PSD, 6 studies, (Bayes et al., 2012; Bayes et al., 2017; Bayes et al., 2011; Collins et al., 2006; Pandya et al., 2017; Roy et al., 2018)) and (C) active zone or docked vesicle fractions (5 studies, (Abul-Husn et al., 2009; Boyken et al., 2013; Morciano et al., 2009; Morciano et al., 2005; Phillips et al., 2005)). Synaptosome studies have identified between 894 and 3331 proteins (Fig. 6A). These protein collections contained between 17 and 39% of the SynGO CC annotated proteins. Together, 80% of proteins with a SynGO CC annotation were detected in at least one of the synaptosome preparations. PSD analyses typically identified smaller numbers of components, up to 1207 (Roy et al., 2018).
Figure 6. Representation of SynGO proteins in large scale proteomic analyses of synaptic (sub-)fractions.

Proteins identified in a selection of published proteomic analyses of biochemically purified synaptic fractions (synaptosomes, postsynaptic densities (PSD) and active zone) were analyzed for SynGO annotated proteins. A) The number of unique proteins detected in the selected studies, blue: synaptosomes; green: PSD; pink: active zone, orange: subset of proteins that are CC annotated in SynGO. B) overlap among SynGO CC annotated proteins (orange) and ‘consensus sets’ for synaptosome (blue), PSD (green) or active zone (pink), defined as proteins identified in at least three datasets described in panel A (matching respective compartments). Supplementary Table 4 details the selected proteomics studies and their identified proteins.
A consensus set of proteins identified in at least three proteomic datasets per compartment contains 2621 unique proteins for synaptosome, 791 for PSD and 88 for active zone. The PSD components showed a large degree of overlap (90%) with the synaptosome consensus set, with only 76 proteins exclusively identified in the PSD consensus set (Fig. 6B). 73% (1906 proteins) of the synaptosome consensus set is not found in the PSD consensus set, 78% (2033 proteins) is not found in SynGO 1.0 and in total 61% (1596 proteins) of the synaptosome consensus set was not found in either PSD, active zone or the SynGO database.
Active zone preparations yielded smaller numbers of proteins, maximally 249 (Fig. 6A). These protein collections contained between 35 and 62% of SynGO annotated proteins, slightly more than synaptosome and postsynaptic density percentages. A total of 2084 proteins currently lacking SynGO 1.0 Cellular Component annotation were identified in at least three proteomics datasets of synaptosome, active zone or PSD subcellular fractions (Fig. 6B).
Taken together, these data indicate that SynGO aids in dissecting overlap and differences in large synaptic protein sets that were purified in different synaptic preparations. Many proteins identified in such fractions await experimental validation before they can be annotated to SynGO CC and BP terms.
Synaptic genes are enriched among genes associated with various brain traits
Results from large scale genetic studies are often used to test for association of a trait of interest with a set of functionally related genes. Such tests gain power with a higher confidence definition of the gene sets used. We predicted that expert-curated, evidence-based SynGO genes show robust associations with experimental data on brain traits and that SynGO gene sets are more strongly associated than existing synapse gene sets. We tested this prediction on genome-wide association study (GWAS) data for three continuous traits, educational attainment (EA) (Lee et al., 2018), Intelligence Quotient (IQ) (Savage et al., 2018) and human height (Wood et al., 2014), and for five brain disorders, ADHD (Demontis et al., 2016), autism spectrum disorder (ASD) (Grove, 2019) schizophrenia (Pardinas et al., 2018), bipolar disorder (Psychiatric, 2011) and major depression (Wray et al., 2018). The association with gene-sets based on SynGO genes and previously annotated synaptic genes in GO were compared for these traits to three control gene sets: all other genes, other genes with similar brain-enriched expression and genes with similar (high) conservation. Two analysis methods were used, MAGMA (de Leeuw et al., 2015) and linkage disequilibrium score (LDSC) regression analysis (Bulik-Sullivan et al., 2015). These two methods have similar goals, yet rely on different assumptions and statistical algorithms. LDSC tests for enrichment of SNP-based heritability for various traits in gene-sets, while MAGMA tests whether gene-level genetic association with the various traits is stronger in specific gene-sets. Both methods account for confounders like gene size and linkage disequilibrium in different ways.
Fig 7A shows gene-set analyses using MAGMA for ASD. We observed a highly significant association of the sets involving presynaptic active zone and the postsynaptic density (CC-terms), for presynaptic functions and synapse assembly (BP-terms; Fig. 7A). These associations remained significant, albeit typically less strongly, when conditioned on brain gene expression values (Fig. 7A, dark colors), or conditioned on homology conservation scores (Fig. S10A–B). Interestingly, one set of SynGO genes, the postsynaptic ribosome genes, was not significant when compared to all other genes, but became significant when conditioned on brain-expressed genes. Hence, gene-set analysis for SynGO genes in ASD GWAS data reveals new and highly significant associations with pre- and postsynaptic compartments and presynaptic processes.
Figure 7. Enrichment study of SynGO genesets in GWAS.

A) Magma analysis of Autism Spectrum Disorder revealed enrichment of SynGO Cellular Components (light blue) and Biological Processes (light green). Conditioning by gene expression values (GTEx) typically reduced the signal, except for postsynaptic ribosome, as visualized in dark blue and dark green. Only SynGO ontology terms significant after Bonferroni correction at α 0.05 (Pbon=0.05/154, vertical dashed line) in the latter analysis are shown. B) Overview of significantly enriched SynGO ontology terms in various GWAS. P-values from Magma analysis, with conditioning by gene expression values, were color-coded from blue to red for all ontology terms significant after Bonferroni correction at α 0.05. Additional studies are available in Supplementary Figure S10 and Supplementary Table 6.
Similar analyses were performed for all other traits listed above (Fig. 7B). SynGO genes were significantly associated with educational attainment, especially genes annotated with postsynaptic localizations and processes. Five SynGO ontology terms were associated with intelligence, but none were associated with human height. Furthermore, many ontology terms were associated with ADHD, especially ontologies involving locations and functions related to the presynaptic active zone and presynaptic assembly (Fig. 7B). Finally, strong associations of both pre- and postsynaptic terms were observed for ASD, and for postsynaptic processes with bipolar disorder (Fig. 7B). Very similar conclusions were reached when additionally conditioning on homology conservation scores (Fig. S10A–B) and when LDSC regression analysis was used instead of MAGMA (Fig. S10C–D).
Taken together, SynGO genes are strongly enriched in GWAS results for brain-related traits, with new links becoming manifest between ASD and the synapse; ADHD and presynaptic genes; educational attainment and postsynaptic processes and several other links between synaptic genes and bipolar disorder or intelligence.
Synaptic genes are enriched among de novo protein-coding variants for four brain disorders
In addition to GWAS studies, exome sequence studies of de novo coding variation have recently become available, allowing us to perform enrichment studies in SynGO genes among all de novo coding variation detected from several brain disorder patient populations. We tested for enrichment in SynGO genes of protein truncating (PTV) and missense mutations that were previously reported to be associated with 4 brain diseases: Developmental Delay (DD, 4293 trios), Intellectual Disability (ID, 971 trios), ASD (3982 trios) and Schizophrenia (SCZ, 1024 trios), with non-syndromic Congenital Heart Defect (CHD, 1487 trios) and unaffected siblings (UNAFF SIB, 2216 trios) as non-affected classes (see Table S7 for all references). PTV and missense mutations were filtered if they were present in the ExAC reference database (Lek et al., 2016), and de novo enrichment in each group was compared against a mutation model that estimates the expected mutation rate among each gene set. SynGO gene enrichment was compared to previously annotated synaptic genes in GO and to matched brain-enriched genes: control gene sets with similar brain enrichment/specificity and gene size exactly matching SynGO genes. SynGO genes were robustly enriched for all 4 disease classes (Fig. 8A–B), most strongly for ID (>2 fold enriched), but also for DD (1.6 fold enriched), ASD (1.4 fold enriched) and SCZ (1.3 fold enriched). All these enrichments for SynGO genes were substantially stronger than for synaptic genes previously annotated in GO, especially for DD and ID (Fig. 8A). PTVs and missense mutations in SynGO genes were not enriched for CHD-NS and in unaffected siblings (Fig. 8A).
Figure 8. Enrichment for protein truncating (PTV) and missense mutations in SynGO genes.

A) synaptic genes are more enriched for PTV and missense mutations among patients with brain disorders compared to the control set of GTEx brain expressed genes of equal size and compared to pre-existing synaptic annotations in GO. For each comparison the p-values from a binomial test against mutation model expectation are shown as text, their median fold-enrichment as a circle (color coded by gene set) and the 10~90% quantile of fold-enrichment as a horizontal line. Patient populations with brain disorders: Developmental Delay (DD), Intellectual Disability (ID), Autism (ASD) and Schizophrenia (SCZ). As a control group we included patient populations with non-syndromic Coronary Heart Disease (CHD-NS) or unaffected siblings (UNAFF-SIB). B) Group-level effects were tested for the patient populations described in panel A. The median disease p-value per ontology term (with at least 5 unique annotated genes) was visualized for C) Cellular Components and D) Biological Processes. Note that the CC and BP sunburst plots are aligned with Figures 2C and 2D, respectively.
To test the distribution of these enrichments within SynGO ontology terms, we plotted the enrichment p-values for each term as false colour values in SynGO CC and BP ontologies (Fig. 8C–D, Table S7). Highly enriched gene sets were unevenly distributed among locations and processes. For subcellular locations (CC) the strongest associations were observed in postsynaptic density and active zone, together with pre- and post-synaptic plasma membrane terms (Fig. 8C). For Biological Processes (BP), the strongest associations accumulated in presynaptic processes, especially synaptic vesicle exocytosis and generation of the presynaptic membrane potential, with further association in postsynaptic processes and synapse organization (Fig. 8D). Together these data show that SynGO genes were strongly enriched for de novo PTV and missense variation in all four brain disorders. Importantly, SynGO genes are more robustly enriched than GO-genes previously annotated to the synapse.
DISCUSSION
This study describes SynGO, the first comprehensive knowledgebase that provides an expert community consensus ontology of the synapse. The ontology and annotations accumulated in SynGO provide a comprehensive definition of synapses, new unique features of synapses, new links between synapses and brain disorders and excellent future perspectives as an up-to-date interactive community resource. We deliver proof of principle application of SynGO 1.0 for the analysis of gene/protein properties, evolutionary conservation, mRNA expression, loss of function tolerance, protein-protein interaction, enrichment in GWAS data for brain-related traits and brain disorders, and in rare de novo coding variation for neurodevelopmental disorders including schizophrenia.
SynGO provides a major step forward in defining synapses
Adequately defining a biological system like the synapse requires a coherent and logical definition of its components, their relationships and how biological functions emerge from these. The SynGO ontology is the first ontology to provide such definitions coherently for the synapse. The SynGO 1.0 ontology has defined 87 Cellular Component (CC) and 179 Biological Process (BP) terms, designed in consensus by expert laboratories worldwide. Previous models suffered from the lack of a coherent, top-down design of synapse-related ontology terms and relations. Consequently, many heterogeneous terms, both specific and general, were positioned directly under the master term ‘synapse’ (see Fig. 2A–B).
Defining synapses adequately also requires the underlying annotations to be accurate and reliable. SynGO is exclusively based on published, expert-curated evidence and detailed classification of this evidence. This is a substantial innovation that provides accountability for decisions made by experts and allows for structured discussions and resolving annotation disputes, in particular in the web-based SynGO resource (https://syngoportal.org). Moreover, different types of evidence can now be integrated in statistical models in a differential manner. For instance, evidence that is considered very strong can be given a higher weight than evidence less so. Finally, providing evidence-tracking tools to (future) expert contributors engages the synapse research community, ensuring that SynGO annotations are based on solid evidence. Hence, the new SynGO evidence tracking system provides a fundamental step forward for annotation accuracy, transparency and expert-engagement, and a solid basis for future refinements in a biology-driven overall synaptic ontology framework.
Using SynGO 1.0 annotations, we show that the SynGO ontology indeed defines the synapse adequately. We show that (i) SynGO genes are indeed more evolutionary conserved than other genes (Fig. 4), as previously shown (Emes et al., 2008), and (ii) that synaptic genes are indeed brain enriched, with brain-specific aspects of synapses particularly enriched, as opposed to generic aspects, like transport and metabolism (Fig. S8). Furthermore, (iii) SynGO proteins documented to interact in published protein-protein interaction data are much more likely to be annotated to the same ontology terms (Fig. S9). Finally, (iv) enrichment of synaptic genes among genes associated with all tested traits in GWAS data (Fig. 7) and among rare variants causing neurodevelopmental disorders (Fig. 8), is without exception stronger for SynGO genes than for gene-sets previously annotated to the synapse. Together these four groups of observations confirm that SynGO defines synapses adequately, consistent with previous findings, and consistently outperforms previous gene set resources used in gene-set analyses.
While the definition of a synapse is now becoming accurate and reliable, the definition of synaptic genes remains precarious. No cellular compartment operates in isolation. Components move in and out and no gene product, also not of SynGO genes, is expressed exclusively in the synapse. Since GO annotations for location (CC) and process (BP) are independent, genes that regulate synaptic function do not necessarily have to be located in the synapse. In principle, this opens the possibility of annotating for instance transcription factors that regulate expression of synaptic genes. SynGO 1.0 currently only lists few of these examples, but it will eventually be useful to include such genes in SynGO annotation. Such genes can be easily excluded from an analysis by filtering for CC terms, i.e., only genes that have a confirmed synaptic location will be retained. Other regulatory aspects of synapse function may include proteins derived from the extracellular matrix, axon, dendrite or glia, which are not yet accommodated in SynGO 1.0.
Taken together, SynGO provides a comprehensive definition of the synapse with new, elaborate and consensus ontologies, accurate and transparent evidence tracking and close to 3000 validated annotations. SynGO is ready to serve as a universal reference in synapse biology and for enrichment studies using –omics data, but also to form a fundamental component of future computational models to help understand synaptic computation principles in the brain and their dysregulation in disease.
SynGO discovers unique features of synaptic genes and new disease links
In addition to adequately defining synapses, SynGO also allowed us to identify several novel features of synapses and synaptic genes/proteins. First, we show that synaptic genes are structurally very different from other genes (Fig. 3). Second, nearly all synaptic genes have evolved prior to the last common ancestor of all vertebrates, >450M years ago, much earlier than the average for other human genes (Fig. 4). Third, synaptic genes are exceptionally intolerant to mutations (Fig. 5). We find that synaptic genes have accumulated more coding and non-coding sequence, which may have served to expand their transcriptional regulatory repertoire and diversification of functions of the encoded proteins. Moreover, larger genes with more intron-exon boundaries may have given rise to more alternatively spliced variants; a prediction that may soon become validated with the introduction of new long-read RNA sequencing. Also, mechanisms of gene duplication and splicing have generated expansion of synaptic gene diversity. Interestingly, as synaptic genes are found highly intolerant to mutation this diversification must have come with incorporating new essential synaptic functions, such as in features of plasticity, contributing to accelerating computational capabilities of the brain during evolution.
Synaptic dysregulation is central to many brain disorders (‘synaptopathies’). SynGO analyses described here strengthen the links between synapses and many brain traits (Fig. 7–8). Many SynGO CC and/or BP terms are enriched among genes associated with educational attainment, intelligence, ADHD, ASD and bipolar disorder. In particular, analysis of SynGO suggests a link between educational attainment and postsynaptic processes. Furthermore, these analyses provide better insights in links between ADHD and both pre- and postsynaptic genes, between ASD and presynaptic genes (in addition to the well-known links to the PSD, see (Bourgeron, 2015)) and between bipolar disorder and postsynaptic genes. One informative achievement of SynGO analyses is that, due to detailed structure of the SynGO ontology, genetic risk for each disease was mapped to specific synaptic locations and processes. The mapping resolution to specific terms is currently limited by the small number of genes/proteins annotated in some sub-classes in levels 3 and down. More synapse research is necessary to drive this refinement to saturation and allow more specific and definitive associations between genetic risk for brain disorders and distinct synaptic locations and processes.
SynGO is expected to grow as an expert community effort
Although SynGO 1.0 contains 2922 annotations, this is still only a fraction of all relevant information available in scientific literature. Only for a core set of proteins, SynGO 1.0 contains three or more annotations per protein. A concerted effort by all experts involved in synapse research will help to uncover a larger fraction of available information on synapses and further improve the impact of SynGO. The publicly accessible SynGO portal has been optimized to make such efforts with a user-friendly interface and stored credits for each annotator.
SynGO 1.0 contains 2922 annotations against 1112 genes, but proteomics studies of synaptic preparations implicate a few thousand proteins in synapses (Fig. 6). An unknown fraction of these synaptic candidate proteins will prove to be bona fide synaptic, for which the experimental evidence is currently lacking. It is important to note that biochemical purifications cannot purify synapses or synaptic compartments to completeness and some candidate proteins will remain false positives. SynGO 1.0 does not include these candidates by default to avoid low confidence analyses with SynGO data. However, they can be downloaded from the SynGO database for validation studies. SynGO is also working together with UniProt (UniProt, 2018) to accumulate information on available antibodies to facilitate this validation.
Using the public SynGO interface (https://syngoportal.org), SynGO ontologies and gene annotations can be used for enrichment analyses of any new data set (genomic, mRNA or protein) and differences between experimental and control groups can be computed and visualized using SynGO visualization tools (Fig. 1, Fig. 2C–D). The SynGO ontologies and annotations are also fully integrated into the central GO resource (http://geneontology.org), and are made available as part of standard GO releases, so that this information is automatically included in all of the myriad analysis environments and tools that use the GO. SynGO annotations are available as both standard GO annotations (http://geneontology.org/docs/go-annotations/) and as GO-CAM models (https://geneontology.cloud/browse/g:SynGO).
Proteins that function in different types of synapses are systematically annotated in SynGO. However, SynGO 1.0 and currently published data do not yet provide sufficient resolution to define individual synaptic proteomes (synaptomes) down to specific synapse populations, which will be important to predict function, e.g. being facilitating or depressing, or being inhibitory or excitatory, and to identify changes in disease. Biochemical purifications or other systematic studies of specific synapse populations will be required to establish such specific synaptomes. Until such data become available, the currently available single cell mRNA resources can be a proxy to define which synaptic genes are expressed in specific neuronal populations. Hence, continued research in the synapse field provides excellent opportunities to further improve and expand SynGO, while, conversely, SynGO can provide the conceptual framework and be a key hypothesis generator for such future studies.
The approach described here, including the novel evidence tracking and multimodal analyses, may also provide a foundation for higher fidelity annotation of other systems, other parts of neurons, other brain cells or non-neuronal cells and systems. Eventually, such efforts will provide a more complete picture of biological processes and common themes, e.g. in secretion principles or signal detection/integration, between synapses and other systems.
Conclusion
Taken together, SynGO provides the scientific community with a public data resource for universal reference in synapse research, which is fully integrated in the Gene Ontology resource (http://geneontology.org), and ready for online gene enrichment analyses. By the engagement of the synapse research community, SynGO aims at reaching saturation to establish a truly comprehensive definition of the synapse. SynGO already brings together many expert laboratories, but actively seeks participation of additional experts to annotate new synaptic genes and/or refine existing annotations. A user-friendly interface (https://syngoportal.org) supports submission of such contributions, which will be reviewed by domain experts before being admitted to SynGO.
STAR METHODS
CONTACT FOR REAGENT AND RESOURCE SHARING
Further information and requests for resources and reagents should be directed to and will be fulfilled by the Lead Contact, Matthijs Verhage (matthijs@cncr.vu.nl).
METHOD DETAILS
Synaptic gene ontologies and integration into GO
Ontology terms in SynGO v1.0 were compared to pre-existing synaptic ontologies in the GO database prior to the starting date of SynGO (2015–01-01). A snapshot of the GO database representing the state at 2015–01-01 was obtained from http://purl.obolibrary.org/obo/go/releases/2014–12-22/go.obo (the last release in 2014) and converted into a directed graph using the iGraph R package (http://igraph.org). To construct the CC and BP graphs in Fig 2 we first created a tree from the SynGO v1.0 ontologies and classified terms that were present in the GO snapshot as ‘reused’. Next, pre-existing synapse related terms that were not used by SynGO, indicated as purple nodes in Fig 2, were defined as subclassifiers of these ‘reused’ terms within the GO snapshot. Finally, we restricted resulting terms to match the scope of SynGO v1.0 (typical glutamatergic and GABA-ergic synapses). Terms that further specialize parent terms into serotonergic-, dopaminergic-, cholinergic-synapses, neuromuscular junctions, or ‘regulation of’ terms, were not taken into account in this evaluation of candidate terms for re-use by SynGO. Graphs in Fig 2 were visualized using a force-directed layout algorithm in Cytoscape (Shannon et al., 2003).
SynGO ontologies and annotations were integrated into the existing ontologies within the GO database and will continuously be updated as the SynGO project expands synaptic ontologies and adds annotations in the future. These GO ontologies are available in the ‘goslim_synapse’ subset, its most recent version is always available at http://purl.obolibrary.org/obo/go/subsets/goslim_synapse.obo. Respective SynGO annotations are translated when exported to GO, e.g., annotations against ‘process in the presynapse’ are stored in GO as ‘biological_process(GO:0008150) occurs_in presynapse(GO:0098793)’. The identifier of such terms that only exist in SynGO starts with “SYNGO:”, whereas terms also available in GO have identifiers that start with “GO:” (as seen in the SynGO terms list in Table S2). SynGO annotations as integrated into GO are available through existing GO tools and websites, analysis on the SynGO subset is possible by filtering for annotations with the ‘contributor=SynGO’ property. All data from the SynGO consortium together with purpose-built analysis tools and community engagement are available through the SynGO website at https://syngoportal.org.
Gene expression data
The “brain-expressed” control set consists of genes that were expressed in significantly higher levels in brain compared to other tissues in Genotype Tissue Expression Consortia (GTEx) data (Ganna et al., 2016). The control set with “brain topN” was defined as the N highest expressed genes in brain, where N was set to the number of unique genes annotated in SynGO v1.0. The highest expressed genes were computed by ranking the average gene-expression levels (in RPKM) from all brain samples in GTEx (Consortium et al., 2017) version 6 (GTEx_Analysis_v6_RNA-seq_RNA-SeQCv1.1.8_gene_rpkm.gct.gz).
For the brain enrichment analysis of synaptic genes in Fig S8 we computed the mean fold change comparing brain to all other tissues for each gene in the GTEx (version 7) data set. To examine enrichment, we applied a Wilcoxon Rank-Sum test for each SynGO ontology containing at least 5 genes. We used a one-sided hypothesis test in order to test whether the genes in the annotation are more brain expressed than expected under the null.
Gene features
Gene features described in Fig 3 and S4 were extracted from the BioMart (Smedley et al., 2015) Ensembl Human genes GRCh38.p12 dataset and the Ensembl REST API Endpoints (release 95). Total gene length was computed using the start_position and end_position BioMart attributes (gene start and end, in base pairs). All known splice variants per gene were obtained through BioMart, from which the number of protein coding splice variants were counted using the transcript_biotype attribute. cDNA length was extracted from gene sequences provided through the Ensembl REST API with ‘mask_feature=1’ parameter, and analogously all transcript exonic and intronic regions were obtained.
Isoform counts from full-length RNA sequencing
From our recent publication (Gupta et al., 2018) we isolated full-length long reads that were expressed in neuronal subtypes, namely external granular layer neurons, internal granular layer neurons and Purkinje cells and had been attributed to a spliced protein coding gene. Subsequently, we considered only genes that had 20 or more such reads and split this gene list into two subsets: those annotated in SynGO and its complement. These groups differed substantially in the number of reads per gene. In order to normalize this, we randomly selected 10 full-length reads for each gene, resulting in two gene lists (SynGO and non-SynGO) with exactly 10 reads each. We then counted the number of distinct isoforms that these 10 reads described for each gene and repeated this subsampling process 1000 times.
Conservation of synaptic genes
Cumulative distribution of genes by gene age: Gene trees, covering ~95% of human genes, were obtained from the PANTHER resource (Mi et al., 2018). Gene duplication events were dated relative to the earliest speciation node descending from the duplication. Trees were then pruned to contain only human paralogs, and the root of the tree (this ensures that fractional gene counts will add up to the total number of human genes). Each human gene was then traced back through the pruned tree to the root of the tree, and the number of branches was counted; this gives the total number of duplications (plus one, for the root) along the path to the root. Then, for each human gene, for each duplication (and root node) along the path from the gene to the root, a fractional count of 1/total was added to the count of genes that evolved at the date of that node. This process yields a count of human genes gained over each period of evolution, including gene duplication events. Estimated speciation times were taken from the TimeTree resource(Kumar et al., 2017). The tree of CPT1C-related genes was obtained from the PANTHER website and can be accessed, together with additional information about the sequences and a multiple sequence alignment, at http://pantherdb.org/treeViewer/treeViewer.jsp?book=PTHR22589&species=agr. For enrichment analysis of synaptic genes at different periods of evolution, we extracted reconstructed ancestral genomes from the Ancestral Genomes resource [PMID: 30371900], and used the set of human “proxy genes” for each ancestral gene. The specific ancestral genomes were obtained from the following URLs:
http://ancestralgenomes.org/species/genes/(list:genes/Metazoa-Choanoflagellida/Homo%20sapiens)
http://ancestralgenomes.org/species/genes/(list:genes/Bilateria/Homo%20sapiens)
http://ancestralgenomes.org/species/genes/(list:genes/Craniata-Cephalochordata/Homo%20sapiens)
http://ancestralgenomes.org/species/genes/(list:genes/Euteleostomi/Homo%20sapiens)
For each ontology term we applied a 1-sided Fisher exact test with ‘greater than’ hypothesis to compare genes only found in the ‘after’ set with all genes in the ‘before’ set. To find enriched terms within the entire SynGO ontology, we first selected the most specific term where each ‘gene cluster’ (unique set of genes) is found and then applied multiple testing correction using False Discovery Rate (FDR) on the subset of terms that contain these ‘gene clusters’. For human-C. elegans and human-D. melanogaster orthologs, we used the “ancestral genome comparison” functions available in the Ancestral Genomes resource, to obtain the genes in each genome (e.g. human) that descend from each gene in the bilaterian common ancestor (“inparalogs”). We used this information to match up inparalog groups in the two genomes being compared, to obtain sets of orthologs between those genomes; e.g. the inparalog group of human gene(s) that descend from a given bilaterian ancestral gene are all orthologs of the inparalog group of C. elegans gene(s) that descend from that same ancestral gene. We classified each ortholog set as either 1:1, 1:many, many:1 or many:many depending on the number of inparalogs in each organism (i.e. whether there were gene duplications after speciation). We then calculated the proportion of genes (either all genes, or only SynGO genes, with at least one ortholog between human and a given model organism) that are in each type of ortholog set.
Large scale protein-protein interaction data
StringDB (Szklarczyk et al., 2015) 10.5 human interactions (“9606.protein.links.detailed.v10.5.txt”) were filtered by combined score (700, high confidence) and experimental evidence (400, medium confidence). StringDB PPIs then were matched to SynGO HGNC annotated genes by gene symbol, or alternative names (“9606.protein.aliases.v10.5.txt”) for cases without a match. The distance between a pair of SynGO genes was defined as their path distance. For the CC model, the path distance between a membrane term and it’s integral, anchored or extrinsic sub-classes (e.g., from SV membrane to anchored component of SV membrane) was set to zero. For the null distribution we computed all path distances within the CC or BP graph between any pair of all SynGO genes.
Proteomics of synaptic fractions
Proteins identified in selected proteomics studies shown in Fig 6 were mapped to human gene identifiers (HGNC) using the https://www.uniprot.org ID mapping service and mapping tables provided through https://www.genenames.org (Table S4). Keratins were considered an external contaminant and therefore excluded from downstream analysis. The Venn diagram was generated using the ‘eulerr’ R package.
GWAS datasets
GWAS summary statistics for 8 traits were collected from the following resources; ADHD (Martin et al., 2018), Autism Spectrum Disorder, Bipolar Disorder (Bipolar et al., 2018) and Major Depressive Disorder(Wray et al., 2018) from https://www.med.unc.edu/pgc/results-and-downloads, Educational Attainment(Lee et al., 2018) from https://www.thessgac.org/data, Height (Wood et al., 2014) from https://portals.broadinstitute.org/collaboration/giant/index.php/GIANT_consortium_data_files, Intelligence (Savage et al., 2018) from https://ctg.cncr.nl/software/summary_statistics, Schizophrenia (Pardinas et al., 2018) from http://walters.psycm.cf.ac.uk/.
QUANTIFICATION AND STATISTICAL ANALYSIS
Magma gene-set analysis
First MAGMA gene analysis (de Leeuw et al., 2015) was performed using the 1000 Genome Phase3 reference panel for European population by assigning SNPs to genes within a 2kb upstream and 1kb downstream window for 20,319 genes. The default model (SNP-wide mean) was used. Then MAGMA gene-set analyses were then performed for SynGO and original synaptic GO terms. For SynGO, one additional set with all SynGO genes was added, and in total 154 terms with at least 5 annotated (unique) genes were tested. For original GO, 5 additional sets; all synaptic genes, all BP genes, all CC genes, presynapse and postsynapse were added, and in total 96 terms with at least 5 annotated (unique) genes were tested. The gene set analyses were performed with the following three conditions for each trait: 1) no additional covariate, 2) conditioning on brain and average expression across all tissue types based on GTEx v7 RNA-seq dataset (Consortium et al., 2017), 3) conditioning on brain and average expression, and the level of conservation of the genes. GTEx v7 RNA-seq data was obtained from https://gtexportal.org. The homology conservation scores in Fig S10 represent the level of conservation of genes, measured by the number of species with homolog genes using 65 species available through BioMart. Bonferroni correction was performed for each analysis separately (Pbon=0.05/154 for SynGO and 0.05/96 for GO). Statistical results are available in Table S6.
LDSC geneset analysis
To assess the contribution of each SynGO term to disease/phenotype heritability, we applied Stratified LD-Score Regression (S-LDSC) (Finucane et al., 2015; Gazal et al., 2017) to binary gene set annotations constructed with a ±100KB window around each gene as done in previous work (Finucane et al., 2018; Zhu and Stephens, 2018). In our analyses, we conditioned on the 75 functional annotations in the baseline-LD model (Gazal et al., 2017), an annotation containing all 23,987 protein-coding genes with a ±100KB window, as well as brain-enriched genes (see above), and a continuous annotation representing the conservation score of each gene. For each gene set from SynGO or pre-existing synaptic GO annotations, we assessed the statistical significance of the gene set annotations standardized effect size τ*, (defined as the proportionate change in per-SNP heritability associated to a one standard deviation increase in the value of the annotation, conditioned on other annotations included in the model (Gazal et al., 2017)) based on Bonferroni correction. Statistical results are available in Table S6.
DATA AND SOFTWARE AVAILABILITY
All data from the SynGO consortium together with purpose-built analysis tools and community engagement are available through the SynGO website at https://syngoportal.org.
Supplementary Material
ACKNOWLEDGMENTS:
SynGO was funded by The Stanley Center for Psychiatric Research at The Broad Institute of MIT and Harvard. SynGO was built on previous efforts (synaptic parts lists) funded by EU (EUROSPIN: HEALTH-F2-2009-241498 and SYNSYS: HEALTH-F4-2010-242167). A.B.P was supported by Spanish grants ref. BFU2012-34398, BFU2015-69717-P (partially funded by FEDER funds of the EU), Ramón y Cajal Fellowship, ref. RYC-2011-08391, the European FP People: Marie Curie Action: Career Integration Grant, ref. 304111 and the CERCA Program/Generalitat de Catalunya. M.R.K. was supported by DFG CRC779 project B08, EU-JPND STAD and Leibniz Foundation SAW. P.De C. was supported by NIH NS36251; E.D.G and D.C.D were supported by DFG CRC779 project B09. N.B. was supported by the German Federal Ministry of Education and Research (ERA-NET Neuron Synpathy) and an ERC Advanced grant from the EU (SynPrime). M.V. was supported by an ERC Advanced grant from the EU (ERC-ADG-322966-DCVfusion).
Footnotes
DECLARATION OF INTERESTS:
The authors declare no competing interests. M.S. and C.H. were employees of Genentech, a member of the Roche Group. S.E.H. serves on the Boards of Voyagers Therapeutics and Q-State Biosciences and on the scientific advisory boards of Janssen and BlackThorn.
REFERENCES
- Abdou K, Shehata M, Choko K, Nishizono H, Matsuo M, Muramatsu SI, and Inokuchi K (2018). Synapse-specific representation of the identity of overlapping memory engrams. Science 360, 1227–1231. [DOI] [PubMed] [Google Scholar]
- Abul-Husn NS, Bushlin I, Moron JA, Jenkins SL, Dolios G, Wang R, Iyengar R, Ma’ayan A, and Devi LA (2009). Systems approach to explore components and interactions in the presynapse. Proteomics 9, 3303–3315. [DOI] [PMC free article] [PubMed] [Google Scholar]
- Arnsten AF, Wang MJ, and Paspalas CD (2012). Neuromodulation of thought: flexibilities and vulnerabilities in prefrontal cortical network synapses. Neuron 76, 223–239. [DOI] [PMC free article] [PubMed] [Google Scholar]
- Ashburner M, Ball CA, Blake JA, Botstein D, Butler H, Cherry JM, Davis AP, Dolinski K, Dwight SS, Eppig JT, et al. (2000). Gene ontology: tool for the unification of biology. The Gene Ontology Consortium. Nature genetics 25, 25–29. [DOI] [PMC free article] [PubMed] [Google Scholar]
- Bayes A, Collins MO, Croning MD, van de Lagemaat LN, Choudhary JS, and Grant SG (2012). Comparative study of human and mouse postsynaptic proteomes finds high compositional conservation and abundance differences for key synaptic proteins. PLoS One 7, e46683. [DOI] [PMC free article] [PubMed] [Google Scholar]
- Bayes A, Collins MO, Reig-Viader R, Gou G, Goulding D, Izquierdo A, Choudhary JS, Emes RD, and Grant SG (2017). Evolution of complexity in the zebrafish synapse proteome. Nat Commun 8, 14613. [DOI] [PMC free article] [PubMed] [Google Scholar]
- Bayes A, van de Lagemaat LN, Collins MO, Croning MD, Whittle IR, Choudhary JS, and Grant SG (2011). Characterization of the proteome, diseases and evolution of the human postsynaptic density. Nature neuroscience 14, 19–21. [DOI] [PMC free article] [PubMed] [Google Scholar]
- Biesemann C, Gronborg M, Luquet E, Wichert SP, Bernard V, Bungers SR, Cooper B, Varoqueaux F, Li L, Byrne JA, et al. (2014). Proteomic screening of glutamatergic mouse brain synaptosomes isolated by fluorescence activated sorting. The EMBO journal 33, 157–170. [DOI] [PMC free article] [PubMed] [Google Scholar]
- Bipolar, D., Schizophrenia Working Group of the Psychiatric Genomics Consortium. Electronic address, d.r.v.e., Bipolar, D., and Schizophrenia Working Group of the Psychiatric Genomics, C. (2018). Genomic Dissection of Bipolar Disorder and Schizophrenia, Including 28 Subphenotypes. Cell 173, 1705–1715 e1716. [DOI] [PMC free article] [PubMed] [Google Scholar]
- Boda B, Dubos A, and Muller D (2010). Signaling mechanisms regulating synapse formation and function in mental retardation. Current opinion in neurobiology 20, 519–527. [DOI] [PubMed] [Google Scholar]
- Bourgeron T (2015). From the genetic architecture to synaptic plasticity in autism spectrum disorder. Nature reviews Neuroscience 16, 551–563. [DOI] [PubMed] [Google Scholar]
- Boyken J, Gronborg M, Riedel D, Urlaub H, Jahn R, and Chua JJ (2013). Molecular profiling of synaptic vesicle docking sites reveals novel proteins but few differences between glutamatergic and GABAergic synapses. Neuron 78, 285–297. [DOI] [PubMed] [Google Scholar]
- Bulik-Sullivan BK, Loh PR, Finucane HK, Ripke S, Yang J, Schizophrenia Working Group of the Psychiatric Genomics, C., Patterson N, Daly MJ, Price AL, and Neale BM (2015). LD Score regression distinguishes confounding from polygenicity in genome-wide association studies. Nature genetics 47, 291–295. [DOI] [PMC free article] [PubMed] [Google Scholar]
- Calvo SE, Clauser KR, and Mootha VK (2016). MitoCarta2.0: an updated inventory of mammalian mitochondrial proteins. Nucleic acids research 44, D1251–1257. [DOI] [PMC free article] [PubMed] [Google Scholar]
- Chang RY, Etheridge N, Nouwens AS, and Dodd PR (2015). SWATH analysis of the synaptic proteome in Alzheimer’s disease. Neurochem Int 87, 1–12. [DOI] [PubMed] [Google Scholar]
- Collins MO, Husi H, Yu L, Brandon JM, Anderson CN, Blackstock WP, Choudhary JS, and Grant SG (2006). Molecular characterization and comparison of the components and multiprotein complexes in the postsynaptic proteome. J Neurochem 97 Suppl 1, 16–23. [DOI] [PubMed] [Google Scholar]
- Consortium, G.T., Laboratory, D.A., Coordinating Center -Analysis Working, G., Statistical Methods groups-Analysis Working, G., Enhancing, G.g., Fund, N.I.H.C., Nih/Nci, Nih/Nhgri, Nih/Nimh, Nih/Nida, et al. (2017). Genetic effects on gene expression across human tissues. Nature 550, 204–213. [DOI] [PMC free article] [PubMed] [Google Scholar]
- Consortium, U. (2018). UniProt: the universal protein knowledgebase. Nucleic acids research 46, 2699. [DOI] [PMC free article] [PubMed] [Google Scholar]
- de Leeuw CA, Mooij JM, Heskes T, and Posthuma D (2015). MAGMA: generalized gene-set analysis of GWAS data. PLoS computational biology 11, e1004219. [DOI] [PMC free article] [PubMed] [Google Scholar]
- De Rubeis S, He X, Goldberg AP, Poultney CS, Samocha K, Cicek AE, Kou Y, Liu L, Fromer M, Walker S, et al. (2014). Synaptic, transcriptional and chromatin genes disrupted in autism. Nature 515, 209–215. [DOI] [PMC free article] [PubMed] [Google Scholar]
- Demontis D, Lescai F, Borglum A, Glerup S, Ostergaard SD, Mors O, Li Q, Liang J, Jiang H, Li Y, et al. (2016). Whole-Exome Sequencing Reveals Increased Burden of Rare Functional and Disruptive Variants in Candidate Risk Genes in Individuals With Persistent Attention-Deficit/Hyperactivity Disorder. Journal of the American Academy of Child and Adolescent Psychiatry 55, 521–523. [DOI] [PubMed] [Google Scholar]
- Emes RD, Pocklington AJ, Anderson CN, Bayes A, Collins MO, Vickers CA, Croning MD, Malik BR, Choudhary JS, Armstrong JD, et al. (2008). Evolutionary expansion and anatomical specialization of synapse proteome complexity. Nature neuroscience 11, 799–806. [DOI] [PMC free article] [PubMed] [Google Scholar]
- Fado R, Soto D, Minano-Molina AJ, Pozo M, Carrasco P, Yefimenko N, Rodriguez-Alvarez J, and Casals N (2015). Novel Regulation of the Synthesis of alpha-Amino-3-hydroxy-5-methyl-4-isoxazolepropionic Acid (AMPA) Receptor Subunit GluA1 by Carnitine Palmitoyltransferase 1C (CPT1C) in the Hippocampus. The Journal of biological chemistry 290, 25548–25560. [DOI] [PMC free article] [PubMed] [Google Scholar]
- Filiou MD, Bisle B, Reckow S, Teplytska L, Maccarrone G, and Turck CW (2010). Profiling of mouse synaptosome proteome and phosphoproteome by IEF. Electrophoresis 31, 1294–1301. [DOI] [PubMed] [Google Scholar]
- Fromer M, Pocklington AJ, Kavanagh DH, Williams HJ, Dwyer S, Gormley P, Georgieva L, Rees E, Palta P, Ruderfer DM, et al. (2014). De novo mutations in schizophrenia implicate synaptic networks. Nature 506, 179–184. [DOI] [PMC free article] [PubMed] [Google Scholar]
- Ganna A, Genovese G, Howrigan DP, Byrnes A, Kurki M, Zekavat SM, Whelan CW, Kals M, Nivard MG, Bloemendal A, et al. (2016). Ultra-rare disruptive and damaging mutations influence educational attainment in the general population. Nature neuroscience 19, 1563–1565. [DOI] [PMC free article] [PubMed] [Google Scholar]
- Gaudet P, Livstone MS, Lewis SE, and Thomas PD (2011). Phylogenetic-based propagation of functional annotations within the Gene Ontology consortium. Briefings in bioinformatics 12, 449–462. [DOI] [PMC free article] [PubMed] [Google Scholar]
- Giglio M, Tauber R, Nadendla S, Munro J, Olley D, Ball S, Mitraka E, Schriml LM, Gaudet P, Hobbs ET, et al. (2018). ECO, the Evidence & Conclusion Ontology: community standard for evidence information. Nucleic acids research. [DOI] [PMC free article] [PubMed] [Google Scholar]
- Grant SG (2012). Synaptopathies: diseases of the synaptome. Current opinion in neurobiology 22, 522–529. [DOI] [PubMed] [Google Scholar]
- Groschner LN, Chan Wah Hak L, Bogacz R, DasGupta S, and Miesenbock G (2018). Dendritic Integration of Sensory Evidence in Perceptual Decision-Making. Cell 173, 894–905 e813. [DOI] [PMC free article] [PubMed] [Google Scholar]
- Grove JSR, Als Thomas Damm, Mattheisen Manuel, Walters Raymond, Won Hyejung, Pallesen Jonatan, Agerbo Esben, Andreassen Ole A, Anney Richard, Belliveau Rich, Bettella Francesco, Buxbaum Joseph D, Bybjerg-Grauholm Jonas, Bækved-Hansen Marie, Cerrato Felecia, Chambert Kimberly, Christensen Jane H, Churchhouse Claire, Dellenvall Karin, Demontis Ditte, De Rubeis Silvia, Devlin Bernie, Djurovic Srdjan, Dumont Ashley, Goldstein Jacqueline, Hansen Christine S, Hauberg Mads E, Hollegaard Mads V, Hope Sigrun, Howrigan Daniel P, Huang Hailiang, Hultman Christina, Klei Lambertus, Maller Julian, Martin Joanna, Martin Alicia R, Moran Jennifer, Nyegaard Mette, Nærland Terje, Palmer Duncan S, Palotie Aarno, Pedersen Carsten B, Pedersen Marianne G, Poterba Timothy, Poulsen Jesper B, St Pourcain Beate, Qvist Per, Rehnström Karola, Reichenberg Avi, Reichert Jennifer, Robinson Elise, Roeder Kathryn, Roussos Panos, Saemundsen Evald, Sandin Sven, Satterstrom F Kyle, Smith George D, Stefansson Hreinn, Stefansson Kari, Steinberg Stacy, Stevens Christine, Sullivan Patrick F, Turley Patrick, Walters G Bragi, Xu Xinyi, ASD Working Group of the PGC, BUPGEN, Major Depressive Disorder Working Group of the PGC, 23andMe Research Team, Geschwind Daniel, Nordentoft Merete, Hougaard David M, Werge Thomas, Mors Ole, Mortensen Preben B, Neale Benjamin M, Daly Mark J, Børglum Anders D (2019). Common risk variants identified in autism spectrum disorder. bioRxiv 224774; doi: 10.1101/224774. [DOI] [Google Scholar]
- Gupta I, Collier PG, Haase B, Mahfouz A, Joglekar A, Floyd T, Koopmans F, Barres B, Smit AB, Sloan SA, et al. (2018). Single-cell isoform RNA sequencing characterizes isoforms in thousands of cerebellar cells. Nature biotechnology. [DOI] [PubMed] [Google Scholar]
- Heutink P, and Verhage M (2012). Neurodegeneration: new road leads back to the synapse. Neuron 75, 935–938. [DOI] [PubMed] [Google Scholar]
- Hong S, Beja-Glasser VF, Nfonoyim BM, Frouin A, Li S, Ramakrishnan S, Merry KM, Shi Q, Rosenthal A, Barres BA, et al. (2016). Complement and microglia mediate early synapse loss in Alzheimer mouse models. Science 352, 712–716. [DOI] [PMC free article] [PubMed] [Google Scholar]
- Huang KY, Su MG, Kao HJ, Hsieh YC, Jhong JH, Cheng KH, Huang HD, and Lee TY (2016). dbPTM 2016: 10-year anniversary of a resource for post-translational modification of proteins. Nucleic acids research 44, D435–446. [DOI] [PMC free article] [PubMed] [Google Scholar]
- Jeanquartier F, Jean-Quartier C, and Holzinger A (2015). Integrated web visualizations for protein-protein interaction databases. BMC bioinformatics 16, 195. [DOI] [PMC free article] [PubMed] [Google Scholar]
- Kandel ER (2001). The molecular biology of memory storage: a dialogue between genes and synapses. Science 294, 1030–1038. [DOI] [PubMed] [Google Scholar]
- Karczewski KJ, Weisburd B, Thomas B, Solomonson M, Ruderfer DM, Kavanagh D, Hamamsy T, Lek M, Samocha KE, Cummings BB, et al. (2017). The ExAC browser: displaying reference data information from over 60 000 exomes. Nucleic acids research 45, D840–D845. [DOI] [PMC free article] [PubMed] [Google Scholar]
- Krogh A, Larsson B, von Heijne G, and Sonnhammer EL (2001). Predicting transmembrane protein topology with a hidden Markov model: application to complete genomes. Journal of molecular biology 305, 567–580. [DOI] [PubMed] [Google Scholar]
- Kumar S, Stecher G, Suleski M, and Hedges SB (2017). TimeTree: A Resource for Timelines, Timetrees, and Divergence Times. Molecular biology and evolution 34, 1812–1819. [DOI] [PubMed] [Google Scholar]
- Lee JJ, Wedow R, Okbay A, Kong E, Maghzian O, Zacher M, Nguyen-Viet TA, Bowers P, Sidorenko J, Karlsson Linner R, et al. (2018). Gene discovery and polygenic prediction from a genome-wide association study of educational attainment in 1.1 million individuals. Nature genetics 50, 1112–1121. [DOI] [PMC free article] [PubMed] [Google Scholar]
- Lek M, Karczewski KJ, Minikel EV, Samocha KE, Banks E, Fennell T, O’Donnell-Luria AH, Ware JS, Hill AJ, Cummings BB, et al. (2016). Analysis of protein-coding genetic variation in 60,706 humans. Nature 536, 285–291. [DOI] [PMC free article] [PubMed] [Google Scholar]
- Lips ES, Cornelisse LN, Toonen RF, Min JL, Hultman CM, International Schizophrenia C, Holmans PA, O’Donovan MC, Purcell SM, Smit AB, et al. (2012). Functional gene group analysis identifies synaptic gene groups as risk factor for schizophrenia. Molecular psychiatry 17, 996–1006. [DOI] [PMC free article] [PubMed] [Google Scholar]
- Martin J, Walters RK, Demontis D, Mattheisen M, Lee SH, Robinson E, Brikell I, Ghirardi L, Larsson H, Lichtenstein P, et al. (2018). A Genetic Investigation of Sex Bias in the Prevalence of Attention-Deficit/Hyperactivity Disorder. Biological psychiatry 83, 1044–1053. [DOI] [PMC free article] [PubMed] [Google Scholar]
- Mattheisen M, Samuels JF, Wang Y, Greenberg BD, Fyer AJ, McCracken JT, Geller DA, Murphy DL, Knowles JA, Grados MA, et al. (2015). Genome-wide association study in obsessive-compulsive disorder: results from the OCGAS. Molecular psychiatry 20, 337–344. [DOI] [PMC free article] [PubMed] [Google Scholar]
- Mi H, Muruganujan A, Ebert D, Huang X, and Thomas PD (2018). PANTHER version 14: more genomes, a new PANTHER GO-slim and improvements in enrichment analysis tools. Nucleic acids research. [DOI] [PMC free article] [PubMed] [Google Scholar]
- Moczulska KE, Pichler P, Schutzbier M, Schleiffer A, Rumpel S, and Mechtler K (2014). Deep and precise quantification of the mouse synaptosomal proteome reveals substantial remodeling during postnatal maturation. J Proteome Res 13, 4310–4324. [DOI] [PubMed] [Google Scholar]
- Monday HR, and Castillo PE (2017). Closing the gap: long-term presynaptic plasticity in brain function and disease. Current opinion in neurobiology 45, 106–112. [DOI] [PMC free article] [PubMed] [Google Scholar]
- Morciano M, Beckhaus T, Karas M, Zimmermann H, and Volknandt W (2009). The proteome of the presynaptic active zone: from docked synaptic vesicles to adhesion molecules and maxi-channels. J Neurochem 108, 662–675. [DOI] [PubMed] [Google Scholar]
- Morciano M, Burre J, Corvey C, Karas M, Zimmermann H, and Volknandt W (2005). Immunoisolation of two synaptic vesicle pools from synaptosomes: a proteomics analysis. J Neurochem 95, 1732–1745. [DOI] [PubMed] [Google Scholar]
- Pandya NJ, Koopmans F, Slotman JA, Paliukhovich I, Houtsmuller AB, Smit AB, and Li KW (2017). Correlation profiling of brain sub-cellular proteomes reveals co-assembly of synaptic proteins and subcellular distribution. Sci Rep 7, 12107. [DOI] [PMC free article] [PubMed] [Google Scholar]
- Pardinas AF, Holmans P, Pocklington AJ, Escott-Price V, Ripke S, Carrera N, Legge SE, Bishop S, Cameron D, Hamshere ML, et al. (2018). Common schizophrenia alleles are enriched in mutation-intolerant genes and in regions under strong background selection. Nature genetics 50, 381–389. [DOI] [PMC free article] [PubMed] [Google Scholar]
- Pedroso I, Lourdusamy A, Rietschel M, Nothen MM, Cichon S, McGuffin P, Al-Chalabi A, Barnes MR, and Breen G (2012). Common genetic variants and gene-expression changes associated with bipolar disorder are over-represented in brain signaling pathway genes. Biological psychiatry 72, 311–317. [DOI] [PubMed] [Google Scholar]
- Petersen CC, and Crochet S (2013). Synaptic computation and sensory processing in neocortical layer 2/3. Neuron 78, 28–48. [DOI] [PubMed] [Google Scholar]
- Phillips GR, Florens L, Tanaka H, Khaing ZZ, Fidler L, Yates JR 3rd, and Colman DR (2005). Proteomic comparison of two fractions derived from the transsynaptic scaffold. J Neurosci Res 81, 762–775. [DOI] [PubMed] [Google Scholar]
- Psychiatric GCBDWG (2011). Large-scale genome-wide association analysis of bipolar disorder identifies a new susceptibility locus near ODZ4. Nature genetics 43, 977–983. [DOI] [PMC free article] [PubMed] [Google Scholar]
- Ripolles P, Ferreri L, Mas-Herrero E, Alicart H, Gomez-Andres A, Marco-Pallares J, Antonijoan RM, Noesselt T, Valle M, Riba J, et al. (2018). Intrinsically regulated learning is modulated by synaptic dopamine signaling. eLife 7. [DOI] [PMC free article] [PubMed] [Google Scholar]
- Roy M, Sorokina O, Skene N, Simonnet C, Mazzo F, Zwart R, Sher E, Smith C, Armstrong JD, and Grant SGN (2018). Proteomic analysis of postsynaptic proteins in regions of the human neocortex. Nature neuroscience 21, 130–138. [DOI] [PubMed] [Google Scholar]
- Ruano D, Abecasis GR, Glaser B, Lips ES, Cornelisse LN, de Jong AP, Evans DM, Davey Smith G, Timpson NJ, Smit AB, et al. (2010). Functional gene group analysis reveals a role of synaptic heterotrimeric G proteins in cognitive ability. American journal of human genetics 86, 113–125. [DOI] [PMC free article] [PubMed] [Google Scholar]
- Savage JE, Jansen PR, Stringer S, Watanabe K, Bryois J, de Leeuw CA, Nagel M, Awasthi S, Barr PB, Coleman JRI, et al. (2018). Genome-wide association meta-analysis in 269,867 individuals identifies new genetic and functional links to intelligence. Nature genetics 50, 912–919. [DOI] [PMC free article] [PubMed] [Google Scholar]
- Selkoe DJ (2002). Alzheimer’s disease is a synaptic failure. Science 298, 789–791. [DOI] [PubMed] [Google Scholar]
- Shannon P, Markiel A, Ozier O, Baliga NS, Wang JT, Ramage D, Amin N, Schwikowski B, and Ideker T (2003). Cytoscape: a software environment for integrated models of biomolecular interaction networks. Genome research 13, 2498–2504. [DOI] [PMC free article] [PubMed] [Google Scholar]
- Smedley D, Haider S, Durinck S, Pandini L, Provero P, Allen J, Arnaiz O, Awedh MH, Baldock R, Barbiera G, et al. (2015). The BioMart community portal: an innovative alternative to large, centralized data repositories. Nucleic acids research 43, W589–598. [DOI] [PMC free article] [PubMed] [Google Scholar]
- Smith AC, and Robinson AJ (2018). MitoMiner v4.0: an updated database of mitochondrial localization evidence, phenotypes and diseases. Nucleic acids research. [DOI] [PMC free article] [PubMed] [Google Scholar]
- Soukup SF, Vanhauwaert R, and Verstreken P (2018). Parkinson’s disease: convergence on synaptic homeostasis. The EMBO journal 37. [DOI] [PMC free article] [PubMed] [Google Scholar]
- Spires-Jones TL, and Hyman BT (2014). The intersection of amyloid beta and tau at synapses in Alzheimer’s disease. Neuron 82, 756–771. [DOI] [PMC free article] [PubMed] [Google Scholar]
- Sudhof TC (2008). Neuroligins and neurexins link synaptic function to cognitive disease. Nature 455, 903–911. [DOI] [PMC free article] [PubMed] [Google Scholar]
- Szklarczyk D, Franceschini A, Wyder S, Forslund K, Heller D, Huerta-Cepas J, Simonovic M, Roth A, Santos A, Tsafou KP, et al. (2015). STRING v10: protein-protein interaction networks, integrated over the tree of life. Nucleic acids research 43, D447–452. [DOI] [PMC free article] [PubMed] [Google Scholar]
- Thapar A, Martin J, Mick E, Arias Vasquez A, Langley K, Scherer SW, Schachar R, Crosbie J, Williams N, Franke B, et al. (2016). Psychiatric gene discoveries shape evidence on ADHD’s biology. Molecular psychiatry 21, 1202–1207. [DOI] [PMC free article] [PubMed] [Google Scholar]
- The Gene Ontology C (2018). The Gene Ontology Resource: 20 years and still GOing strong. Nucleic acids research. [DOI] [PMC free article] [PubMed] [Google Scholar]
- UniProt C (2018). UniProt: a worldwide hub of protein knowledge. Nucleic acids research. [DOI] [PMC free article] [PubMed] [Google Scholar]
- Wilhelm BG, Mandad S, Truckenbrodt S, Krohnert K, Schafer C, Rammner B, Koo SJ, Classen GA, Krauss M, Haucke V, et al. (2014). Composition of isolated synaptic boutons reveals the amounts of vesicle trafficking proteins. Science 344, 1023–1028. [DOI] [PubMed] [Google Scholar]
- Wood AR, Esko T, Yang J, Vedantam S, Pers TH, Gustafsson S, Chu AY, Estrada K, Luan J, Kutalik Z, et al. (2014). Defining the role of common variation in the genomic and biological architecture of adult human height. Nature genetics 46, 1173–1186. [DOI] [PMC free article] [PubMed] [Google Scholar]
- Wray NR, Ripke S, Mattheisen M, Trzaskowski M, Byrne EM, Abdellaoui A, Adams MJ, Agerbo E, Air TM, Andlauer TMF, et al. (2018). Genome-wide association analyses identify 44 risk variants and refine the genetic architecture of major depression. Nature genetics 50, 668–681. [DOI] [PMC free article] [PubMed] [Google Scholar]
- Yates B, Braschi B, Gray KA, Seal RL, Tweedie S, and Bruford EA (2017). Genenames.org: the HGNC and VGNC resources in 2017. Nucleic acids research 45, D619–D625. [DOI] [PMC free article] [PubMed] [Google Scholar]
- Zwir I, Arnedo J, Del-Val C, Pulkki-Raback L, Konte B, Yang SS, Romero-Zaliz R, Hintsanen M, Cloninger KM, Garcia D, et al. (2018). Uncovering the complex genetics of human temperament. Molecular psychiatry. [DOI] [PMC free article] [PubMed] [Google Scholar]
Associated Data
This section collects any data citations, data availability statements, or supplementary materials included in this article.
Supplementary Materials
Data Availability Statement
All data from the SynGO consortium together with purpose-built analysis tools and community engagement are available through the SynGO website at https://syngoportal.org.