

Abstract
Homeostatic regulation of synaptic strength allows for maintenance of neural activity within a dynamic range for proper circuit function. There are largely two distinct modes of synaptic plasticity that allow for homeostatic adaptation of cortical circuits: synaptic scaling and sliding threshold (BCM theory). Previous findings suggest that the induction of synaptic scaling is not prevented by blocking NMDARs, whereas the sliding threshold model posits that the synaptic modification threshold of LTP and LTD readjusts with activity and thus the outcome of synaptic plasticity is NMDAR dependent. Although synaptic scaling and sliding threshold have been considered two distinct mechanisms, there are indications from recent studies that these two modes of homeostatic plasticity may interact or that they may operate under two distinct activity regimes. Here, we report using both sexes of mouse that acute genetic knock-out of the obligatory subunit of NMDAR or acute pharmacological block of NMDAR prevents experience-dependent homeostatic regulation of AMPAR-mediated miniature EPSCs in layer 2/3 of visual cortex. This was not due to gross changes in postsynaptic neuronal activity with inhibiting NMDAR function as determine by c-Fos expression and two-photon Ca2+ imaging in awake mice. Our results suggest that experience-dependent homeostatic regulation of intact cortical circuits is mediated by NMDAR-dependent plasticity mechanisms, which supports a sliding threshold model of homeostatic adaptation.
SIGNIFICANCE STATEMENT Prolonged changes in sensory experience lead to homeostatic adaptation of excitatory synaptic strength in sensory cortices. Both sliding threshold and synaptic scaling models can account for the observed homeostatic synaptic plasticity. Here we report that visual experience-dependent homeostatic plasticity of excitatory synapses observed in superficial layers of visual cortex is dependent on NMDAR function. In particular, both strengthening of synapses induced by visual deprivation and the subsequent weakening by reinstatement of visual experience were prevented in the absence of functional NMDARs. Our results suggest that sensory experience-dependent homeostatic adaptation depends on NMDARs, which supports the sliding threshold model of plasticity and input-specific homeostatic control observed in vivo.
Keywords: BCM theory, homeostatic synaptic plasticity, NMDAR, sliding threshold, synaptic scaling, visual cortex
Introduction
Neuronal circuits constantly undergo changes through development, experience, and learning that allow for adaptation to different environments or internal states. Correlation based synaptic plasticity mechanisms such as long-term potentiation (LTP) and long-term depression (LTD) are largely responsible for storing such information. However, LTP and LTD have innate positive feedback loop that requires additional homeostatic mechanisms to allow stability of neural circuits undergoing plasticity. Several models of homeostatic plasticity can achieve this function, including synaptic scaling (Turrigiano, 2008) and the sliding threshold model (Cooper and Bear, 2012).
According to synaptic scaling, prolonged reduction in neuronal activity leads to an upscaling of the strength of excitatory synapses, while a period of enhanced activity results in a downscaling (Turrigiano et al., 1998). Synaptic scaling was initially proposed to occur globally across the majority of synapses in a multiplicative manner to preserve relative differences in synaptic weight (Turrigiano et al., 1998). Initial demonstrations of synaptic scaling were done by observing changes in the amplitude of miniature EPSCs (mEPSCs) in cultured neurons upon pharmacological manipulation of neural activity, and its induction is largely independent of NMDAR activation (O'Brien et al., 1998; Turrigiano et al., 1998). Similar homeostatic changes in mEPSCs, which has been interpreted as synaptic scaling, can be induced in pyramidal neurons of rodent primary visual cortex (V1) by dark exposure (DE) (Goel et al., 2006; Goel and Lee, 2007; He et al., 2012), intraocular TTX injection (Desai et al., 2002), enucleation (He et al., 2012), and retinal lesions (Keck et al., 2013). Similar to what is observed in cultured neurons, synaptic scaling in V1 is largely mediated by the insertion or removal of AMPARs (Goel et al., 2006, 2011).
Sliding threshold model states that prolonged periods of altered activity result in the modification of the threshold for LTP and LTD induction. The synaptic modification threshold shifts bidirectionally depending on the history of neuronal activity: an extended period of low activity slides the threshold to favor LTP, whereas high activity shifts it to favor LTD (Abraham and Bear, 1996; Cooper and Bear, 2012). Sliding threshold has been demonstrated in rodent V1, in which dark-rearing (DR) or DE leads to a lower threshold for LTP induction (Kirkwood et al., 1996; Philpot et al., 2003; Guo et al., 2012). Synaptic modification threshold “slides” by changes in either the induction mechanisms of LTP/LTD, such as alterations in NMDAR function (Quinlan et al., 1999; Philpot et al., 2003) and inhibition (Steele and Mauk, 1999), or the expression mechanisms of LTP/LTD, such as changes in AMPAR phosphorylation (Huang et al., 2012).
Although seemingly different, both synaptic scaling and sliding threshold allow homeostatic adaptation of synapses to maintain neuronal activity within a physiologically relevant, yet stable dynamic range. Previous investigations have shown that both changes in mEPSC amplitude and changes in the modification threshold happen in vivo in V1. They have, however, failed to address how these two processes interact, if at all, and to which extent. Recent evidence suggests that different levels of activity change may trigger synaptic scaling versus sliding threshold mode of homeostatic plasticity in V1 (Bridi et al., 2018). Based on the reported differences in the requirement of NMDAR activation for synaptic scaling and sliding threshold models, we examined the role of NMDARs on visual experience-dependent changes in mEPSCs of L2/3 neurons of mouse V1, which have been interpreted as synaptic scaling (Desai et al., 2002; Goel et al., 2006; Goel and Lee, 2007; He et al., 2012; Keck et al., 2013). We reasoned that if the observed scaling of mEPSCs with visual experience is a consequence of LTP/LTD due to the sliding threshold, then these changes would depend on NMDAR activation. Using cell-type-specific knock-out (KO) mice or an antagonist of NMDARs, we found evidence supporting a key role of NMDARs in mediating experience-dependent homeostatic synaptic plasticity in V1.
Materials and Methods
Visual experience manipulation
All animal handling and manipulations were approved by the Institutional Animal Care and Use Committee at Johns Hopkins University and followed the guidelines established by the National Institutes of Health. Male and female NR1flox mice (https://www.jax.org/strain/005246; RRID:IMSR_JAX:005246) were raised under a 12 h light/dark cycle until postnatal days 25–35 (P25–P35). At this point, a group of mice was placed in 24 h dark conditions for 2 d (2 d DE). Animals in the dark were cared for by using infrared vision goggles. A group of DE mice were taken out of the dark and reexposed to light for 2 h (2 h light-exposed, LE). Age-matched control animals were continuously raised in the normal 12 h light/dark cycle (Ctl).
Targeted viral transfection
Male and female NR1flox mice between P23-P27 were bilaterally injected with an adeno-associated viral vector expressing Cre-GFP under the control of CaMKII promoter (AAV9.CaMKII.HI.eGFP-Cre.WPRE.SV40; Penn Vector Core, University of Pennsylvania, Cat#: AV-9-PV2521) in V1. Layer 2/3 of V1 was targeted by using the following stereotaxic coordinates relative to bregma: posterior −3.6 mm, lateral 1.5 mm, and depth −0.3 mm. Mice recovered on a heated pad until movement, eating and drinking behaviors were evident. Animals were returned to the mouse colony after recovery and remained under 12 h light/dark conditions until experimental use. Viral expression and KO of NR1 gene was confirmed experimentally 6–7 d after transfection as determined by significantly reduced NMDAR currents (Fig. 1). Manipulation of visual experience therefore commenced 1 week (6–7 d) after viral injections. Control mice underwent the same procedure, but instead were injected with a GFP-expressing adeno-associated virus (AAV9.CaMKII0.4.eGFP.WPRE.rBG; Penn Vector Core, University of Pennsylvania, catalog #AV-9_PV1917).
Figure 1.

Neuron-specific NMDAR KO. A, GFP and Cre-GFP expressing viruses result in similar transfection efficiency for V1 neurons (mean percentage of transfected neurons: GFP-only = 67.7 ± 4.6%, Cre-GFP = 60.8 ± 3.9%; unpaired t test: t = 1.634, p = 0.1079; number of slices quantified reported, 6 mice per condition). B, Confocal image of biocytin filled NMDAR KO (green arrow, expressing Cre-GFP in the nucleus) and neighbor (orange arrow) neurons in V1 L2/3. C, Left, Comparison of average NMDAR/AMPAR ratio for each condition (mean NMDAR/AMPAR ratio for GFP-only 0.25 ± 0.04, NR1 KO 0.05 ± 0.007, neighbor 0.22 ± 0.07; one-way ANOVA: F(2,13) = 5.502, *p = 0.0186; Tukey's multiple-comparisons post hoc: GFP vs NR1 KO *p = 0.02, GFP vs neighbor p = 0.93, neighbor vs NR1 KO p = 0.05; number of cells reported). Right: Example traces of NMDAR (measured at +40 mV holding potential) and AMPAR (measured at −70 mV holding potential) mediated currents in GFP-only, NMDAR-KO, and neighbor neurons. Traces were normalized to match the amplitude of AMPAR current.
In vivo CPP application
For control normal-reared and DE groups, NMDAR antagonist D-4-[(2E)-3-phosphono-2-propenyl]-2-piperazinecarboxylic acid (d-CPP; Tocris Bioscience; catalog #1265) was delivered intraventricularly for 2 d via Alzet osmotic minipumps (DURECT; catalog #1007D) coupled to a brain infusion cannula (Alzet; DURECT; catalog #8851). Control groups were infused with saline instead of d-CPP. In brief, all osmotic minipumps (0.5 μl/h) were back-filled with either d-CPP (10 μm) or saline solution and primed by incubating in saline solution at 37°C for at least 5 h before implantation. Implantation surgery was done under constant administration of 1.5–2% isoflurane/oxygen mix under aseptic conditions. Anesthesia level and vital signs were monitored during the surgery. Craniotomy was performed for cannula insertion by drilling a small hole in the skull at stereotaxic coordinates −0.22 mm posterior, 1 mm lateral from bregma to target the lateral cerebral ventricle using a dental drill and a sterilized 0.5 mm drill-bit. The neck was aseptically cleaned, a small cut was made at the base and blunt forceps were used to separate the fascia, then an osmotic mini-pump was inserted subcutaneously. The cannula was guided to the drilled hole on the skull and secured in place with dental cement (TEETS denture material; Patterson Dental; catalog #223-3773). After the surgery, mice recovered on a 30°C heating pad and then returned to their home cages, where drinking water was supplemented with 0.07 mg/ml carprofen (Sigma Aldrich 33975; CAS#: 53716-49-7) (Ingrao et al., 2013). For the DE group, mice were allowed to recover for at least 12 h before placed inside a darkroom for 2 d. For LE groups, d-CPP (10 mg/kg) or saline were delivered intraperitoneally (200 μl volume) in the dark room 10 min before light exposure.
Primary visual cortex slice preparation
Mice between P25-P35 were deeply anesthetized with isoflurane gas in a chamber placed in a chemical fume hood. Anesthesia was delivered to dark exposed animals in a light-tight chamber. After confirming the absence of pinch or righting reflex, mice were decapitated and the brain was immediately placed in ice-cold dissection buffer containing the following (in mm): 212.7 sucrose, 10 dextrose, 3 MgCl2, 1 CaCl2, 2.6 KCl, 1.23 NaH2PO4·H2O, and 26 NaHCO3, which was bubbled with 95% O2/5% CO2 gas. Blocks containing V1 were rapidly isolated and sectioned coronally into 300 μm thick slices, while submerged in ice-cold dissection buffer, using a vibratory tissue slicer (PELCO easiSlicer; Ted Pella; catalog #11000). Slices were transferred to a submersion holding chamber filled with artificial CSF containing the following (in mm): 124 NaCl, 5 KCl, 1.25 NaH2PO4·H2O, 26 NaHCO3, 10 dextrose, 2.5 CaCl2, and 1.5 MgCl2, bubbled with 95% O2/5% CO2. The slices recovered for 1 h at room temperature before electrophysiological recordings started.
Electrophysiological recordings
Slices were transferred to a submersion-type recording chamber and perfused with oxygenated ACSF (bubbled 95% O2/5% CO2 at 32 ± 2°C) at a rate of 2 ml/min. The chamber was mounted on a fixed stage under an upright microscope (E600 FN; Nikon) with oblique infrared illumination. Pyramidal neurons in L2/3 of V1 were visually identified and patched using a glass pipette with a tip resistance between 3 and 5 MΩ, which was filled with internal solution containing the following (in mm): 120 CsOH, 120 Gluconic acid, 10 phosphocreatine, 0.5 GTP, 4 ATP, 8 KCl, 1 EGTA,10 HEPES and 5 QX-314. An Axon patch-clamp amplifier (Multiclamp 700B, Molecular Devices) was used for voltage-clamp recordings and data were acquired through Igor Pro software (WaveMetrics, http://www.wavemetrics.com/products/igorpro/igorpro.htm; RRID:SCR_000325). Only data from cells with input resistance (Ri) > 150 MΩ and series resistance (Rs) < 25 MΩ were analyzed.
NMDAR/AMPAR ratio.
Glutamatergic currents were recorded in response to electric stimulation delivered through a bipolar glass electrode placed in V1 L4 or L2/3. Recordings were done in the presence of 20 μm bicuculline methiodide (Enzo Life Sciences, catalog #BML-EA149-0050) in the ACSF. The stimulation intensity was adjusted so that a single-peak response was produced with an onset latency of 2–3 ms. The AMPAR component was taken as the average peak amplitude of responses recorded at Vh = −70 mV. The NMDAR component was taken as the average amplitude of responses recorded at Vh = +40 mV 70 ms after onset. Responses were recorded every 10 s and a minimum of 10 responses were averaged for each component.
mEPSCs.
AMPAR-mediated mEPSCs were isolated by recording with 1 μm tetrodotoxin citrate (TTX; Abcam; catalog #ab120055), 20 μm bicuculline methiodide, and 100 μm DL-2-amino-5 phosphonopentanoic acid (DL-APV; Sigma-Aldrich A5282; CAS#: 76326-31-3) in the ACSF. Events were recorded at Vh = −80 mV for a minimum of 4 min initiated 1–2 min after cell break-in. The recorded data were digitized at 2 kHz by a data acquisition board (National Instruments), acquired with Igor Pro software and analyzed using the MiniAnalysis program (Synaptosoft, http://www.synaptosoft.com/MiniAnalysis/; RRID:SCR_002184). The detection threshold for mEPSCs was set to 3 times the root mean square noise and events with a rise time >3 ms were excluded from analysis. Events within bursts (>2 events, interevent interval <10 ms) were excluded from the measurement of amplitudes. The average of total isolated events (200–220) was used to calculate the decay time constant for each neuron. Cells were discarded if Ri or Rs changed >15% during the duration of the recording.
Biocytin processing
Slices used for electrophysiological recordings were immediately fixed in 10% formalin (Sigma-Aldrich, HT5014; MDL: MFCD00003274) solution overnight at 4°C. Slices were rinsed 0.01 m PBS at room temperature and permeabilized in 2% Triton X-100 (Fisher Scientific) in PBS for 1 h. Slices were then incubated in 1:2000 solution of avidin-Texas Red conjugate (Life Technologies; A820) in 1% Triton X-100 (in PBS) overnight. After incubation, slices were washed in PBS, mounted on glass slides, and coverslipped with Prolong Gold Anti-fade (Fisher Scientific; catalog #P36930) mounting medium. Images were taken using a Zeiss LSM 510 META confocal microscope.
Immunohistochemistry
NR1flox mice were deeply anesthetized with isoflurane vapors in a closed chamber placed in a fume hood. Two-day DE animals were anesthetized in a light-tight chamber. Animals were perfused transcardially with PBS followed by 10% formalin solution. The brains were then extracted and kept in 10% formalin overnight. V1 was isolated and sectioned coronally in 40 μm thick slices. Free floating slices containing V1 were incubated with 1% sodium borohydride (Fisher Scientific; catalog #S-678-10) for 15 min at room temperature and then washed with PBS. The same slices were blocked for 2 h in a solution containing 3% goat serum (Sigma-Aldrich; catalog #9023) and 0.3% Triton X-100 in PBS or mixture of 10% normal goat serum (Jackson ImmunoResearch; catalog #005-000-121), 5% normal donkey serum (Jackson ImmunoResearch; catalog #017-000-121), and 0.5% Triton X-100 in PBS. Cortical slices were then incubated with antibodies against c-Fos and Neuronal nuclei protein (NeuN) in the blocking buffer overnight. Slices were rinsed and then incubated for 2 h with fluorescently labeled secondary antibodies. Slices were then washed with PBS, incubated with DAPI and mounted on glass slides with Prolong Gold Anti-fade medium. The antibody concentrations were as follows: 1:20,000 rabbit anti-cFos (Calbiochem, catalog #PC38; RRID:AB_2106755) or 1:500 rabbit anti-c-Fos (Cell Signaling Technology, catalog #2250S; RRID:AB_10692514), 1:200 mouse anti-NeuN (Millipore MAB377; RRID:AB_2298772), 1:200 donkey anti-mouse Alexa Fluor 488 (Thermo Fisher Scientific; RRID:AB_141607), 1:200 goat anti-rabbit Alexa Fluor 633 (Thermo Fisher Scientific; RRID:AB_2535731), goat anti-mouse Alexa Fluor 555 (Thermo Fisher Scientific; RRID:AB_2535844). Slices were imaged using either Zeiss LSM 700 or 800 confocal microscope with a step size of 0.5 μm. All images were analyzed using Volocity software.
Two-photon Ca2+ imaging in awake, head-fixed mice
Male and female Emx1-Cre × Ai96 mice (https://www.jax.org/strain/005628 RRID:MGI:2684615, https://www.jax.org/strain/024106) underwent head plate and cranial window implantation surgery at p23–p25. The head plate and cranial windows, consisting of one 5 mm and two 3 mm round coverslips, were based on an existing design (Goldey et al., 2014). After 3–4 d of recovery, the mice were habituated to head-fixation in a body tube for 4–5 d. Habituated mice readily accepted sucrose and did not react aversively to visual stimuli. 2-photon calcium imaging was performed at P33–P35 using a custom-built microscope based on a Janelia Farm design (https://wiki.janelia.org/wiki/display/shareddesigns/MIMMS). GCaMP6s expressing neurons were imaged through a 16× 0.8 NA Nikon using a Chameleon Ultra 2 laser (Coherent Technologies) at 940 nm. Due to relatively weak fluorescence of the Ai96 line, imaging depth was limited to 150–220 μm with laser power set to 75–100 mW. Images were acquired at 30 Hz using Scanimage 2018 (Pologruto et al., 2003) and analyzed using custom scripts written in MATLAB (The MathWorks).
Visual stimuli and data acquisition.
During the imaging session, mouse was head-fixed in the body tube with visual stimuli displayed on a monitor centered 25 cm from the contralateral eye (60 Hz, mean luminance 30 cd/m2). The stimuli were moving sinusoidal gratings at 8 orientations (45° increments), with spatial frequency 0.05 cycles/degree, temporal frequency 3 cycles/s. The gratings were shown for 3 s followed by 6 s interstimulus interval and were organized into blocks of 10 stimuli, with each block containing all the gratings and two additional blank stimuli in random order. After 12 repetitions of each stimulus (lasting 18 min), the mouse was taken out of the body tube and given an i.p. injection of either saline or 10 mg/kg CPP (Tocris Bioscience; catalog #01773). A second round of imaging was then done 30–60 min after the injection in the same region. Depth was manually adjusted to match pattern of cell bodies from first round of imaging.
Data processing and analysis.
After cross-correlation based frame alignment, ROIs were manually drawn around visible cell bodies and cell body masks were calculated in semiautomated manner using correlation with a seed pixel. Neuropil signal was estimated from pixels within ROIs that were at least 2 pixels away from the mask boundary. Fluorescent traces for both mask signal and neuropil were filtered by 0.5 s running average to reduce noise. Fluorescent baseline F0 was calculated as the running 10th percentile over 1800 frames (∼1 min) of the mask signal. Fluorescence signal from cell bodies was then calculated as ΔF/F0 = [(Fmask − 0.7*Fneuropil) − F0]/F0. Visual responses were calculated as the mean ΔF/F0 over the 3 s duration of the stimulus minus mean ΔF/F0 over 1 s preceding the visual stimulus. Spontaneous activity was calculated as the mean ΔF/F0 over 7 s window following the onset of blank stimuli. To determine whether the neuron was visually responsive, the difference between visual response and blank stimulus response was compared with distribution of such differences for scrambled data (1000 resamplings). The neuron was considered visually responsive if the difference was higher than at least 950 (95%) of differences from the scrambled distribution. Note that this excludes neurons that are suppressed by visual stimuli or show off-response to visual stimuli. A similar procedure was used to determine whether the neuron had significant orientation selectivity. The orientation selectivity index (OSI) [(Rpref − Rortho)/(Rpref + Rortho)] was calculated and then compared with distribution of OSI calculated from scrambled data. If the OSI was >95% of OSIs from the scrambled distribution, then the neuron was considered significantly orientation selective.
Experimental design and statistical analysis
Data are presented as mean ± SEM. All statistical analyses were done using Prism 7.0 (GraphPad Software; RRID:SCR_002798). One-factor ANOVA was used to compare multiple groups followed by a Tukey's multiple-comparisons post hoc test. Unpaired Student's t tests were used for two group comparisons. The Kolmogrov–Smirnov (K–S) test was used to compare cumulative probabilities. A p-value <0.05 was used as a measure of significance in t tests, ANOVAs, and Tukey's, or Bonferroni post hoc analyses. For K-S tests, p-values < 0.01 were used as a measure of significance. Asterisk (*) is used in both text and figures to denote statistical significance.
Results
Neuron-specific NMDAR KO
To test whether NMDAR is necessary for experience-dependent homeostatic synaptic plasticity in V1, we aimed to specifically knock out NMDARs in principal neurons. This was achieved by targeted injection of an adeno-associated viral construct expressing Cre-GFP under the control of the CaMKII promoter (AAV9.CaMKII.Cre-eGFP; Cre-GFP condition) into V1 L2/3 of NR1flox-transgenic mice (Tsien et al., 1996). In this scheme, the expression of Cre recombinase leads to excision of the Grin1 gene, which encodes the obligatory NMDAR NR1 (GluN1) subunit. To control for effects only due to viral transfection, a second group of NR1flox transgenics were injected with a GFP-expressing viral construct (AAV9.CaMKII.GFP; GFP-only condition). We verified that viral transfection efficiency was similar for both constructs by quantifying the percentage of GFP-positive cells relative to the total number of neurons in a given tissue section of V1 L2/3 (Fig. 1A). To determine whether Cre-GFP condition leads to effective KO of NMDARs, we used whole-cell voltage clamp to measure NMDAR/AMPAR ratios after viral injections. We corroborated the specificity of the functional NMDAR KO by also measuring NMDAR/AMPAR ratios from non-GFP-expressing neurons that were neighbors to the KO cells (neighbors) (Fig. 1B,C). We found a significant decrease in NMDAR currents for NMDAR KO cells (NMDAR KO; Cre-GFP) 7 d after viral injection (Fig. 1C). These results confirm both the specificity and the effectiveness of the virally mediated NMDAR KO used in this study.
NMDAR KO abolishes experience-dependent homeostatic changes in synaptic strength
Next we investigated whether NMDARs play a role in homeostatic synaptic plasticity by measuring changes in the strength of excitatory synapses on V1 L2/3 pyramidal neurons following manipulations to visual experience in the presence or absence of NMDARs. Homeostatic synaptic plasticity has been characterized both in vitro and in vivo as an increase in synaptic strength after prolonged periods of decreased neuronal activity and a decrease in synaptic strength after periods of increased activity (O'Brien et al., 1998; Turrigiano et al., 1998; Desai et al., 2002; Goel and Lee, 2007). Previous studies have established that 2 d of visual deprivation in the form of DE increases the strength of excitatory synaptic transmission, as measured by mEPSC amplitude, which is rapidly reversed by reinstating visual experience for a short period (LE) (Goel and Lee, 2007; Gao et al., 2010).
In GFP-only control neurons, the average mEPSC amplitude was significantly increased after 2 d of DE and returned to normal-reared control (Ctl) values after 2 h of LE (Fig. 2A). Changes in the average mEPSC amplitude was also evident in the distribution of mEPSC amplitudes plotted in cumulative probability graphs (Fig. 2A), where the distribution of mEPSC amplitudes of control and DE group were significantly different while those between control and LE did not show statistical significance. Alterations in visual experience had no significant effect on the average frequency of mEPSCs of GFP-only condition neurons (Fig. 2A). These results are consistent with previous studies showing that homeostatic synaptic plasticity in V1 L2/3 mainly manifests as postsynaptic change in AMPARs (Goel et al., 2006, 2011; He et al., 2012).
Figure 2.
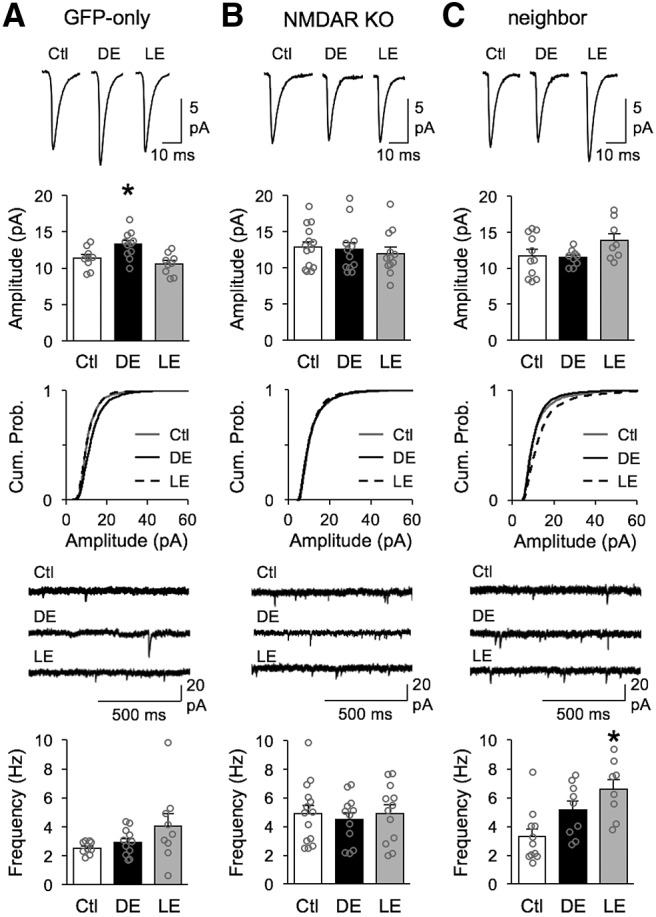
NMDAR KO neurons lack homeostatic regulation of mEPSCs. Top row, Average mEPSC traces from normal-reared (Ctl), 2 d DE, and 2 h LE. Second row, Bar graph comparison of average mEPSC amplitude from Ctl, DE and LE groups. Average mEPSC amplitude for each cell is plotted in gray circle. Third row, Cumulative probability graphs of mEPSC amplitudes from Ctl (gray solid line), DE (black solid line, and LE (black dashed line). Fourth row, Example mEPSC recording traces from Ctl (top), DE (middle) and LE (bottom). Bottom row, Comparison of average mEPSC frequency across Ctl, DE and LE groups. Average mEPSC frequency for each cell is plotted in gray circle. A, Results from neurons transfected with GFP-only virus. There was a significant increase in average mEPSC amplitude with DE which is reversed by LE (mean amplitude: Ctl = 11.38 ± 0.51 pA, DE = 13.29 ± 0.55 pA, LE = 10.59 ± 0.49 pA; one-way ANOVA: F(2,26) = 7.213, *p = 0.0032; Tukey's multiple-comparisons post hoc: Ctl vs DE *p = 0.040, Ctl vs LE: p = 0.574, DE vs LE *p = 0.003). DE significantly shifted the cumulative probability curve of mEPSC amplitudes to the right with DE (Kolmogorov–Smirnov test: *p < 0.0001), which then returned to Ctl distribution with LE (Kolmogorov–Smirnov test: p = 0.0138). There was no significant change in mEPSCs frequency across groups (mean frequency: Ctl = 2.43 ± 0.14 Hz, DE = 2.92 ± 0.28 Hz, LE = 3.30 ± 0.53 Hz; one-way ANOVA: F(2,26) = 1.196, p = 0.3192). B, Results from Cre-GFP-transfected neurons. NMDAR KO neurons failed to undergo significant changes in average mEPSC amplitude (Ctl = 12.85 ± 0.76 pA, DE = 12.55 ± 0.95 pA, LE = 11.96 ± 0.86 pA; one-way ANOVA: F(2,35) = 0.2863, p = 0.7528). Despite no difference in average mEPSC amplitude, cumulative probability curves of mEPSC amplitudes from Cre-GFP-expressing NMDAR KO neurons show a slight shift toward higher amplitudes in Ctl group relative to DE (Kolmogorov–Smirnov test: p = 0.0005) and LE (Kolmogorov–Smirnov test: p = 0.0005), but there was no significant difference between DE and LE (Kolmogorov–Smirnov test: p = 0.1441). There was no significant change in the average mEPSC frequency across groups (Ctl = 4.92 ± 0.57 Hz, DE = 4.49 ± 0.48 Hz, LE = 4.93 ± 0.58 Hz; one-way ANOVA: F(2,35) = 0.1947, p = 0.8240). C, Results from neighbor neurons that did not express Cre-GFP. There was no significant change in the average mEPSCs amplitude across groups (Ctl = 11.71 ± 0.88 pA, DE = 11.47 ± 0.36 pA, LE = 13.86 ± 0.97 pA; one-way ANOVA: F(2,25) = 2.465, p = 0.1054). Although there was no significant difference in cumulative probability of mEPSC amplitudes between Ctl and DE values (Kolmogorov–Smirnov test: p = 0.0168), there was a significant shift toward larger values for LE when compared with DE (Kolmogorov–Smirnov test: *p < 0.0001) or Ctl (Kolmogorov–Smirnov test: *p < 0.0001). There was a significant change in the average mEPSC frequency after LE relative to control conditions (Ctl = 3.28 ± 0.55 Hz, DE = 5.15 ± 0.62 Hz, LE = 6.57 ± 0.71 Hz; one-way ANOVA *p = 0.0034, F(2,25) = 7.182; Tukey's multiple-comparisons post hoc: Ctl vs DE p = 0.091, Ctl vs LE *p = 0.003, DE vs LE: p = 0.291).
In contrast, mEPSCs recorded from NMDAR-KO neurons (Cre-GFP condition) lacked regulation by changes in visual experience. There was no significant change in either the average amplitude or frequency of mEPSCs across control, DE or LE groups (Fig. 2B). Moreover, we did not observe any significant difference in mEPSC amplitude distribution across the 3 groups, as shown by overlapping cumulative probability graphs (Fig. 2B). There was no significant difference in basal mEPSC amplitude between normal-reared GFP-only controls and NMDAR KO neurons (Student's t test: t = 1.416, p = 0.1713). However, we noted a significant increase in baseline frequency of mEPSC in control normal-reared NMDAR KO neurons when compared with normal-reared GFP-only neurons (GFP-only: 2.5 ± 0.15 Hz, n = 9; NR1 KO: 4.9 ± 0.57 Hz, n = 14; unpaired Student's t test: t = 3.258, *p = 0.0038). This is similar to an observation made in a previous study measuring mEPSCs from NMDAR KO neurons in CA1 (Adesnik et al., 2008), which implicated NMDARs in regulating the number of functional synapses. Unexpectedly, data from neighbor neurons, which did not express Cre-GFP and have intact NMDAR current (Fig. 1C), also failed to modulate the average mEPSC amplitude with changes in visual experience (Fig. 2C). Although there was no significant change in the average mEPSC amplitude across groups, there was a statistically significant increase in the distribution of mEPSC amplitudes of LE group as seen in the cumulative probability graph (Fig. 2C). In addition, unlike the NMDAR-KO neurons or GFP-only condition, these neighbor neurons showed significant increase in mEPSC frequency after LE relative to control conditions (Fig. 2C). At this point, we cannot explain the phenotype of neighbor neurons except that NMDAR KO may not simply have a cell autonomous regulation of homeostatic plasticity in V1 L2/3 neurons. In any case, our results indicate that knocking out NMDARs prevents experience-dependent homeostatic synaptic plasticity and therefore support a necessary role of NMDARs in this process.
NMDAR function is required for experience-dependent homeostatic synaptic plasticity
Our data so far suggest that NMDAR KO prevents experience-dependent homeostatic synaptic plasticity. One caveat of our results from virally mediated NMDAR KO experiments is that NMDAR KO cells lacked upscaling by DE, hence we could not confirm whether NMDAR is required also for downscaling of mEPSCs when DE mice are reexposed to light. To test this, a more acute manipulation of NMDAR function is needed hence we used pharmacology to acutely inhibit NMDAR function just during the LE. We blocked NMDAR function pharmacologically by administration of d-CPP, which is a selective and competitive antagonist of NMDAR (Lehmann et al., 1987). Mice in the LE group were placed in the dark room for 2 d without any drug to allow normal scaling up process by DE, and then received d-CPP via an intraperitoneal injection (10 mg/kg) 10 min before light reexposure. To control for intraperitoneal injection, a group of mice received the same volume of saline injection instead of d-CPP before light reexposure. This design allows for specific testing of the role of NMDAR in LE-induced downscaling, which was not possible to determine in the NMDAR-KO condition, where DE-induced upscaling was absent. To determine the effect of LE, we also had a group of control normally reared and DE mice receiving saline. Because DE induced upscaling requires 2 d, saline was administered into the lateral ventricle using an osmotic mini-pump coupled to a cannula to allow 2 d of saline infusion during DE. Control normally reared mice also received 2 d of saline via osmotic minipump to control for any effect of osmotic minipump surgery. We found that d-CPP injection right before LE prevented the normal downscaling of average mEPSC amplitude (Fig. 3A), which was also evident when comparing the cumulative probability of mEPSCs recorded from saline LE versus d-CPP LE groups (Fig. 3B). There was no significant difference in average mEPSC frequency across groups (Fig. 3C). These results suggest that NMDAR function is also required for downscaling mEPSCs in the LE condition.
Figure 3.
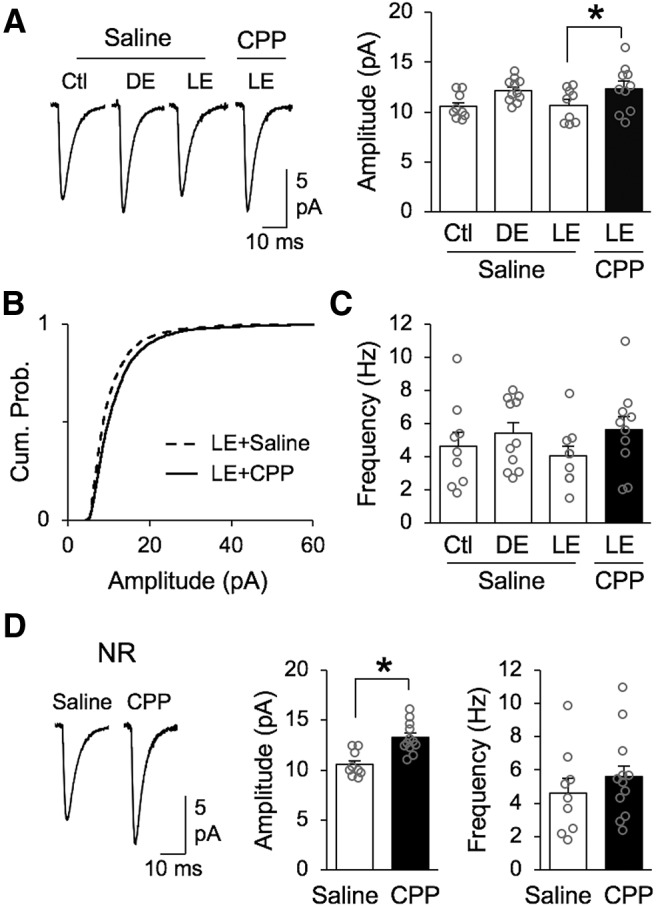
Lack of visual experience-dependent scaling down of mEPSCs with NMDAR blockade. A, Comparison of average mEPSC amplitude changes in saline-treated groups and LE group that was treated with d-CPP to block NMDAR activity. Left, Average mEPSC traces from saline treated normal-reared (Ctl), 2 d DE, and 2 h LE compared with d-CPP treated LE group. Right, Bar graph comparison of average mEPSC amplitude from saline treated Ctl, DE and LE groups compared with d-CPP treated LE group (Saline Ctl = 10.55 ± 0.42 pA, Saline DE = 12.14 ± 0.35 pA, Saline LE = 10.69 ± 0.55 pA, CPP LE = 12.35 ± 0.73 pA; ANOVA: F(3,35) = 3.139, *p = 0.0375; Bonferroni's multiple-comparisons test: saline LE vs CPP LE *p < 0.05). Average mEPSC amplitude for each cell is plotted as gray circle. B, Cumulative probability of mEPSC amplitudes from saline treated LE group (black dashed line) and d-CPP treated LE group (black solid line) show statistically significant difference (Kolmogorov–Smirnov test: *p < 0.0001). C, There was no significant difference in average mEPSC frequency across groups (saline Ctl = 4.62 ± 0.85 Hz, saline DE = 5.41 ± 0.64 Hz, saline LE = 4.05 ± 0.61 Hz, CPP LE = 5.62 ± 0.82 Hz; ANOVA: F(3,35) = 0.9418, p = 0.4309). Average mEPSC frequency for each cell is plotted as gray circle. D, Treatment of d-CPP for 2 d in control normal-reared mice significantly increased the average mEPSC amplitude compared with saline treated controls. Left, Average mEPSC traces. Middle, Comparison of average mEPSC amplitude (saline Ctl: 10.55 ± 0.42 pA, n = 9; d-CPP Ctl: 13.19 ± 0.52 pA, n = 10; unpaired Student's t test t(17) = 3.88, *p = 0.0012). Right, Comparison of average mEPSC frequency (saline Ctl: 4.62 ± 0.85 Hz, n = 9; d-CPP Ctl: 5.59 ± 0.73 Hz, n = 12; unpaired Student's t test t(19) = 0.85, p = 0.4031).
We also attempted to determine whether blocking NMDAR function with d-CPP blocks scaling up of mEPSCs with DE as observed in NMDAR KO neurons. This was to determine whether the failure to scale up mEPSCs in NMDAR KO neurons is due to missing the NMDAR protein itself, which is known to have a structural role in organizing downstream signaling molecules at synapses via its intracellular domain (Sprengel et al., 1998; Köhr et al., 2003), or absence of NMDAR function. For the purpose of this experiment d-CPP was perfused for 2 d into the lateral ventricle through an osmotic minipump coupled to a cannula for Ctl normal-reared or DE animals. Unexpectedly, we found that 2 d of d-CPP infusion in control normal-reared mice significantly increased the amplitude of mEPSCs when compared with mice receiving the same duration of saline (Fig. 3D). This presents difficulty in interpreting our results from d-CPP-treated DE mice (average mEPSC amplitude = 11.52 ± 0.45 pA, n = 13). Despite the lack of conclusive data from d-CPP-treated DE group, our result from LE group suggests that functional NMDARs are required for rapid downscaling mEPSCs with visual experience. Together with our NMDAR-KO data, these results support the previous conclusion that functional NMDARs are required to undergo proper experience-dependent synaptic scaling.
NMDAR disruption does not alter overall postsynaptic activity
A potential concern regarding the lack of homeostatic adaptation observed with NMDAR function block is that it may reflect an inability of the network to modulate activity levels with visual experience. Changes in postsynaptic activity levels are thought to drive homeostatic synaptic plasticity (Ibata et al., 2008; Goold and Nicoll, 2010; but see Fong et al., 2015). Therefore, we investigated whether disrupting NMDAR function altered the overall activity of V1 L2/3 neurons. To do this, we used the expression of the immediate early gene c-Fos as a proxy for neuronal activation under different conditions (Hoffman et al., 1993; Joo et al., 2016).
We first examined how global block of NMDAR function by d-CPP may have altered V1 L2/3 neurons, hence compared c-Fos expression in V1 L2/3 neurons under Ctl, DE and LE conditions in saline and d-CPP infused mice (Fig. 4A–C). As in our mEPSC recording studies (Fig. 3), Ctl and DE group received saline or d-CPP via osmotic pump for 2 d, whereas the LE group was placed in a darkroom for 2 d to allow normal DE-induced up-scaling and only received saline or d-CPP via intraperitoneal injection 10 min before light reexposure. V1 slices were costained for cFos and NeuN (neuronal marker), and the fraction of c-Fos-positive neurons in L2/3 were quantified by dividing the number of c-Fos-positive cells by the number of NeuN positive cells. We found that the fraction of c-Fos-positive neurons decreased with DE and returned to control levels with LE in saline-infused mice, which is consistent with a reduction in activity levels with visual deprivation. We observed the same pattern of regulation in c-Fos-positive neuronal fraction in mice infused with d-CPP, which suggests that a global block of NMDAR function in the whole brain does not grossly alter the level of neuronal activation leading to c-Fos expression in V1 L2/3.
Figure 4.
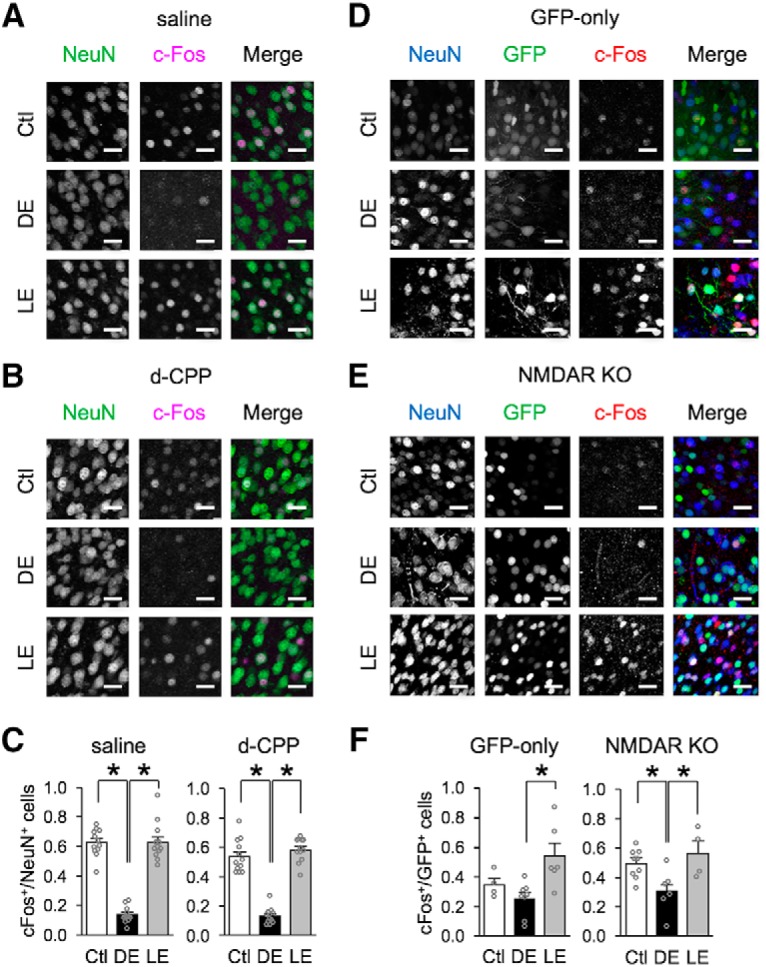
Comparison of neuronal activity measured with c-Fos expression. A–C, Comparison of c-Fos expression in V1 L2/3 neurons from Ctl, DE, and LE mice treated with saline or d-CPP. Representative confocal images of V1 L2/3 from Ctl, DE, and LE mice receiving saline (A) or d-CPP (B) infusion. Sections were stained with NeuN (green) and c-Fos (magenta). Scale bars, 36 μm. C, Comparison of quantified fraction of c-Fos-positive neurons, which were calculated as (number of c-Fos-positive neurons)/(number of NeuN positive neurons). For the saline group, DE significantly decreased the fraction of c-Fos-positive neurons, which increased to Ctl values with LE (Ctl = 0.62 ± 0.03, DE = 0.14 ± 0.02, LE = 0.63 ± 0.04; ANOVA: F(2,33) = 103.24, *p < 0.0001; Tukey's multiple-comparisons post hoc: Ctl vs DE *p < 0.0001, Ctl vs LE p = 0.9931, DE vs LE *p < 0.0001). For d-CPP group, DE significantly decreased the fraction of c-Fos-positive neurons, which increased to Ctl values with LE (Ctl = 0.54 ± 0.32, DE = 0.13 ± 0.02, LE = 0.58 ± 0.02; ANOVA: F(2,32) = 93.5424, *p < 0.0001; Tukey's multiple-comparisons post hoc: Ctl vs DE *p < 0.0001, Ctl vs LE p = 0.4234, DE vs LE *p < 0.0001). D–F, Comparison of c-Fos expression in GFP transfected V1 L2/3 neurons from Ctl, DE or LE mice. Representative confocal images of V1 L2/3 from NR1-flox mice that received viral transfection of GFP-only (D) or Cre-GFP (NMDAR KO) (E). Sections were stained with NeuN (blue) and c-Fos (red). GFP expression from either GFP-only or Cre-GFP is shown in green. Scale bars, 36 μm. F, Comparison of the fraction of c-Fos-positive GFP neurons, which were calculated as (number of c-Fos- and GFP-positive neurons)/(number of total GFP positive neurons). For GFP-only group, there was a significant increase in the fraction of c-Fos-positive GFP neurons following LE compared with DE (Ctl = 0.35 ± 0.04, DE = 0.25 ± 0.04, LE = 0.54 ± 0.09; ANOVA: F(2,15) = 6.35, *p = 0.0100; Tukey's multiple-comparisons test: Ctl vs DE p = 0.5654, Ctl vs LE p = 0.1503, DE vs LE **p = 0.0077). In the NMDAR-KO (Cre-GFP) group, there was a significant decrease in the fraction of c-Fos-positive Cre-GFP neurons in DE, which increased back to Ctl levels with LE (Ctl = 0.49 ± 0.03, DE = 0.31 ± 0.06, LE = 0.56 ± 0.08; ANOVA: F(2,16) = 5.52, *p = 0.0149; Tukey's multiple-comparisons test: Ctl vs DE *p = 0.04, Ctl vs LE = 0.6629, DE vs LE *p = 0.0212).
To test if selective KO of NMDAR in V1 neurons also preserves neuronal activity across visual manipulations, we compared the fraction of c-Fos-positive neurons after viral KO of NMDARs by expressing Cre-GFP or control-GFP in NR1flox mice (Fig. 4D–F). Here, we only quantified the fraction of c-Fos-positive cells among neurons that were colabeled with GFP and NeuN, so the quantification corresponds to activity of GFP- or Cre-GFP-transfected neurons. In V1 sections from control GFP-expressing mice, we did not observe a clear downregulation of c-Fos expression in control GFP-expressing neurons with DE, but there was significant increase in c-Fos expression with LE. In V1 sections from Cre-GFP-expressing mice (NMDAR KO), we found that DE decreased c-Fos expression which returned to normal levels with LE similar to what we saw in saline infused animals. Despite the caveat that we cannot explain the lack of a significant decrease in c-Fos expression with DE in control GFP-expressing neurons, our data nonetheless suggest that KO of NMDAR in neurons does not grossly alter their activity levels across different visual manipulations. Collectively, our results suggest that the disruption in homeostatic regulation of excitatory synapses in the absence of NMDAR function is not likely due to major alterations in the overall activity of V1 L2/3 neurons.
Assessing neural activity with immediate early gene expression, such as c-Fos, has innate limitation in that they can only monitor whether the neural activity is beyond the threshold for immediate early gene induction, but cannot determine fine-scale changes in neural activity. To more directly measure the effect of NMDAR blockade on V1 L2/3 neuronal activity, we performed in vivo calcium imaging from awake mice before and after CPP injection (Fig. 5A). Individual neurons sometimes displayed differences in response to moving sinusoidal gratings before and after CPP injection (Fig. 5B). However, the distribution of these differences was not significantly different from that for control mice receiving saline for spontaneous activity measured during blank screen presentation (Fig. 5C, left) or activity measured during presentation of visual stimuli (Fig. 5C, middle). This also held true if we restricted analysis only to neurons that were significantly visually activated (Fig. 5C, right). NMDA spikes have previously been implicated in stimulus selectivity of layer 4 neurons in the barrel cortex (Lavzin et al., 2012), so we considered the possibility that CPP might affect orientation tuning of the neurons (Fig. 5D). The response at preferred orientation did not change significantly in mice receiving saline versus CPP (Fig. 5D, left). Likewise, the changes in orientation selectivity index were not significant (Fig. 5D, right), although there was a trend that CPP may have affected OSI in a small subpopulation of L2/3 neurons. Overall, our results indicate that blocking NMDARs with CPP is unlikely to grossly affect responses of V1 L2/3 neurons in a way that could account for the observed effects on plasticity.
Figure 5.
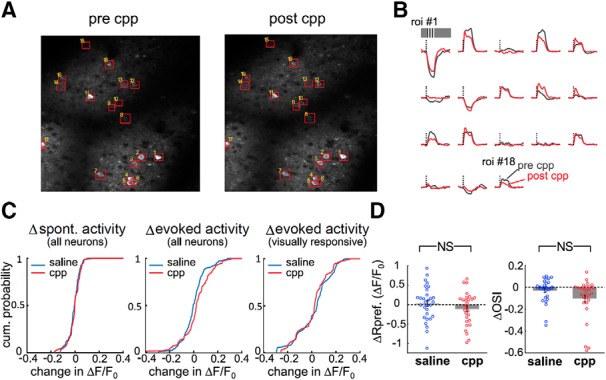
Blocking NMDARs with d-CPP injection does not acutely affect visually evoked responses in V1. A, Example of imaged region in an Emx1-Ai96 mouse before (left) and after (right) intraperitoneal CPP injection. Both images are maximum projections of GCaMP6s fluorescence. B, Visually evoked responses from ROIs shown in A before (gray) and after (red) CPP injection. The dashed line denotes onset of the visual stimulus and its height corresponds to 0.5 ΔF/F0. Each trace is 11 s long. C, Distribution of visual response change after application of saline (blue) versus CPP (red). Left, Comparison of changes in spontaneous activity of all neurons before and after saline or CPP injection. Spontaneous activity was measured during a 7 s window when a blank screen was presented. n = 107 neurons across 7 mice for saline and n = 81 neurons across 5 mice for CPP. Kolmogorov–Smirnov test, p = 0.448. Middle, Response change for all activated neurons regardless of whether the level of activation is significant. The same neurons are shown as in the left panel. Kolmogorov–Smirnov test, p = 0.087. Right, Response change only for significantly visually activated neurons. n = 36 neurons across 7 mice for saline and n = 36 neurons across 6 mice for CPP. Kolmogorov–Smirnov test, p = 0.46. D, Left, Change of response at preferred orientation after application of saline (blue) versus CPP (red); unpaired t test, p = 0.24. Right, Change of orientation selectivity after application of saline (blue) versus CPP (red); unpaired t test, p = 0.069. Only neurons with significant orientation tuning were included in this analysis (n = 30 neurons for saline conditions and n = 28 neurons for CPP condition). NS: not statistically significant.
Discussion
The mechanisms of homeostatic adaptation to changes in sensory experience has been largely explained by two distinct models: sliding threshold and synaptic scaling. Although these two models are considered different, there is emerging body of recent work suggesting that these two modes of homeostatic plasticity may share similarities and may interact with each other to regulate synaptic strength (for recent discussions, see Fox and Stryker, 2017; Keck et al., 2017). Furthermore, there is evidence that sliding threshold or synaptic scaling mode of homeostatic plasticity may be used depending on the regime of activity changes in vivo (Bridi et al., 2018). Based on the consensus of the field that synaptic scaling is largely independent of NMDAR activation, here we tested the role of NMDARs in homeostatic synaptic plasticity induced in vivo by changes in visual experience. By disrupting NMDAR function through cell specific KO or pharmacology, we showed that the principal neurons within L2/3 of V1 require functional NMDARs to undergo proper visual experience-dependent homeostatic adaptation of excitatory synaptic strength. Disruption of normal experience-dependent homeostatic plasticity by removing NMDAR function was not due to gross changes in the activity of V1 L2/3 neurons. Our results support a role for NMDAR-dependent mechanisms in homeostatic synaptic plasticity induced in vivo.
We observed that NMDAR function is required for proper scaling of mEPSCs in V1 L2/3 neurons following a few days of DE or brief reexposure to light (LE). Although previous studies have shown that there is coregulation of NMDAR together with AMPAR under inactivity conditions (Watt et al., 2000) and changes in NMDAR function after visual deprivation (Quinlan et al., 1999; Philpot et al., 2003; Guo et al., 2012), homeostatic synaptic scaling is largely thought of as occurring independent of NMDAR activity (Turrigiano et al., 1998; Turrigiano, 2008) and is absent in several genetic models with preserved LTP/LTD (Stellwagen and Malenka, 2006; Hu et al., 2010). It has previously been proposed that a switch in NMDAR function slides the synaptic modification threshold for LTP/LTD induction after DE (Quinlan et al., 1999; Philpot et al., 2003; Guo et al., 2012). Our results suggest a possibility that scaling up of mEPSCs could be a consequence of sliding down of synaptic modification threshold. Lowered synaptic modification threshold by DE would promote LTP across a large population of synapses, and hence manifest as global scaling up of excitatory synapses. This would imply that the amount of activity in V1 under DE condition is sufficient to act on the lowered threshold to induce NMDAR-dependent LTP. This contradicts in vitro studies done in cultured neurons, where prolonged blockade of action potentials was able to scale up excitatory synapses. Our data suggest that this may not be the case in vivo, where we surmise there may be sufficient activity in the deprived cortex that can activate NMDARs to potentiate synaptic strength across a large number of synapses following a reduction in LTP threshold. Indeed, we recently reported that homeostatic upscaling of mEPSCs in V1 L2/3 neurons with DE is dependent on spontaneous activity and upregulation of GluN2B (Bridi et al., 2018). GluN2B containing NMDARs have a longer current duration (Monyer et al., 1994), which may enable better integration of lower frequency activity as occurs during spontaneous firing. Our current data add to this by showing that NMDAR function in V1 L2/3 neurons is necessary for upscaling with DE using cell-type specific genetic KO, and also demonstrate that NMDAR function is necessary for scaling down of mEPSCs with LE.
In addition to disrupting normal visual experience-dependent regulation of mEPSCs, we unexpectedly observed that blocking NMDAR function with d-CPP for 2 d significantly scales up mEPSCs under control normal-reared conditions. This suggests that there may be on-going activation of NMDARs by normal visual experience that actively reduces mEPSCs. This is reminiscent of what we observed in Arc KOs, which also show larger basal mEPSCs in V1 L2/3 neurons under normal-reared conditions and lack visual experience-dependent regulation of mEPSCs (Gao et al., 2010). Although d-CPP scaled up mEPSCs under basal conditions, we did not observe an increase in mEPSC amplitude in the NMDAR KO neurons (Fig. 2). It seems unlikely that the absence of basal “upscaling” in NMDAR KO was simply due to the incomplete removal of preexisting NMDARs during the 6–7 d Cre expression because the NMDAR current is mostly absent at that time point (Fig. 1). It is possible that the difference may have resulted from d-CPP having a more global effect while NMDAR KO was done in a cell-type specific manner in V1 L2/3. We cannot rule out an alternative possibility that complete blockade of NMDAR triggers mEPSCs to potentiate, which would be consistent with some of the in vitro studies showing NMDAR blockade facilitates scaling up of synapses (Sutton et al., 2006; Aoto et al., 2008) by blocking spontaneous Ca2+ transients mediated by NMDARs (Reese and Kavalali, 2015). Despite such caveats, the fact that both methods detect failures in experience-dependent homeostatic regulation suggests that it is the function of NMDARs that is critical for proper regulation of AMPAR-mEPSCs by changes in visual experience.
Despite initial studies showing induction of synaptic scaling as being largely independent of NMDARs, there is some evidence from previous studies in vitro demonstrating interaction between NMDAR function and synaptic scaling. For example, blocking NMDARs has been shown to accelerate synaptic upscaling in cultured neurons (Sutton et al., 2006) and decreasing NMDAR calcium permeability has been shown to downscale AMPAR currents (Pawlak et al., 2005). Other potential mechanism relating NMDAR activation with scaling involve “unsilencing” of synapses after activity blockade in vitro that promotes further LTP induction (Arendt et al., 2013). These findings suggest that NMDAR activity can also have profound influence on synaptic scaling mechanisms in addition to sliding the threshold for LTP/LTD.
Synaptic scaling has been largely considered a cell-autonomous process that is triggered by readout of postsynaptic spikes, or more precisely postsynaptic depolarization (Ibata et al., 2008; Goold and Nicoll, 2010). For example, optogenetic activation of postsynaptic neurons was shown to be sufficient to drive down-scaling of excitatory synapses (Goold and Nicoll, 2010), and blocking somatic spikes was sufficient to scale up synapses (Ibata et al., 2008). However, a recent study suggested that synaptic scaling is not dependent on postsynaptic spike rate per se, but due to changes in glutamatergic inputs (Fong et al., 2015). This suggests that the level of activation of glutamate receptors could ultimately be the condition monitored by neurons to trigger homeostatic adaptation. Our data are consistent with the latter, where glutamatergic transmission level may be detected by the activation of NMDARs to induce changes in AMPAR-mediated mEPSCs.
Our data provide in vivo evidence for a homeostatic mechanism that requires NMDAR activation to cope with changes in visual experience. These results suggest either a role for NMDAR function in in vivo synaptic scaling or that homeostatic scaling of synapses is a manifestation of Hebbian forms of plasticity triggered by lowered or increased synaptic modification threshold according to changes in visual experience. If it is the latter, a major implication is that in vivo homeostasis could be implemented in an input specific manner. Indeed, DE has been shown to increase the synaptic strength of lateral intracortical inputs to V1 L2/3 neurons without affecting those originating from L4 (Petrus et al., 2015), which could be the basis for non-multiplicative synaptic scaling observed in adult V1 (Goel and Lee, 2007). A recent study reported that homeostatic scaling of dendritic spines in V1 following monocular enucleation occurs in a dendritic branch specific manner (Barnes et al., 2017), which is consistent with input specific regulation. Input-specific homeostatic synaptic plasticity has also been observed in the hippocampus where inactivity scales up excitatory synaptic transmission in feedforward synapses while decreasing mEPSC frequency in recurrent synapses within CA3 (Kim and Tsien, 2008). Collectively, these observations suggest that input-specific homeostatic adaptation is likely a general phenomenon across different brain circuits that receive input from several sources. Synapse-specific homeostatic plasticity has been observed in reduced preparations where activity was selectively manipulated at individual synapses via genetic methods of silencing specific synapses (Hou et al., 2008; Lee et al., 2010; Béïque et al., 2011). One such study demonstrated that NMDAR subunit composition can be selectively altered at individual synapses (Lee et al., 2010), which allows for synapse-specific adjustment of sliding threshold. Such input-specific homeostatic control will allow cortical neurons that participate in multiple functional circuits to adapt effectively to changes in select inputs to provide stability without compromising the function of other synapses. Our results suggest that one way to achieve such input-specific homeostatic control is via NMDAR-dependent plasticity mechanisms.
Footnotes
This work was supported by the National Institutes of Health (Grant #R01-EY014882 to H.-K.L.). We thank Alfredo Kirkwood for helpful discussion and comments on this manuscript.
The authors declare no competing financial interests.
References
- Abraham WC, Bear MF (1996) Metaplasticity: the plasticity of synaptic plasticity. Trends Neurosci 19:126–130. 10.1016/S0166-2236(96)80018-X [DOI] [PubMed] [Google Scholar]
- Adesnik H, Li G, During MJ, Pleasure SJ, Nicoll RA (2008) NMDA receptors inhibit synapse unsilencing during brain development. Proc Natl Acad Sci U S A 105:5597–5602. 10.1073/pnas.0800946105 [DOI] [PMC free article] [PubMed] [Google Scholar]
- Aoto J, Nam CI, Poon MM, Ting P, Chen L (2008) Synaptic signaling by all-trans retinoic acid in homeostatic synaptic plasticity. Neuron 60:308–320. 10.1016/j.neuron.2008.08.012 [DOI] [PMC free article] [PubMed] [Google Scholar]
- Arendt KL, Sarti F, Chen L (2013) Chronic inactivation of a neural circuit enhances LTP by inducing silent synapse formation. J Neurosci 33:2087–2096. 10.1523/JNEUROSCI.3880-12.2013 [DOI] [PMC free article] [PubMed] [Google Scholar]
- Barnes SJ, Franzoni E, Jacobsen RI, Erdelyi F, Szabo G, Clopath C, Keller GB, Keck T (2017) Deprivation-induced homeostatic spine scaling in vivo is localized to dendritic branches that have undergone recent spine loss. Neuron 96:871–882.e5. 10.1016/j.neuron.2017.09.052 [DOI] [PMC free article] [PubMed] [Google Scholar]
- Béïque JC, Na Y, Kuhl D, Worley PF, Huganir RL (2011) Arc-dependent synapse-specific homeostatic plasticity. Proc Natl Acad Sci U S A 108:816–821. 10.1073/pnas.1017914108 [DOI] [PMC free article] [PubMed] [Google Scholar]
- Bridi MCD, de Pasquale R, Lantz CL, Gu Y, Borrell A, Choi SY, He K, Tran T, Hong SZ, Dykman A, Lee HK, Quinlan EM, Kirkwood A (2018) Two distinct mechanisms for experience-dependent homeostasis. Nat Neurosci 21:843–850. 10.1038/s41593-018-0150-0 [DOI] [PMC free article] [PubMed] [Google Scholar]
- Cooper LN, Bear MF (2012) The BCM theory of synapse modification at 30: interaction of theory with experiment. Nat Rev Neurosci 13:798–810. 10.1038/nrn3353 [DOI] [PubMed] [Google Scholar]
- Desai NS, Cudmore RH, Nelson SB, Turrigiano GG (2002) Critical periods for experience-dependent synaptic scaling in visual cortex. Nat Neurosci 5:783–789. 10.1038/nn878 [DOI] [PubMed] [Google Scholar]
- Fong MF, Newman JP, Potter SM, Wenner P (2015) Upward synaptic scaling is dependent on neurotransmission rather than spiking. Nat Commun 6:6339. 10.1038/ncomms7339 [DOI] [PMC free article] [PubMed] [Google Scholar]
- Fox K, Stryker M (2017) Integrating Hebbian and homeostatic plasticity: introduction. Philos Trans R Soc Lond B Biol Sci 372:20160413. 10.1098/rstb.2016.0413 [DOI] [PMC free article] [PubMed] [Google Scholar]
- Gao M, Sossa K, Song L, Errington L, Cummings L, Hwang H, Kuhl D, Worley P, Lee HK (2010) A specific requirement of Arc/Arg3.1 for visual experience-induced homeostatic synaptic plasticity in mouse primary visual cortex. J Neurosci 30:7168–7178. 10.1523/JNEUROSCI.1067-10.2010 [DOI] [PMC free article] [PubMed] [Google Scholar]
- Goel A, Lee HK (2007) Persistence of experience-induced homeostatic synaptic plasticity through adulthood in superficial layers of mouse visual cortex. J Neurosci 27:6692–6700. 10.1523/JNEUROSCI.5038-06.2007 [DOI] [PMC free article] [PubMed] [Google Scholar]
- Goel A, Jiang B, Xu LW, Song L, Kirkwood A, Lee HK (2006) Cross-modal regulation of synaptic AMPA receptors in primary sensory cortices by visual experience. Nat Neurosci 9:1001–1003. 10.1038/nn1725 [DOI] [PMC free article] [PubMed] [Google Scholar]
- Goel A, Xu LW, Snyder KP, Song L, Goenaga-Vazquez Y, Megill A, Takamiya K, Huganir RL, Lee HK (2011) Phosphorylation of AMPA receptors is required for sensory deprivation-induced homeostatic synaptic plasticity. PLoS One 6:e18264. 10.1371/journal.pone.0018264 [DOI] [PMC free article] [PubMed] [Google Scholar]
- Goldey GJ, Roumis DK, Glickfeld LL, Kerlin AM, Reid RC, Bonin V, Schafer DP, Andermann ML (2014) Removable cranial windows for long-term imaging in awake mice. Nat Protoc 9:2515–2538. 10.1038/nprot.2014.165 [DOI] [PMC free article] [PubMed] [Google Scholar]
- Goold CP, Nicoll RA (2010) Single-cell optogenetic excitation drives homeostatic synaptic depression. Neuron 68:512–528. 10.1016/j.neuron.2010.09.020 [DOI] [PMC free article] [PubMed] [Google Scholar]
- Guo Y, Huang S, de Pasquale R, McGehrin K, Lee HK, Zhao K, Kirkwood A (2012) Dark exposure extends the integration window for spike-timing-dependent plasticity. J Neurosci 32:15027–15035. 10.1523/JNEUROSCI.2545-12.2012 [DOI] [PMC free article] [PubMed] [Google Scholar]
- He K, Petrus E, Gammon N, Lee HK (2012) Distinct sensory requirements for unimodal and cross-modal homeostatic synaptic plasticity. J Neurosci 32:8469–8474. 10.1523/JNEUROSCI.1424-12.2012 [DOI] [PMC free article] [PubMed] [Google Scholar]
- Hoffman GE, Smith MS, Verbalis JG (1993) c-fos and related immediate early gene products as markers of activity in neuroendocrine systems. Front Neuroendocrinol 14:173–213. 10.1006/frne.1993.1006 [DOI] [PubMed] [Google Scholar]
- Hou Q, Zhang D, Jarzylo L, Huganir RL, Man HY (2008) Homeostatic regulation of AMPA receptor expression at single hippocampal synapses. Proc Natl Acad Sci U S A 105:775–780. 10.1073/pnas.0706447105 [DOI] [PMC free article] [PubMed] [Google Scholar]
- Hu JH, Park JM, Park S, Xiao B, Dehoff MH, Kim S, Hayashi T, Schwarz MK, Huganir RL, Seeburg PH, Linden DJ, Worley PF (2010) Homeostatic scaling requires group I mGluR activation mediated by Homer1a. Neuron 68:1128–1142. 10.1016/j.neuron.2010.11.008 [DOI] [PMC free article] [PubMed] [Google Scholar]
- Huang S, Treviño M, He K, Ardiles A, Pasquale Rd, Guo Y, Palacios A, Huganir R, Kirkwood A (2012) Pull-push neuromodulation of LTP and LTD enables bidirectional experience-induced synaptic scaling in visual cortex. Neuron 73:497–510. 10.1016/j.neuron.2011.11.023 [DOI] [PMC free article] [PubMed] [Google Scholar]
- Ibata K, Sun Q, Turrigiano GG (2008) Rapid synaptic scaling induced by changes in postsynaptic firing. Neuron 57:819–826. 10.1016/j.neuron.2008.02.031 [DOI] [PubMed] [Google Scholar]
- Ingrao JC, Johnson R, Tor E, Gu Y, Litman M, Turner PV (2013) Aqueous stability and oral pharmacokinetics of meloxicam and carprofen in male C57BL/6 mice. J Am Assoc Lab Anim Sci 52:553–559. [PMC free article] [PubMed] [Google Scholar]
- Joo JY, Schaukowitch K, Farbiak L, Kilaru G, Kim TK (2016) Corrigendum: stimulus-specific combinatorial functionality of neuronal c-fos enhancers. Nat Neurosci 19:642. 10.1038/nn0416-642a [DOI] [PubMed] [Google Scholar]
- Keck T, Keller GB, Jacobsen RI, Eysel UT, Bonhoeffer T, Hübener M (2013) Synaptic scaling and homeostatic plasticity in the mouse visual cortex in vivo. Neuron 80:327–334. 10.1016/j.neuron.2013.08.018 [DOI] [PubMed] [Google Scholar]
- Keck T, Toyoizumi T, Chen L, Doiron B, Feldman DE, Fox K, Gerstner W, Haydon PG, Hübener M, Lee HK, Lisman JE, Rose T, Sengpiel F, Stellwagen D, Stryker MP, Turrigiano GG, van Rossum MC (2017) Integrating Hebbian and homeostatic plasticity: the current state of the field and future research directions. Philos Trans R Soc Lond B Biol Sci 372:20160158. 10.1098/rstb.2016.0158 [DOI] [PMC free article] [PubMed] [Google Scholar]
- Kim J, Tsien RW (2008) Synapse-specific adaptations to inactivity in hippocampal circuits achieve homeostatic gain control while dampening network reverberation. Neuron 58:925–937. 10.1016/j.neuron.2008.05.009 [DOI] [PMC free article] [PubMed] [Google Scholar]
- Kirkwood A, Rioult MC, Bear MF (1996) Experience-dependent modification of synaptic plasticity in visual cortex. Nature 381:526–528. 10.1038/381526a0 [DOI] [PubMed] [Google Scholar]
- Köhr G, Jensen V, Koester HJ, Mihaljevic AL, Utvik JK, Kvello A, Ottersen OP, Seeburg PH, Sprengel R, Hvalby Ø (2003) Intracellular domains of NMDA receptor subtypes are determinants for long-term potentiation induction. J Neurosci 23:10791–10799. 10.1523/JNEUROSCI.23-34-10791.2003 [DOI] [PMC free article] [PubMed] [Google Scholar]
- Lavzin M, Rapoport S, Polsky A, Garion L, Schiller J (2012) Nonlinear dendritic processing determines angular tuning of barrel cortex neurons in vivo. Nature 490:397–401. 10.1038/nature11451 [DOI] [PubMed] [Google Scholar]
- Lee MC, Yasuda R, Ehlers MD (2010) Metaplasticity at single glutamatergic synapses. Neuron 66:859–870. 10.1016/j.neuron.2010.05.015 [DOI] [PMC free article] [PubMed] [Google Scholar]
- Lehmann J, Schneider J, McPherson S, Murphy DE, Bernard P, Tsai C, Bennett DA, Pastor G, Steel DJ, Boehm C (1987) CPP, a selective N-methyl-D-aspartate (NMDA)-type receptor antagonist: characterization in vitro and in vivo. J Pharmacol Exp Ther 240:737–746. [PubMed] [Google Scholar]
- Monyer H, Burnashev N, Laurie DJ, Sakmann B, Seeburg PH (1994) Developmental and regional expression in the rat brain and functional properties of four NMDA receptors. Neuron 12:529–540. 10.1016/0896-6273(94)90210-0 [DOI] [PubMed] [Google Scholar]
- O'Brien RJ, Kamboj S, Ehlers MD, Rosen KR, Fischbach GD, Huganir RL (1998) Activity-dependent modulation of synaptic AMPA receptor accumulation. Neuron 21:1067–1078. 10.1016/S0896-6273(00)80624-8 [DOI] [PubMed] [Google Scholar]
- Pawlak V, Schupp BJ, Single FN, Seeburg PH, Köhr G (2005) Impaired synaptic scaling in mouse hippocampal neurones expressing NMDA receptors with reduced calcium permeability. J Physiol 562:771–783. 10.1113/jphysiol.2004.076794 [DOI] [PMC free article] [PubMed] [Google Scholar]
- Petrus E, Rodriguez G, Patterson R, Connor B, Kanold PO, Lee HK (2015) Vision loss shifts the balance of feedforward and intracortical circuits in opposite directions in mouse primary auditory and visual cortices. J Neurosci 35:8790–8801. 10.1523/JNEUROSCI.4975-14.2015 [DOI] [PMC free article] [PubMed] [Google Scholar]
- Philpot BD, Espinosa JS, Bear MF (2003) Evidence for altered NMDA receptor function as a basis for metaplasticity in visual cortex. J Neurosci 23:5583–5588. 10.1523/JNEUROSCI.23-13-05583.2003 [DOI] [PMC free article] [PubMed] [Google Scholar]
- Pologruto TA, Sabatini BL, Svoboda K (2003) ScanImage: flexible software for operating laser scanning microscopes. Biomed Eng Online 2:13. 10.1186/1475-925X-2-13 [DOI] [PMC free article] [PubMed] [Google Scholar]
- Quinlan EM, Olstein DH, Bear MF (1999) Bidirectional, experience-dependent regulation of N-methyl-D-aspartate receptor subunit composition in the rat visual cortex during postnatal development. Proc Natl Acad Sci U S A 96:12876–12880. 10.1073/pnas.96.22.12876 [DOI] [PMC free article] [PubMed] [Google Scholar]
- Reese AL, Kavalali ET (2015) Spontaneous neurotransmission signals through store-driven Ca(2+) transients to maintain synaptic homeostasis. Elife 4:09262. 10.7554/eLife.09262 [DOI] [PMC free article] [PubMed] [Google Scholar]
- Sprengel R, Suchanek B, Amico C, Brusa R, Burnashev N, Rozov A, Hvalby O, Jensen V, Paulsen O, Andersen P, Kim JJ, Thompson RF, Sun W, Webster LC, Grant SG, Eilers J, Konnerth A, Li J, McNamara JO, Seeburg PH (1998) Importance of the intracellular domain of NR2 subunits for NMDA receptor function in vivo. Cell 92:279–289. 10.1016/S0092-8674(00)80921-6 [DOI] [PubMed] [Google Scholar]
- Steele PM, Mauk MD (1999) Inhibitory control of LTP and LTD: stability of synapse strength. J Neurophysiol 81:1559–1566. 10.1152/jn.1999.81.4.1559 [DOI] [PubMed] [Google Scholar]
- Stellwagen D, Malenka RC (2006) Synaptic scaling mediated by glial TNF-alpha. Nature 440:1054–1059. 10.1038/nature04671 [DOI] [PubMed] [Google Scholar]
- Sutton MA, Ito HT, Cressy P, Kempf C, Woo JC, Schuman EM (2006) Miniature neurotransmission stabilizes synaptic function via tonic suppression of local dendritic protein synthesis. Cell 125:785–799. 10.1016/j.cell.2006.03.040 [DOI] [PubMed] [Google Scholar]
- Tsien JZ, Huerta PT, Tonegawa S (1996) The essential role of hippocampal CA1 NMDA receptor-dependent synaptic plasticity in spatial memory. Cell 87:1327–1338. 10.1016/S0092-8674(00)81827-9 [DOI] [PubMed] [Google Scholar]
- Turrigiano GG. (2008) The self-tuning neuron: synaptic scaling of excitatory synapses. Cell 135:422–435. 10.1016/j.cell.2008.10.008 [DOI] [PMC free article] [PubMed] [Google Scholar]
- Turrigiano GG, Leslie KR, Desai NS, Rutherford LC, Nelson SB (1998) Activity-dependent scaling of quantal amplitude in neocortical neurons. Nature 391:892–896. 10.1038/36103 [DOI] [PubMed] [Google Scholar]
- Watt AJ, van Rossum MC, MacLeod KM, Nelson SB, Turrigiano GG (2000) Activity coregulates quantal AMPA and NMDA currents at neocortical synapses. Neuron 26:659–670. 10.1016/S0896-6273(00)81202-7 [DOI] [PubMed] [Google Scholar]