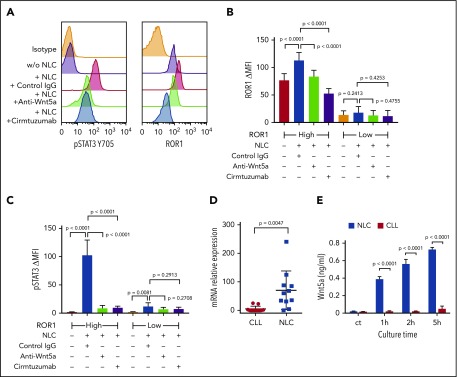
Figure 2.
NLC Express Wnt5a, which can induce ROR1-dependent CLL cell activation of STAT3 and upregulation of ROR1. (A) Flow cytometry analysis of pSTAT3 (Y705) and ROR1 in CLL cells cocultured with or without NLC for 16 hours with control IgG or anti-Wnt5a or cirmtuzumab. (B) Bar figures represent the intensity of ROR1 staining of CLL cells from ROR1high (n = 6) and ROR1low (n = 6) patients cocultured with or without NLC for 16 hours in the presence of control IgG, anti-Wnt5a, or cirmtuzumab. Error bars denote standard deviation. (C) Bar figures represent the levels of pSTAT3 ΔMFI in CLL cells from ROR1high (n = 6) and ROR1low (n = 6) patients cocultured with or without NLC for 16 hours in the presence of control IgG, anti-Wnt5a, or cirmtuzumab. Error bars denote standard deviation. (D) Quantitative real-time PCR analysis and comparison of WNT5A transcript levels in NLC vs CLL cells of the same patient (n = 11). Error bars denote standard deviation. (E) ELISA of Wnt5a in the medium of cell cultures containing 1 × 10⁴/mL NLC and 1 × 10⁴/mL CLL cells for 0, 1, 2, and 5 hours. Error bars denote standard deviation (n = 3).

