 The potential impact of TiO2 and Fe incorporated TiO2 nanoparticles at the organelle level has been reported.
Abstract
The potential impact of TiO2 and Fe incorporated TiO2 nanoparticles at the organelle level has been reported. The toxicity of the samples on mitochondria isolated from chicken liver tissue has been examined through mitochondrial swelling, membrane fluidity, ROS generation capacity, and activity of complex II. The toxic effect of TiO2 was prevented by incorporating Fe into the TiO2 matrix at different concentrations. The activity of the succinate dehydrogenase enzyme complex was affected and permeabilization of the mitochondrial inner membrane to H+ and K+ and its alteration in membrane fluidity at 100 μg mL–1 of nano-TiO2 dosage were investigated, which showed significant changes in the anisotropy of DPH-labeled mitochondria. Fe incorporation into the TiO2 matrix makes it more biocompatible by changing its structure and morphology.
Introduction
Titanium dioxide (TiO2) is a widely used industrial nanomaterial in sunscreens, lacquers, consumer products, paints, etc.1–4 The risk assessment of nano-TiO2 should be an important issue of modern society.5–7 Although many in vitro and some in vivo studies are reported for toxicity assessment of TiO2 at the cellular level,8–13 interaction with specific cell organelles is still scarce. Only limited reports are available, which reveal that TiO2 induces mitochondrial apoptosis in cells and damages the functional mitochondria.14–16 The role of mitochondria in animal cell death has been studied for a number of years. The opening of the mitochondrial permeability transition pore (mtPTP) has caused an increase in permeability to solutes and molecules, which leads to cell death.17,18 mtPTP is a high-conductance channel located between the mitochondrial inner and outer membrane, and the mtPTP opening induces mitochondrial biochemical and morphological abnormalities such as rupture of the outer membrane and the release of intermembrane components.
The osmotic swelling mechanism of mitochondria can cause nanoparticle toxicity in the body,19–21 but most intracellular toxicities from nanoparticles arise from the production of excess reactive oxygen species (ROS).22 ROS (such as hydroxyl radicals and superoxide) production under biological conditions is based on the ability of the nanoparticles to target mitochondria. High ROS levels are indicative of oxidative stress which can damage cells by peroxidizing lipids, altering proteins, and disrupting DNA and can also cause degenerative diseases, aging and cancer.23,24 The mitochondria are the target of TiO2 nanoparticles that have been phagocytosed by cells as well as a source for ROS production, and the disruption of the mitochondrial cell membrane would lead to the increase in ROS production. This decreases mitochondrial membrane potential and activation through apoptosis.25–27
There is an urgent need to develop safe-by-design strategies to make potentially hazardous but most widely used nano-TiO2 more biocompatible. TiO2 can be greatly improved by Fe incorporation. It opens up the possibility of changing the electronic structure and chemical composition along with the optical properties of TiO2 nanoparticles.28,29 Integration of Fe enhances the properties of TiO2via narrowing the band gap energy.30 Fe has been reflected as a suitable material, owing to the radius of Fe3+ (0.64 Å) being similar to that of Ti4+ (0.68 Å).31 Some previous studies show that Fe could be a safer idea to reduce the toxic effect of ZnO nanoparticles at cellular levels as well as in animal models. In consideration of this report, purposeful reduction of TiO2 toxic behaviour was achieved by Fe incorporation, which changed the material matrix to slow down the rate of release of the parent nanomaterial.32–34
In the present work, swelling of mitochondria was investigated by ultraviolet spectroscopy, the fluidity of the membrane and ROS generation were determined by fluorescence spectrometry and the activity of enzyme complex II was studied by MTT assay; the TiO2 sample induces mitochondrial swelling, thus causing the membrane fluidity and ROS generation and inhibiting respiration. Incorporation of different concentrations of Fe into TiO2 matrix showed significant prevention of swelling of mitochondria, fluidity of membrane. It helps to reduce the ROS production which eventually increases the enzymatic activity of complex II.
Materials and methods
Chemicals
Tetraisopropyl orthotitanate (TTIP), ethanol (C2H6O), anhydrous ferric chloride (FeCl3), hydrochloric acid (HCl), bovine serum albumin (BSA), ethylenediaminetetraacetic acid (EDTA), MTT powder, 2′,7′-dichlorodihydrofluorescein diacetate (DCFH-DA), ethylene glycol bis(2-aminoethyl)tetraacetic acid (EGTA), 1,6-diphenyl-1,3,5-hexatriene (DPH), rotenone, valinomycin, mannitol, sucrose, HEPES, and Tris-HCl were purchased from Sigma Aldrich. All reagents were of analytical reagent grade, and all solutions were prepared with deionized (DI) water, which was prepared from the Milli-Q-RO water purification system (Millipore).
Solution preparation
Buffer A contains 0.22 mol L–1 mannitol, 0.07 mol L–1 sucrose, 0.02 mol L–1 HEPES, 2 mmol L–1 Tris-HCl, and 1 mmol L–1 EDTA, along with 0.4% BSA. Buffer B contains 0.22 mol L–1 mannitol, 0.07 mol L–1 sucrose, 0.01 mol L–1 Tris-HCl, and 1 mmol L–1 EDTA. Buffer C contains 0.22 mol L–1 mannitol, 0.07 mol L–1 sucrose, and 1 mmol L–1 EDTA. Buffer D contains 0.3 mol L–1 sucrose, 20 mmol L–1 HEPES, 2 mmol L–1 MgCl2, 5 mmol L–1 KH2PO4, 20 mmol L–1 succinate, and 1 mol L–1 rotenone. Potassium acetate medium was prepared from 135 mmol L–1 K-acetate, 5 mmol L–1 HEPES, 0.1 mmol L–1 EGTA, 0.2 mmol L–1 EDTA, 1 g mL–1 valinomycin, and 2 mol L–1 rotenone. Potassium nitrate medium was prepared from 135 mmol L–1 KNO3, 5 mmol L–1 HEPES, 0.1 mmol L–1 EGTA, 0.2 mmol L–1 EDTA, and 2 mol L–1 rotenone. The pH of buffers and medium was kept at 7.4.
Synthesis of TiO2 and Fe containing TiO2 nanomaterials
The TiO2 and Fe modified TiO2 powder samples with different concentrations of FeCl3 (0%, 0.1%, 0.5%, and 1%) were prepared through the conventional sol–gel method.35,36 In the synthesis process, 4 mL of TTIP was dissolved in 20 mL of ethanol and continuously stirred for 1 hour, and then to this 1 mL of HCl was added to get a clear transparent solution. Different FeCl3 solutions were added batchwise into the clear transparent solution and placed on the stirrer for 2 hours at room temperature and samples were named 0Fe/Ti, 0.1Fe/Ti, 0.5Fe/Ti, and 1Fe/Ti. The pH of about 2.0 was maintained during all the steps of the synthesis process. Finally, distilled water was slowly added to the solution by stirring for 1 hour. The solution was dried at 80 °C and calcined at 400 °C for 2 hours. The synthesized powder was finally ground and subjected to characterization.
Characterization of TiO2 and Fe containing TiO2 nanomaterials
The crystal structure of the prepared samples was studied by powder X-ray diffraction (XRD) using a PANalytical Model X'Pert PRO diffractometer. The morphology, shape, size, and surface characteristics of the nanoparticles were determined by Transmission Electron Microscopy (TEM).
Isolation of mitochondria
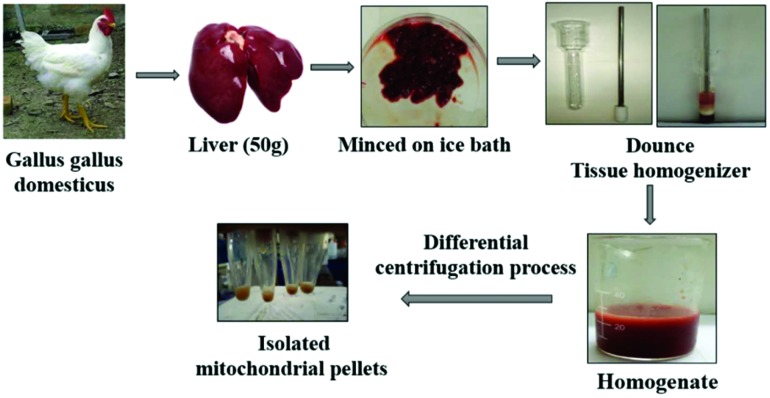
Fresh Gallus gallus domesticus (chicken) liver (about 50 g) was obtained from a slaughterhouse. Mitochondria were isolated by standard differential centrifugation according to conventional methods.37 The fresh liver tissue was minced on an ice bath and then homogenized using a Dounce tissue grinder in buffer A. The homogenate was centrifuged at 3000g for 2 minutes. The supernatant was centrifuged at 17 500g for 3 minutes. The resulting pellets were washed with buffer A and centrifuged at 17 500g for 4 minutes. Subsequently, the pellets were resuspended in buffer B and centrifuged at 17 500g for 4 minutes. The pellets were finally resuspended in buffer C and kept at 4 °C. The steps for isolating the mitochondria at the sub cellular level are depicted in Fig. 1. The mitochondrial protein concentration was determined by the Biuret method taking BSA as the standard.
Fig. 1. Protocol for isolation of mitochondria from chicken liver tissue using the standard differential centrifugation method at 4 °C.
ROS production
A mitochondria-rich pellet (1 mg mL–1) was stored in buffer C incubated with 50 and 100 μg mL–1 of 0Fe/Ti, 0.1Fe/Ti, 0.5Fe/Ti, and 1Fe/Ti nanoparticles at 37 °C for 30 minutes. Then the DCFH-DA probe was added to the mitochondrial suspension for 30 min at room temperature. The increasing rate of fluorescence of DCFH-DA (ex: 488 nm; em: 525 nm, 250 nM) indicated the ROS generation of mitochondria. The fluorescence intensities were measured using an FP-6500 Jasco Spectrofluorometer.19
Mitochondrial membrane fluidity measurement
Membrane fluidity was analyzed by fluorescence anisotropy changes of DPH labeled mitochondria. The mitochondrial suspension was incubated with 50 and 100 μg mL–1 of 0Fe/Ti, 0.1Fe/Ti, 0.5Fe/Ti, and 1Fe/Ti nanoparticles at 37 °C for 30 minutes under stirring conditions. The DPH was added to 2 mL of mitochondrial suspension under stirring conditions for 30 minutes at room temperature. Anisotropic changes in DPH were recorded using a spectrofluorometer with the excitation and emission wavelengths of 350 nm and 452 nm, respectively. An emission filter at a wavelength of 390 nm was used to minimize stray light. Since fluidity is inversely related to anisotropy and polarization of the probe, membrane fluidity was expressed as the reciprocal of anisotropy or polarization.37
Mitochondrial swelling measurement
Mitochondrial swelling was determined by alterations of UV absorbance at 540 nm over 600 s at room temperature. Isolated mitochondria (1 mg protein per mL) were suspended in 2 mL of buffer D. Different dosages (10, 50, and 100 μg mL–1) of the synthesized 0Fe/Ti, 0.1Fe/Ti, 0.5Fe/Ti, and 1Fe/Ti nanoparticles were added to the suspension. The absorbance at λ = 540 nm was immediately recorded using a Shimadzu UV-61 double beam spectrophotometer. The amino acid in the peptide bond of mitochondrial membrane protein absorbs visible radiation with absorption maxima at 540 nm.
Permeabilization of the mitochondrial inner membrane to H+ and K+
The permeabilization of the mitochondrial inner membrane to H+ and K+ was studied using the mitochondrial membrane swelling method by recording the absorbance of the suspension at 540 nm using a UV-Vis spectrophotometer. The permeabilization of the mitochondrial inner membrane to H+ was detected in potassium acetate medium. The permeabilization of the mitochondrial inner membrane to K+ was detected in potassium nitrate medium.37
Activity of mitochondrial complex II
The activity of mitochondrial complex II was assayed by measuring the reduction of MTT using a BioTek, Synergy H1 Hybrid multimode plate reader. Briefly, 100 μL of mitochondrial suspension (1 mg mL–1) was incubated with 20, 50, and 100 μg mL–1 of 0Fe/Ti, 0.1Fe/Ti, 0.5Fe/Ti, and 1Fe/Ti nanoparticles at 37 °C for 15 min. 0.4% of MTT was added to the mitochondrial suspension which was incubated at 37 °C for 30 min. The product of formazan crystals was completely dissolved in 200 μL of DMSO, and the absorbance at 570 nm was measured using a multimode plate reader.19 The formazan dye product in blue colour absorbs visible radiation with absorption maxima at 570 nm.
Results and discussion
Characterization analysis
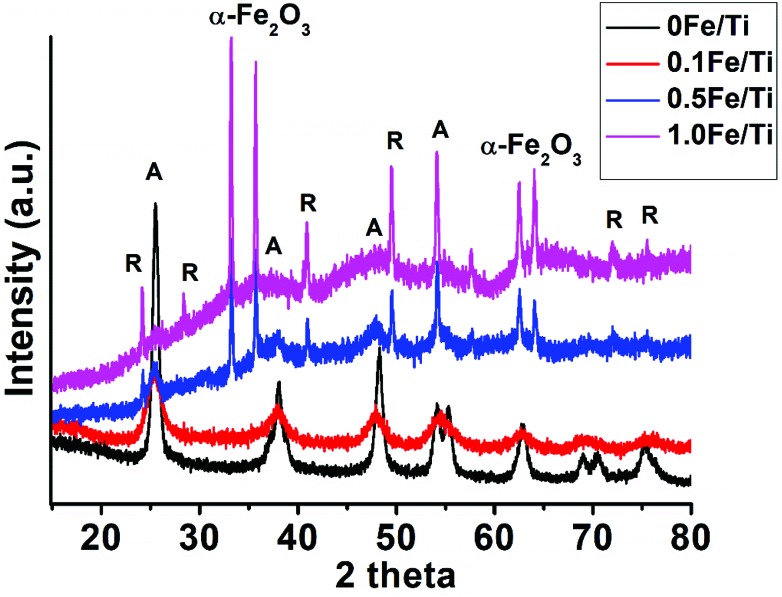
This paper analyzes subsequent incorporation of Fe and the change in the morphology brought in the parent TiO2 nanoparticles. The crystallographic change has been studied through XRD analysis and TEM has been used for morphological analysis. Fig. 2 shows the XRD spectra of the synthesized TiO2 and Fe containing TiO2 nanoparticles with different concentrations of iron and annealed at a temperature of 400 °C. TiO2 and Fe containing TiO2 nanoparticles showed the mixed phase of anatase and rutile with a dominance of the anatase phase. The 2θ peaks observed at 25.61°, 38.10°, 48.47°, 54.24°, 55.36°, 62.99°, 69.20°, 70.59°, and 75.47° in the XRD pattern of the 0Fe/Ti sample are consistent with anatase TiO2 (101), (004), (200), (105), (211), (204), (116), (220), and (215) lattice planes, respectively with reference to JCPDS no. 21-1272.38 The rutile phase of 0Fe/Ti starts originating through an increase of the Fe3+ concentration in the 0.1Fe/Ti sample, whereas 0.5Fe/Ti and 1Fe/Ti samples showed almost complete transformation of the anatase (A) to rutile (R) phase along with the formation of α-Fe2O3 as seen from the X-ray diffraction spectrum. The Fe incorporation is substitutional due to the similar ionic radius of Fe and Ti. The saturation limit of the substitutional Fe3+ is reached with the increase of the Fe concentration in 0.5Fe/Ti and 1Fe/Ti, with simultaneous formation of Fe2O3 in the TiO2 matrix.39 The 2θ diffraction peak corresponding to the rutile phase starts originating at 27.5° in 1Fe/Ti samples. The spectrum shows the presence of a shoulder peak corresponding to the (012) plane of α-Fe2O3 along with major peaks representing (104), (110), (113), (024), (116), (213), and (300) planes of the most stable hematite phase of α-Fe2O3 with reference to JCPDS card no. 24-0072.40
Fig. 2. XRD spectra of the synthesized TiO2 nanoparticles with different iron concentrations calcined at 400 °C.
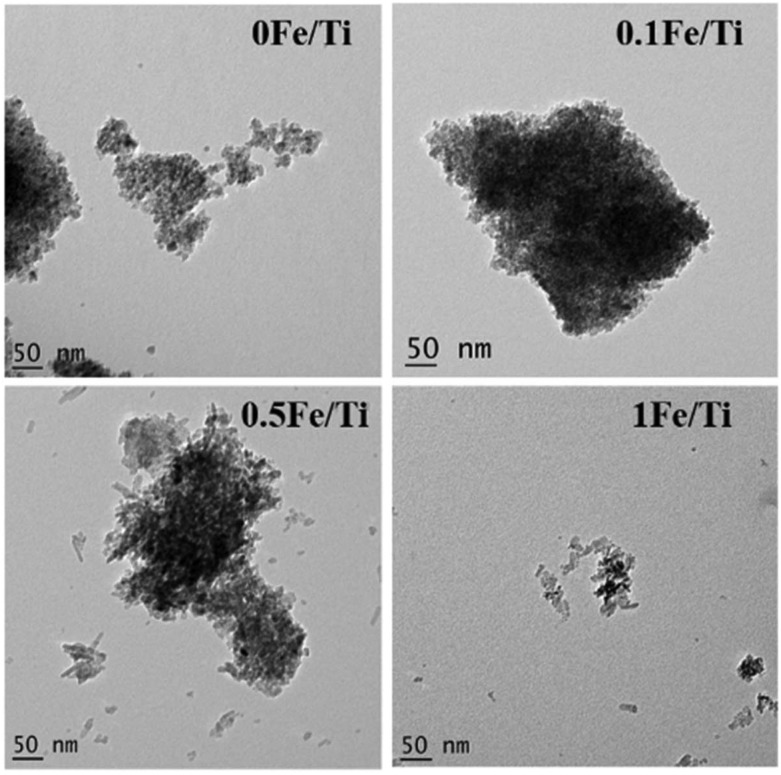
The A-R phase transition and the change in the structural morphology with an increase in the Fe concentration in TiO2 have been studied using high-resolution TEM as shown in Fig. 3. The 0Fe/Ti and 0.1Fe/Ti samples showed well-defined spherical particles of size 2.1 nm, whereas the TEM micrograph of 0.5Fe/Ti and 1Fe/Ti samples shows changes in the morphology from the uniform spherical shape to the elongated one-dimensional rod-like structure with pointed edges coexisting with the spherical nanoparticles. The average size of the synthesized nanoparticles through TEM micrographs was determined using standard Image J software.41 The average size (diameter) of particles is ∼2.1 nm for 0Fe/Ti, 0.1Fe/Ti, and 0.5Fe/Ti and for 1Fe/Ti it is ∼1.5 nm. The average lengths for nanorods were calculated to be 27.5 nm and 22.5 nm for 0.5Fe/Ti and 1Fe/Ti, respectively. The decrease in the diameter and the increase in the length of nanorods in the 1Fe/Ti sample were observed.
Fig. 3. TEM micrograph of the synthesized TiO2 nanoparticles with different iron concentrations.
Effect of TiO2 and Fe containing TiO2 samples on the mitochondrial system
The interaction of the synthesized nanoparticles in the mitochondrial system has been studied. The dose-dependent toxicological effect of TiO2 and Fe containing TiO2 nanoparticles on isolated mitochondria has been reported through the systematic study of ROS generation capacity, membrane fluidity alteration, mitochondrial swelling, permeabilization of the mitochondrial inner membrane to H+ and K+, and alteration in the activity of respiratory chain complex II.
ROS generation capacity of the synthesized nanoparticles
Fluorescence spectroscopy was used to study the ROS generating ability of the synthesized samples. A non-fluorescent dye, DCFH-DA, was used to detect the level of ROS generated by the samples at different dosage levels. ROS is easily hydrolyzed by esterase in the matrix to DCFH.42,43 Non-fluorescent DCFH is susceptible to the attacks by ROS and fluorescent DCF is produced. The intensity of fluorescent DCF quantifies the amount of ROS generated in the process.
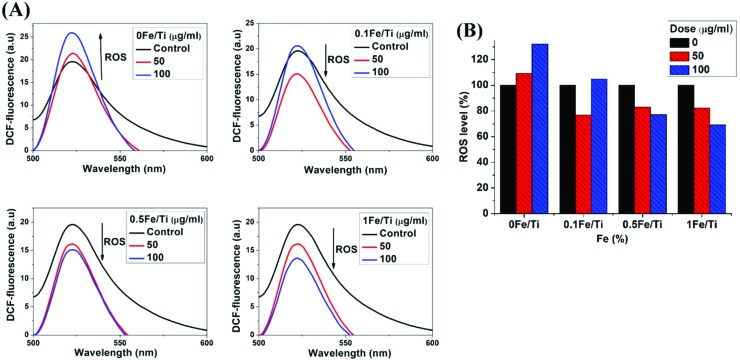
Fig. 4(A) shows that Fe3+ helps to slow down the rate of ROS generation, depending on the concentration and dosage. The ROS level gets enhanced as the dosage of TiO2 increases with the increase in the fluorescence intensity of DCF. The decrease in the fluorescence intensity of DCF indicates the reduction in the ROS level (%), which is clearly observed in Fe containing TiO2 nanoparticle treated mitochondrial suspension as shown in Fig. 4(B). The maximum intensity has been observed for 100 μg mL–1 of the 0Fe/Ti sample corresponding to the nano-TiO2 sample, indicating the highest ROS formation. For the pure TiO2 sample, the fluorescence intensity of DCF increases with increasing dosage, whereas other samples 0.1Fe/Ti, 0.5Fe/Ti and 1Fe/Ti show a reverse trend of decreasing intensity with the increase in dosage, which means that Fe helps to control the level of ROS generation.
Fig. 4. (A). Fluorescence spectra of isolated mitochondria treated with TiO2 and Fe containing TiO2 nanoparticles for ROS generation analysis using the DCFH-DA probe and (B) dose dependent ROS level (%) production in isolated mitochondria treated with TiO2 and Fe containing TiO2 nanoparticles.
The production of ROS is responsible for the oxidation of biomolecules taking place by electron and hole driven hydroxyl radical formation. The generated electrons react with dissolved oxygen molecules and produce the oxygen peroxide radical (˙O–2) by reacting with TiO2 as mentioned in eqn (1) and (2).25,44 In the case of pure TiO2 treated samples, the generation of ROS species is probably mediated by the electron transfer between the excited TiO2 and nearby molecular oxygen, which ultimately leads to oxidation. However, in the case of Fe containing TiO2 (0.1Fe/Ti, 0.5Fe/Ti, & 1Fe/Ti) nanoparticles, the electron excited to the conduction band is taken up by Fe3+. This reduces the superoxide and promotes recombination of the e–/h+ pair, which is shown by eqn (3).45 The reduction of superoxide (˙O–2) formation through e–/h+ pair recombination results in the reduction of cytotoxicity of the parent TiO2 material via Fe incorporation. The above observation in terms of ROS production declares that Fe3+ helps to reduce the chemically active oxygen species which are responsible for cytotoxicity caused by TiO2
| e– + O2 → ˙O–2, | 1 |
| TiO2 (e–) + O2 → TiO2 + ˙O–2, | 2 |
| Fe3+ + ˙O–2 → Fe2+ + O2. | 3 |
Membrane fluidity alteration in isolated mitochondria
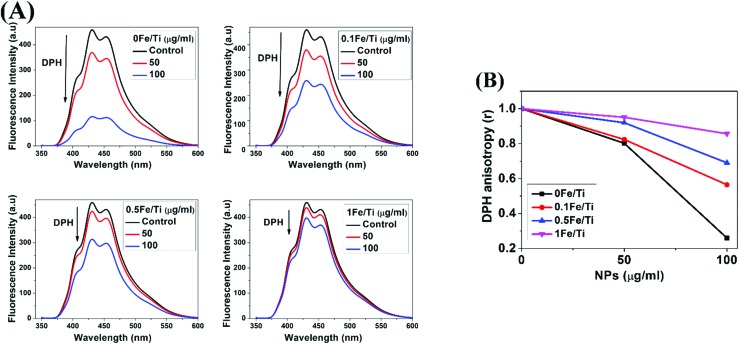
The membrane fluidity of DPH-labeled mitochondria was evaluated by changes in the fluorescence anisotropy (r). Current studies have revealed that changes in mitochondrial membrane fluidity might produce direct effects on membrane-based processes, such as mitochondrial permeability transition.46 In order to examine the mitochondrial membrane fluidity, the changes of fluorescence excitation anisotropy of mitochondria-bound dyes were detected by fluorescence polarization spectroscopy. Fluorescence anisotropy is inversely correlated with membrane fluidity. DPH is almost non-fluorescent in water, but it exhibits strong fluorescence when it is intercalated with lipid membranes. The lower the anisotropy, the more flexible the membrane.19
Fig. 5(A) presents the variation of DPH fluorescence intensity to demonstrate the alteration in the lipid bilayer of the mitochondrial membrane in all the samples. For all samples, anisotropy of DPH labelled mitochondria declines. But the highest decrease in the fluorescence intensity of DPH was observed for a dosage of 100 μg mL–1 of 0Fe/Ti (TiO2) and the fluidity of the membrane was found to get enriched with the increasing amount of 0Fe/Ti. This is possibly due to the loosening of the membrane structure and the increase in fluidity. However, there was not as much of change in fluorescence anisotropy of DPH for 0.5Fe/Ti and 1Fe/Ti nanoparticles to the mitochondrial suspension. DPH fluorescence units of the control sample were measured to be 458.99 which declined to 114.12, when mitochondria were treated with 100 μg mL–1 of TiO2 (0Fe/Ti) nanoparticles, whereas the high Fe containing TiO2 sample, i.e., 1Fe/Ti at a dosage of 100 μg mL–1, did not cause a major change in the membrane fluidity of mitochondria and fluorescence units 397.90 were recorded which are close to fluorescence units of the control sample. These data suggested that the fluidity of the membrane was possibly prevented via inclusion of Fe into TiO2. It was also suggested that pure TiO2 produced significant changes in membrane fluidity in the phopholipid bilayer region by decreasing the fluorescence anisotropy, while the increase in the Fe content in TiO2 nanoparticles showed less significant changes in membrane fluidity, which is shown in Fig. 5(B). Different concentrations of Fe in TiO2 and dosage of the synthesized Fe/Ti nanocomposite play a very important role in controlling the membrane fluidity. The 1Fe/Ti sample having a large amount of Fe in TiO2 and a dosage of 100 μg mL–1 has a lower effect on the fluidity of the membrane and slows the rate of parent TiO2 nanoparticle dissolution on the lipid bilayer of the mitochondrial membrane.
Fig. 5. (A). Fluorescence spectra of mitochondria treated with TiO2 and Fe containing TiO2 nanoparticles for measuring membrane fluidity by using the DPH probe and (B) variation of normalized anisotropy (r) of DPH due to interactions of isolated mitochondria with TiO2 and Fe containing TiO2 nanoparticles.
Effect of the synthesized nanoparticles on mitochondrial swelling
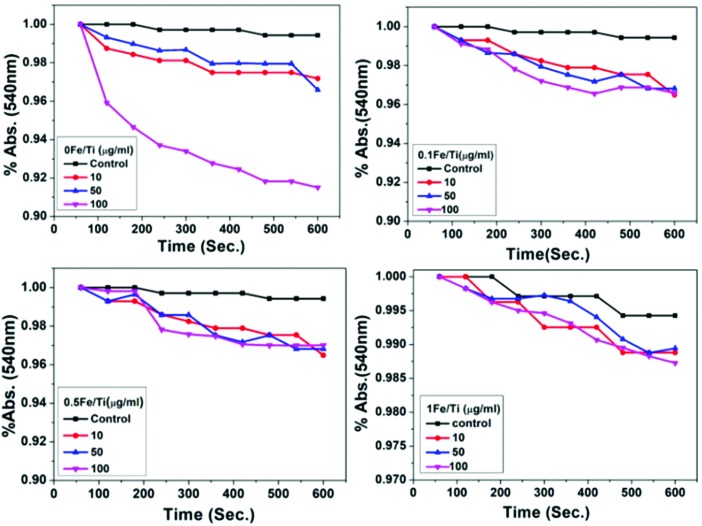
Disturbance in the homeostasis of mitochondrial membrane permeability results in mitochondrial matrix swelling. Mitochondrial inner membrane permeability to solutes and ions results in the collapse of the membrane potential and subsequent water accumulation, thus causing mitochondrial swelling.47 Under this condition, mitochondria become more transparent, and hence the absorbance signals collected by the instrument decreases.19,20 Fig. 6 depicts the absorbance at 540 nm for all the samples and at different dosages in mitochondrial suspension. Mitochondrial suspension treated with 100 μg mL–1 of pure TiO2 nanoparticles causes maximum swelling by reducing the absorbance at 540 nm markedly as compared to Fe containing TiO2 nanoparticles. Fe incorporation in TiO2 inhibits the water accumulation across the membrane. The recorded absorbance was normalized which articulates that the TiO2 (0Fe/Ti) sample at a dosage of 100 μg mL–1 showed a maximum 9.8% decline in absorbance, whereas the Fe containing TiO2, i.e., 0.1Fe/Ti, 0.5Fe/Ti, and 1Fe/Ti samples at a dosage of 100 μg mL–1, showed 4.1%, 3.1%, and 2% declines in absorbance, respectively, which ensured that swelling was prevented by Fe incorporation.
Fig. 6. The normalized absorbance spectra of isolated mitochondria treated with TiO2 and Fe containing TiO2 nanoparticles for mitochondrial swelling at 540 nm over 600 seconds at room temperature.
Permeabilization of the mitochondrial inner membrane to H+ and K+ induced by TiO2 and Fe containing TiO2
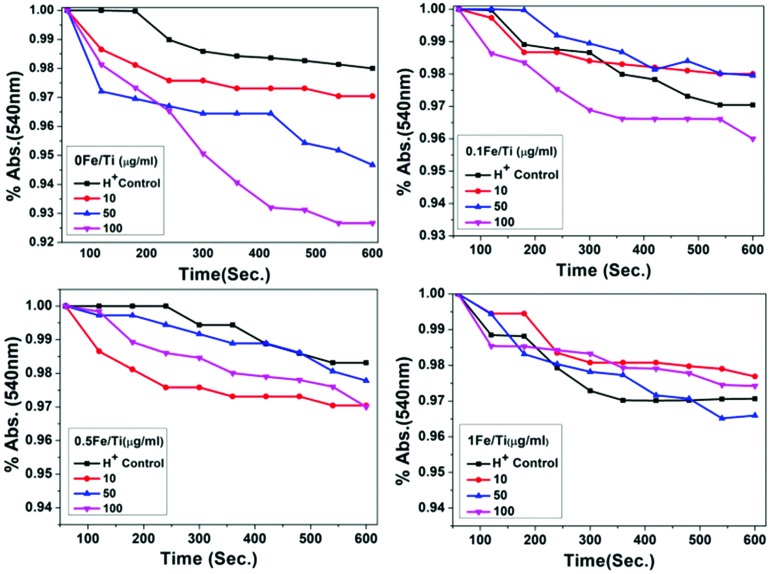
The effects of TiO2 and Fe containing TiO2 nanoparticles on permeabilization of the mitochondrial inner membrane to H+ and K+ were tested by valinomycin-dependent swelling of de-energized isolated mitochondria.37 Valinomycin is an antibiotic ionophore produced by Streptomycetes. It is a cyclic poly-peptide-like molecule whose folded conformation forms an inner cavity that can accommodate only K+.48 On collapsing the K+ gradient across the mitochondrial inner membrane, valinomycin decreases the membrane potential. When mitochondria are suspended in K-acetate medium, protonated acetate crosses the mitochondrial inner membrane and dissociates into the acetate anion and H+ ions in the mitochondrial matrix, producing the proton gradient which prevents swelling.49,50 In the presence of valinomycin, swelling takes place if the proton gradient is dissipated.51,52 Permeabilization of H+ ions across the mitochondrial inner membrane in K-acetate media is presented in Fig. 7. Valinomycin dependent mitochondrial swelling considerably gets increased in a concentration dependent way, indicating that the pure TiO2 sample induced a permeabilization of the mitochondrial inner membrane to H+, whereas the penetrability of the inner membrane to H+ in Fe containing TiO2 samples (0.1Fe/Ti, 0.5/Ti, and 1Fe/Ti) is not possible. Swelling of the mitochondrial membrane gets enhanced for these samples. Iron metabolism prevents cellular homeostasis and prohibits the passage of water and ions across the lipid bilayer of the membrane, which eventually controls the movement of substances across the membrane.53,54
Fig. 7. The normalized absorbance spectra of mitochondrial suspension in K-acetate media treated with different concentrations of TiO2 and Fe containing TiO2 nanoparticles showing permeabilization of the mitochondrial inner membrane to H+ induced at 540 nm over 600 seconds at room temperature.
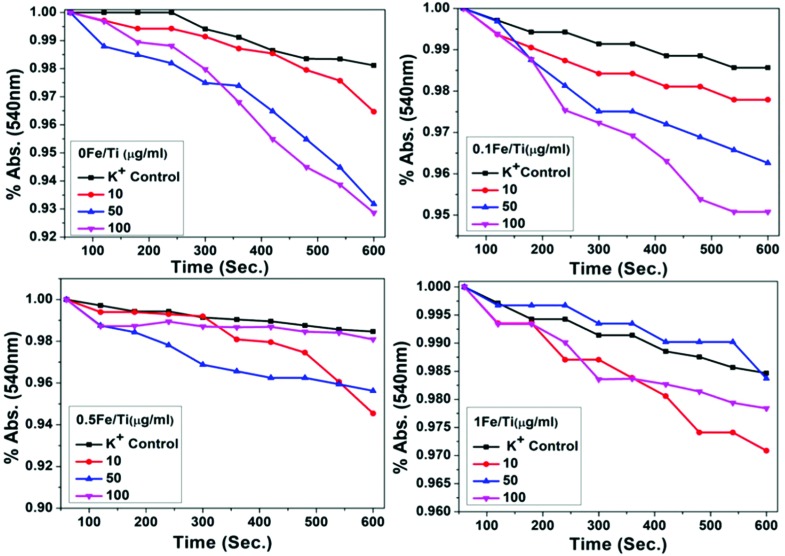
When mitochondria are suspended in KNO3 medium, the mitochondrial inner membrane is freely permeable to NO3–, i.e., NO3– is free from inner membrane selectivity. There is a K+ gradient between the two sides of the inner membrane, and thus swelling occurs under the condition of K+ permeabilization. It is the accumulation of K+ that determines the swelling of mitochondria.55,56 The absorbance for mitochondrial suspension in K-nitrate media treated with samples recorded to quantify the permeabilization of the mitochondrial inner membrane to K+ is shown in Fig. 8. Maximum permeabilization of K+ to the mitochondrial inner membrane was observed in 0Fe/Ti of the pure TiO2 sample.
Fig. 8. The normalized absorbance spectra of mitochondrial suspension in K-nitrate media treated with different concentrations of TiO2 and Fe containing TiO2 nanoparticles showing permeabilization of the mitochondrial inner membrane to K+ induced at 540 nm over 600 seconds at room temperature.
Activity of respiratory chain complex II
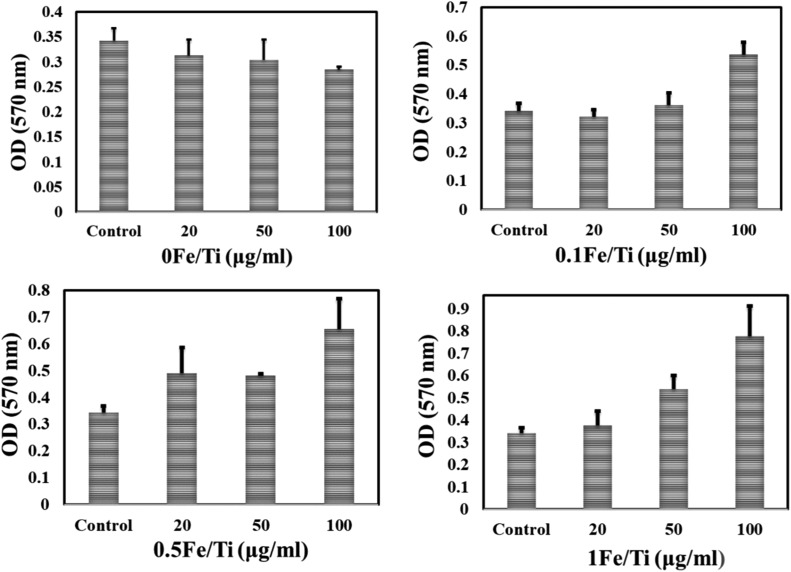
Succinate dehydrogenase or respiratory complex II is an enzyme complex and found in the inner mitochondrial membrane which is responsible for mitochondrial cellular respiration and plays a role in oxygen level sensing. It is the only enzyme that participates in both the citric acid cycle and the electron transport chain (ETC).57–60 Fig. 9 shows that after 15 minutes of incubation of mitochondrial suspension with 0Fe/Ti (TiO2), a concentration-dependent decrease of optical density (OD) at 570 nm appeared and the activity of succinate dehydrogenase (complex II) gets reduced. The results correspond to the inhibition of mitochondrial respiration by TiO2, whereas complex II was not affected by Fe containing TiO2 nanoparticle treated mitochondrial samples. Surprisingly, Fe incorporated TiO2 samples improve the enzymatic activity on the membrane with the increase in the dosage of Fe containing TiO2 as indicated by the increase in the absorbance value.
Fig. 9. Activity of respiratory chain complex II detected by the MTT assay using a multimode plate reader at 570 nm. Mitochondria were incubated with different dosages of synthesized nanoparticles for 15 min prior to the measurement. The value of OD reflected complex II activity. Error bars represent the mean ± SD.
Mechanism of shape dependent ROS generation
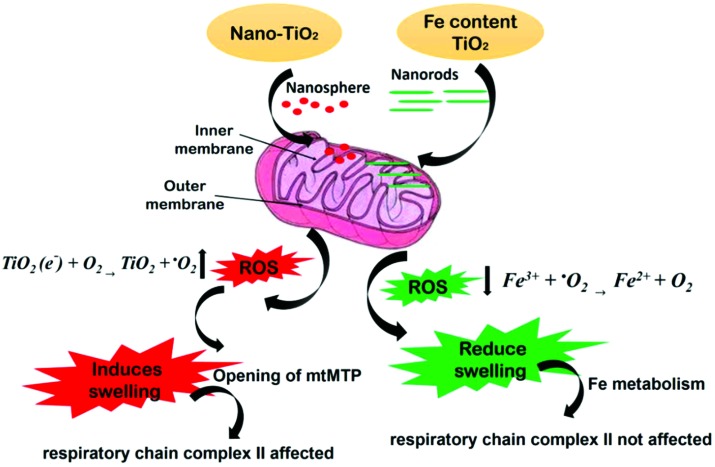
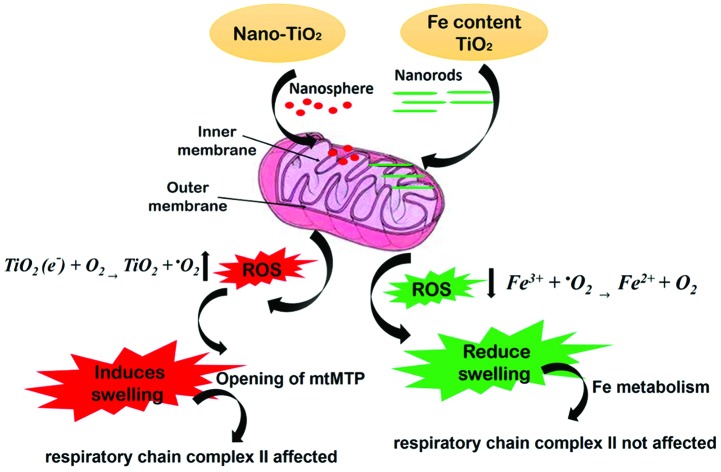
The present paper conducted a systematic study of the effect of the Fe content in the TiO2 matrix system in terms of mitochondrial membrane interactions. The Fe content causes changes in the shape and morphology of the spherical TiO2 nanoparticles to rod shaped anisotropic nanostructures. This morphological change has been presumed to influence the membrane collapsing process during endocytosis or phagocytosis. For example, it is suggested that endocytosis of spherical nanoparticles is easier and faster as compared to rod-shaped nanoparticles.61 Therefore, spherical nano-TiO2 (0Fe/Ti sample) could easily proceed at the sub-cellular level and increase the level of ROS production in the mitochondrial membrane, which is schematically illustrated in Fig. 10. However, 0.5Fe/Ti and 1Fe/Ti rod shaped nanoparticles have a larger contact area at the cell membrane. Hence, the ends with a high curvature at the half-cup stage of endocytosis possibly cause a higher membrane surface energy, producing enormous distorting force that goes above the maximum force provided by the actin polymerization. This effect indulges the growing ends of the phagocytic cup, resulting in impaired phagocytosis and macrophage spreading onto the material rather than internalization.62,63 Thus, Fe containing TiO2 nanorods reduce the production of superoxide ions without distorting the mitochondrial membrane, hence preventing fluidity, swelling of the mitochondrial membrane and complex II activity.
Fig. 10. Schematic diagram showing the effect of the morphology of TiO2 and Fe containing TiO2 nanoparticles on isolated mitochondria.
Conclusions
The in situ synthesis of 0Fe/Ti, 0.1Fe/Ti, 0.5Fe/Ti, and 1Fe/Ti nanoparticle samples with controlled size was successfully achieved by the sol–gel method. The XRD and TEM micrograph suggested the successful phase and structural transformation of the synthesized anatase TiO2 nanosphere into rutile nanorods. Our results collected from isolated mitochondria show that synthesized anatase TiO2 (0Fe/Ti) induces mitochondrial swelling, promotes membrane fluidity, affects the activity of complex II and increases the ROS generation via a non-specific approach instead of a definite one in a dose dependent manner. The exposure of TiO2 caused the enhancement of mitochondrial inner membrane permeability to H+ and K+ and mitochondrial swelling via the decline in absorbance at 540 nm, while 0.5Fe/Ti and 1Fe/Ti samples which contained the high concentration of Fe in the TiO2 matrix prevent the swelling of mitochondria by maintaining the homeostasis at the membrane, slows the rate of dissolution of the parent nanomaterial at the mitochondrial membrane, prevents the fluidity of the membrane & complex II activity and reduces the production of ROS generation.
Conflicts of interest
There are no conflicts of interest to declare.
Acknowledgments
The authors are thankful to the Central Instrument Facility (CIF) of the Central University of Gujarat and IR & D, Gujarat Forensic Science University, India, for providing the characterization facilities for the samples.
References
- Shi H., Magaye R., Castranova V., Zhao J. Part. Fibre Toxicol. 2013;10(1):15. doi: 10.1186/1743-8977-10-15. [DOI] [PMC free article] [PubMed] [Google Scholar]
- Jacobs J. F., Van de Poel I., Osseweijer P. Nanoethics. 2010;4(2):103–113. doi: 10.1007/s11569-010-0090-y. [DOI] [PMC free article] [PubMed] [Google Scholar]
- Weir A., Westerhoff P., Fabricius L., Hristovski K., Von Goetz N. Environ. Sci. Technol. 2012;46(4):2242–2250. doi: 10.1021/es204168d. [DOI] [PMC free article] [PubMed] [Google Scholar]
- Winkler H. C., Notter T., Meyer U., Naegeli H. J. Nanobiotechnol. 2018;16(1):51. doi: 10.1186/s12951-018-0376-8. [DOI] [PMC free article] [PubMed] [Google Scholar]
- Chang X., Zhang Y., Tang M., Wang B. Nanoscale Res. Lett. 2013;8(1):51. doi: 10.1186/1556-276X-8-51. [DOI] [PMC free article] [PubMed] [Google Scholar]
- Hougaard K. S., Jackson P., Jensen K. A., Sloth J. J., Löschner K., Larsen E. H., Birkedal R. K., Vibenholt A., Boisen A. M., Wallin H., Vogel U. Part. Fibre Toxicol. 2010;7(1):16. doi: 10.1186/1743-8977-7-16. [DOI] [PMC free article] [PubMed] [Google Scholar]
- Johnson A. C., Bowes M. J., Crossley A., Jarvie H. P., Jurkschat K., Jürgens M. D., Lawlor A. J., Park B., Rowland P., Spurgeon D., Svendsen C. Sci. Total Environ. 2011;409(13):2503–2510. doi: 10.1016/j.scitotenv.2011.03.040. [DOI] [PubMed] [Google Scholar]
- Özgür M. E., Balcıoğlu S., Ulu A., Özcan İ., Okumuş F., Köytepe S., Ateş B. Environ. Toxicol. Pharmacol. 2018;62:11–19. doi: 10.1016/j.etap.2018.06.002. [DOI] [PubMed] [Google Scholar]
- Hamzeh M., Sunahara G. I. Toxicol. in Vitro. 2013;27(2):864–873. doi: 10.1016/j.tiv.2012.12.018. [DOI] [PubMed] [Google Scholar]
- Vevers W. F., Jha A. N. Ecotoxicology. 2008;17(5):410–420. doi: 10.1007/s10646-008-0226-9. [DOI] [PubMed] [Google Scholar]
- Trouiller B., Reliene R., Westbrook A., Solaimani P., Schiestl R. H. Cancer Res. 2009;69(22):8784–8789. doi: 10.1158/0008-5472.CAN-09-2496. [DOI] [PMC free article] [PubMed] [Google Scholar]
- Chen J., Dong X., Zhao J., Tang G. J. Appl. Toxicol. 2009;29(4):330–337. doi: 10.1002/jat.1414. [DOI] [PubMed] [Google Scholar]
- Wu J., Liu W., Xue C., Zhou S., Lan F., Bi L., Xu H., Yang X., Zeng F. D. Toxicol. Lett. 2009;191(1):1–8. doi: 10.1016/j.toxlet.2009.05.020. [DOI] [PubMed] [Google Scholar]
- Xia Z., He J., Li B., He K., Yang W., Chen X., Zhang J., Xiang G. RSC Adv. 2018;8(55):31764–31776. doi: 10.1039/c8ra05132a. [DOI] [PMC free article] [PubMed] [Google Scholar] [Retracted]
- Chen Q., Wang N., Zhu M., Lu J., Zhong H., Xue X., Guo S., Li M., Wei X., Tao Y., Yin H. Redox Biol. 2018;15:266–276. doi: 10.1016/j.redox.2017.12.011. [DOI] [PMC free article] [PubMed] [Google Scholar]
- Freyre-Fonseca V., Delgado-Buenrostro N. L., Gutiérrez-Cirlos E. B., Calderón-Torres C. M., Cabellos-Avelar T., Sánchez-Pérez Y., Pinzón E., Torres I., Molina-Jijón E., Zazueta C., Pedraza-Chaverri J. Toxicol. Lett. 2011;202(2):111–119. doi: 10.1016/j.toxlet.2011.01.025. [DOI] [PubMed] [Google Scholar]
- Sokolove P. M. Int. J. Biochem. 1994;26(12):1341–1350. doi: 10.1016/0020-711x(94)90176-7. [DOI] [PubMed] [Google Scholar]
- Crompton M. Biochem. J. 1999;341(2):233–249. [PMC free article] [PubMed] [Google Scholar]
- Yuan L., Gao T., He H., Jiang F. L., Liu Y. Toxicol. Res. 2017;6(5):621–630. doi: 10.1039/c7tx00079k. [DOI] [PMC free article] [PubMed] [Google Scholar]
- Xia C. F., Lv L., Chen X. Y., Fu B. Q., Lei K. L., Qin C. Q., Liu Y. J. Membr. Biol. 2015;248(2):319–326. doi: 10.1007/s00232-015-9773-1. [DOI] [PMC free article] [PubMed] [Google Scholar]
- Li D. W., He H., Lin B. B., Xu Z. Q., Jiang F. L., Liu Y. RSC Adv. 2014;4(8):3913–3919. [Google Scholar]
- Fu P. P., Xia Q., Hwang H. M., Ray P. C., Yu H. J. Food Drug Anal. 2014;22(1):64–75. doi: 10.1016/j.jfda.2014.01.005. [DOI] [PMC free article] [PubMed] [Google Scholar]
- Lee H. C., Wei Y. H. Exp. Biol. Med. 2007;232(5):592–606. [PubMed] [Google Scholar]
- Liou G. Y., Storz P. Free Radical Res. 2010;44(5):479–496. doi: 10.3109/10715761003667554. [DOI] [PMC free article] [PubMed] [Google Scholar]
- Agarwal K., Chibber S. Glob. J. Med. Res. 2017;3(3):70–74. [Google Scholar]
- Abdal Dayem A., Hossain M., Lee S., Kim K., Saha S., Yang G. M., Choi H., Cho S. G. Int. J. Mol. Sci. 2017;18(1):120. doi: 10.3390/ijms18010120. [DOI] [PMC free article] [PubMed] [Google Scholar]
- Murphy M. P. Biochem. J. 2009;417(1):1–3. doi: 10.1042/BJ20081386. [DOI] [PMC free article] [PubMed] [Google Scholar]
- Nasralla N., Yeganeh M., Astuti Y., Piticharoenphun S., Shahtahmasebi N., Kompany A., Karimipour M., Mendis B. G., Poolton N. R., Šiller L. Sci. Iran. 2013;20(3):1018–1022. [Google Scholar]
- Caratto V., Locardi F., Alberti S., Villa S., Sanguineti E., Martinelli A., Balbi T., Canesi L., Ferretti M. J. Sol-Gel Sci. Technol. 2016;80(1):152–159. [Google Scholar]
- George S., Pokhrel S., Ji Z., Henderson B. L., Xia T., Li L., Zink J. I., Nel A. E., Mädler L. J. Am. Chem. Soc. 2011;133(29):11270–11278. doi: 10.1021/ja202836s. [DOI] [PMC free article] [PubMed] [Google Scholar]
- Zhang Y., Shen Y., Gu F., Wu M., Xie Y., Zhang J. Appl. Surf. Sci. 2009;256(1):85–89. [Google Scholar]
- Xia T., Zhao Y., Sager T., George S., Pokhrel S., Li N., Schoenfeld D., Meng H., Lin S., Wang X., Wang M. ACS Nano. 2011;5(2):1223–1235. doi: 10.1021/nn1028482. [DOI] [PMC free article] [PubMed] [Google Scholar]
- George S., Pokhrel S., Xia T., Gilbert B., Ji Z., Schowalter M., Rosenauer A., Damoiseaux R., Bradley K. A., Mädler L., Nel A. E. ACS Nano. 2009;4(1):15–29. doi: 10.1021/nn901503q. [DOI] [PMC free article] [PubMed] [Google Scholar]
- Flak D., Coy E., Nowaczyk G., Yate L., Jurga S. RSC Adv. 2015;5(103):85139–85152. [Google Scholar]
- Barkhade T., Phatangare A., Dahiwale S., Mahapatra S. K., Banerjee I. Surf. Interface Anal. 2019:1–12. [Google Scholar]
- Barkhade T. and Banerjee I., Photocatalytic degradation of Rhodamine B dye using Fe doped TiO2 nanocomposites, in AIP Conference Proceedings 2018 May 11, AIP Publishing, Vol. 1961, No. 1, p. 030016. [Google Scholar]
- Yang L. Y., Gao J. L., Gao T., Dong P., Ma L., Jiang F. L., Liu Y. J. Hazard. Mater. 2016;301:119–126. doi: 10.1016/j.jhazmat.2015.08.046. [DOI] [PubMed] [Google Scholar]
- Li W., Liang R., Hu A., Huang Z., Zhou Y. N. RSC Adv. 2014;4(70):36959–36966. [Google Scholar]
- Yang Y., Yu Y., Wang J., Zheng W., Cao Y. CrystEngComm. 2017;19(7):1100–1105. [Google Scholar]
- Huang Y., Ding D., Zhu M., Meng W., Huang Y., Geng F., Li J., Lin J., Tang C., Lei Z., Zhang Z. Sci. Technol. Adv. Mater. 2015;16(1):014801. doi: 10.1088/1468-6996/16/1/014801. [DOI] [PMC free article] [PubMed] [Google Scholar]
- Vippola M., Valkonen M., Sarlin E., Honkanen M., Huttunen H. Nanoscale Res. Lett. 2016;11(1):169. doi: 10.1186/s11671-016-1391-z. [DOI] [PMC free article] [PubMed] [Google Scholar]
- Mookerjee S. A., Divakaruni A. S., Jastroch M., Brand M. D. Mech. Ageing Dev. 2010;131(7–8):463–472. doi: 10.1016/j.mad.2010.03.010. [DOI] [PMC free article] [PubMed] [Google Scholar]
- Dikalov S. I., Harrison D. G. Antioxid. Redox Signaling. 2014;20(2):372–382. doi: 10.1089/ars.2012.4886. [DOI] [PMC free article] [PubMed] [Google Scholar]
- Zhu L., Ali A., Shu Y., Ullah K., Cho K. Y., Oh W. C. Sep. Purif. Technol. 2015;151:184–192. [Google Scholar]
- Kalinowski D. S., Richardson D. R. Pharmacol. Rev. 2005;57(4):547–583. doi: 10.1124/pr.57.4.2. [DOI] [PubMed] [Google Scholar]
- Simon N., Morin C., Urien S., Tillement J. P., Bruguerolle B. Br. J. Pharmacol. 2003;138(2):369–376. doi: 10.1038/sj.bjp.0705038. [DOI] [PMC free article] [PubMed] [Google Scholar]
- Li D. W., He H., Lin B. B., Xu Z. Q., Jiang F. L., Liu Y. RSC Adv. 2014;4(8):3913–3919. [Google Scholar]
- Duax W. L., Griffin J. F., Langs D. A., Smith G. D., Grochulski P., Pletnev V., Ivanov V. Pept. Sci. 1996;40(1):141–155. doi: 10.1002/(SICI)1097-0282(1996)40:1%3C141::AID-BIP6%3E3.0.CO;2-W. [DOI] [PubMed] [Google Scholar]
- Vicente J. A., Santos M. S., Vercesi A. E., Madeira V. M. Pestic. Sci. 1998;54(1):43–51. [Google Scholar]
- Fernandes M. A., Jurado A. S., Videira R. A., Santos M. S., Moreno A. J., Velena A., Duburs G., Oliveira C. R., Vicente J. A. Mitochondrion. 2005;5(5):341–351. doi: 10.1016/j.mito.2005.06.004. [DOI] [PubMed] [Google Scholar]
- Zhang Y., Tian F., Xiao Q., Hu Y., Li J., Jiang F., Liu Y. J. Membr. Biol. 2013;246(5):365–373. doi: 10.1007/s00232-013-9540-0. [DOI] [PubMed] [Google Scholar]
- Fernandes M. A., Custodio J. B., Santos M. S., Moreno A. J., Vicente J. A. Mitochondrion. 2006;6(4):176–185. doi: 10.1016/j.mito.2006.06.002. [DOI] [PubMed] [Google Scholar]
- Richardson D. R., Lane D. J., Becker E. M., Huang M. L., Whitnall M., Rahmanto Y. S., Sheftel A. D., Ponka P. Proc. Natl. Acad. Sci. U. S. A. 2010;107(24):10775–10782. doi: 10.1073/pnas.0912925107. [DOI] [PMC free article] [PubMed] [Google Scholar]
- Sheftel A. D., Lill R. Ann. Med. 2009;41(2):82–99. doi: 10.1080/07853890802322229. [DOI] [PubMed] [Google Scholar]
- Vicente J. A., Santos M. S., Vercesi A. E., Madeira V. M. Pestic. Sci. 1998;54(1):43–51. [Google Scholar]
- Fernandes M. A., Jurado A. S., Videira R. A., Santos M. S., Moreno A. J., Velena A., Duburs G., Oliveira C. R., Vicente J. A. Mitochondrion. 2005;5(5):341–351. doi: 10.1016/j.mito.2005.06.004. [DOI] [PubMed] [Google Scholar]
- Berg J. M., Tymoczko J. L., Stryer L. Biochemistry. 2002;5:320–323. [Google Scholar]
- Horn D., Barrientos A. IUBMB Life. 2008;60(7):421–429. doi: 10.1002/iub.50. [DOI] [PMC free article] [PubMed] [Google Scholar]
- Xue C., Li X., Liu G., Liu W. Int. J. Toxicol. 2016;35(6):644–653. doi: 10.1177/1091581816661853. [DOI] [PubMed] [Google Scholar]
- Costa C. S., Ronconi J. V., Daufenbach J. F., Gonçalves C. L., Rezin G. T., Streck E. L., da Silva Paula M. M. Mol. Cell. Biochem. 2010;342(1–2):51–56. doi: 10.1007/s11010-010-0467-9. [DOI] [PubMed] [Google Scholar]
- Champion J. A., Mitragotri S. Proc. Natl. Acad. Sci. U. S. A. 2006;103(13):4930–4934. doi: 10.1073/pnas.0600997103. [DOI] [PMC free article] [PubMed] [Google Scholar]
- Tingá Zheng X., MingáLi C. MedChemComm. 2010;1(1):84–86. [Google Scholar]
- Doshi N., Mitragotri S. J. R. Soc., Interface. 2010;7:S403–S410. doi: 10.1098/rsif.2010.0134.focus. [DOI] [PMC free article] [PubMed] [Google Scholar]


