

Abstract
Leigh syndrome and MELAS (mitochondrial encephalomyopathy, lactic acidosis, and stroke‐like episodes) are two of the most frequent pediatric mitochondrial diseases. Both cause severe morbidity and neither have effective treatment. Inhibiting the mammalian target of rapamycin (mTOR) pathway has been shown in model mice of Leigh syndrome to extend lifespan and attenuate both the clinical and pathological progression of disease. Based on this observation, we treated two children with everolimus, a rapamycin analogue. The child with Leigh syndrome showed sustained benefit, while the child with MELAS failed to respond and died of progressive disease. We discuss possible mechanisms underlying these disparate responses to mTOR inhibition.
Introduction
Mitochondrial encephalomyopathies cause significant disability and early death.1 A Ndufs4‐knockout mouse model simulates Leigh syndrome with biochemical defects affecting assembly of complex I in the respiratory chain and clinical findings of neurodegeneration, impaired motor skills, growth retardation and weight loss.2 Treating the Ndufs4 (KO) mice with rapamycin, an mTOR‐inhibitor, extended lifespan by 50–114 days. In addition, treated mice showed improved performance on several outcome measures and did not develop astrocyte activation or glial marker reactivity, present in untreated knockout mice.2 The authors of this study tried to identify downstream mechanisms associated with attenuation of mitochondrial disease. They found that treatment with rapamycin increased macroautophagy, decreased glycolytic intermediates, and rescued many of the metabolomics defects seen in untreated knockout mice. They found no evidence of reduced neuroinflammation, no decrease in oxidative stress markers, and no rescue of mitochondrial respiratory chain function. Complex I assembly and stability were unaltered by treatment with rapamycin.
Similarly, treatment of kidney transplant recipients suffering from MELAS was associated with clinical improvement following the introduction of mTOR inhibitors.3 Four adult patients with MELAS/MIDD syndrome were switched from calcineurin inhibitors to mTOR inhibitors for post‐transplant immunosuppression. Cultured skin fibroblasts derived from these patients demonstrated hyperactive mTOR activity that attenuated with treatment. Rapamycin rescued mitochondrial morphology, membrane potential, and replicative capacity. The patients’ serum studies after switching to mTOR inhibitors suggested decreased muscle protein breakdown as well as a decrease in oxidative stress markers. Of note, despite clinical improvement, the leukocyte heteroplasmy levels in these patients remained unaltered after treatment with mTOR inhibitors.
Side effects of rapamycin include impaired wound healing, immunosuppression, and hyperlipidemia. Everolimus, approved by the FDA in 2010 for the treatment of subependymal giant cell astrocytomas (SEGAs) associated with tuberous sclerosis, is better tolerated than rapamycin.4 The encouraging results of the Ndufs4 (KO) study prompted us to explore everolimus as a possible treatment for children with Leigh syndrome and with MELAS.
Methods
After obtaining Institutional Review Board approval and parental consent, the patients were started on everolimus 4.5 mg/m2/day, given by mouth or gastrostomy tube. Serum everolimus levels were measured by gas phase liquid chromatography/mass spectrometry, targeting a trough level of 5–10 ng/mL. The drug was withheld for grade 3–4 toxicities, and then resumed at a lower dose.
The patients were assessed using the Gross Motor Function Measure‐88 (GMFM‐88), a standardized outcome measure designed to assess change in gross motor function over time in children. The GMFM‐88 assesses a spectrum of gross motor activities including the following five dimensions: (1) Lying and rolling (17 items), (2) Sitting (20‐items), (3) Crawling and kneeling (14‐items), (4) Standing (13‐items), and (5) Walking, running, and jumping (24‐items). Each item is scored on a 4‐point scale with a maximum total raw score of 256 points. The test measures motor skills of an individual at or below the level of a typically developing 5‐year‐old child.5 Brain MRI imaging was repeated to monitor disease status.
Case Reports
Patient A, a girl with Leigh syndrome, was born at term, sat at 6 months, crawled at 9 months and stood and cruised by 10 months. At 11 months, she was hypotonic and tired rapidly while crawling. Shortly thereafter, she had a seizure, required intensive care unit (ICU) admission, mechanical ventilation, and tracheostomy for respiratory failure. Initial serum lactate was 2.7 mmol/L and CSF lactate was 1.8 mmol/L. An MRI at age 1 year showed hyperintense T2‐signal foci bilaterally in the thalami, cerebral peduncles, pons, and medulla. There was a large lactate peak on MR‐spectroscopy (Fig. 1). Skeletal muscle biopsy showed mild nonspecific myofiber atrophy, more prominent in a subset of type 2 fibers, and variably increased sarcolemmal accumulations of material consistent with glycogen. There were no classic ragged‐red or ragged‐blue fibers, although, this is not surprising as young children with mitochondrial disease often have normal muscle biopsy results at diagnosis. As a general rule, nuclear gene mutations and mitochondrial coding gene mutations lack ragged‐red fibers on muscle biopsy. Ragged‐red fibers classically and typically result from mitochondrial DNA synthetic gene mutations. There were no strongly succinate dehydrogenase‐reactive blood vessels (SSVs) or alterations in cytochrome c oxidase (COX) staining.6
Figure 1.
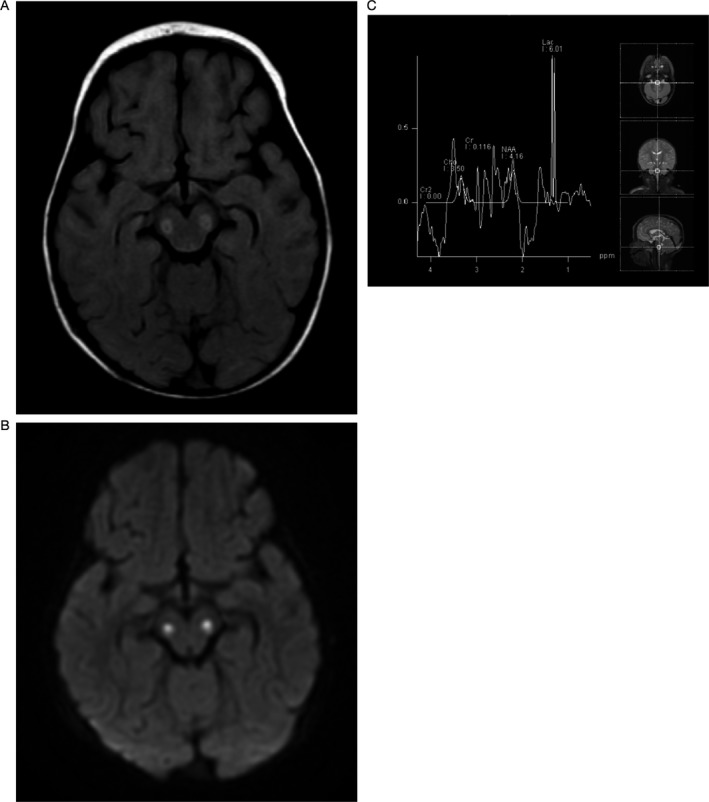
Patient A, MRI and MRS at diagnosis: (A) FLAIR axial image confirm the abnormality in the midbrain at the level of the cerebral peduncles. (B) Axial diffusion image show abnormal bilateral symmetric signal in the cerebral peduncles. (C) Single voxel spectroscopy at the level of the lower pons demonstrates a dominant lactate peak at 1.3 ppm and significantly diminished N‐ acetyl aspartate peak (NAA).
Molecular genetic testing revealed a homozygous missense pathogenic variant in NDUFS4 (c.355G>C, pAsp119His), shown previously to cause Leigh Syndrome. The parents were heterozygous for this mutation. Imaging 4 months later revealed an increase in the brainstem signal abnormality, concordant with her clinical deterioration and the natural history of Leigh syndrome.7 By age 2 years, she was no longer able to stand, crawl or cruise and required a tracheostomy and gastrostomy. Her GMFM‐88 total score was 48.8%.
Patient B, a boy with severe, early‐onset MELAS, was born at 31 weeks gestation. His mother had diabetes mellitus and carried the mtDNA mutation, m.3243A>G, associated with MELAS. He initially had some difficulty with feeding but was discharged at 11 days now able to eat by mouth. Although he had poor head control that later improved, he met gross motor milestones on time for rolling over, sitting, pulling to stand, and walking. He again had feeding difficulty at age 18 months associated with gastroesophageal reflux. Words emerged during the second year of life and he was talking in full sentences by age 3 years. In nursery school he had difficulties with coordination and socializing with peers.
At age 4 years, he suffered a seizure and a brain MRI showed a stroke‐like lesion in the right temporal lobe. Serum studies revealed lactic acidosis and a lactate/pyruvate ratio of 40.4, suggesting a defect in oxidative phosphorylation. He did not have CSF studies. Mitochondrial genome analysis of leukocytes showed a pathogenic variant in MT‐TL1, m.3243A>G, with heteroplasmy of 78%, consistent with early onset MELAS. At age 66 months, he was hypotonic, lethargic, epileptic, and gastrostomy‐dependent. He sat with poor balance but was unable to stand or walk. The GMFM‐88 score was 11.8%.
Results
Patient A began everolimus by gastrostomy at age 23 months. The 2 mg daily dose was gradually increased to 4 mg. The dose was decreased because of hypertriglyceridemia that resolved with fenofibrate. Her trough levels during treatment ranged from 2.3 ng/mL to 34.8 ng/mL, with periodic adjustments to maintain a trough level goal of 5–10 ng/mL. Six months after initiating treatment, brain MRI showed improvement with reduction of the signal hyperintensity in the bilateral thalami and brainstem (Fig. 2). After 19 months of treatment, she was walking independently with a slightly ataxic gait, speaking in sentences, and no longer requiring tracheostomy or gastrostomy. The GMFM‐88 score improved to 83.8% at age 44 months. Twenty‐two months after starting treatment, MRI remained improved except for a new abnormal signal focus in the medulla. However, clinically she had continued to improve and, by age 47 months, the GMFM‐88 score had increased to 84.5%.
Figure 2.
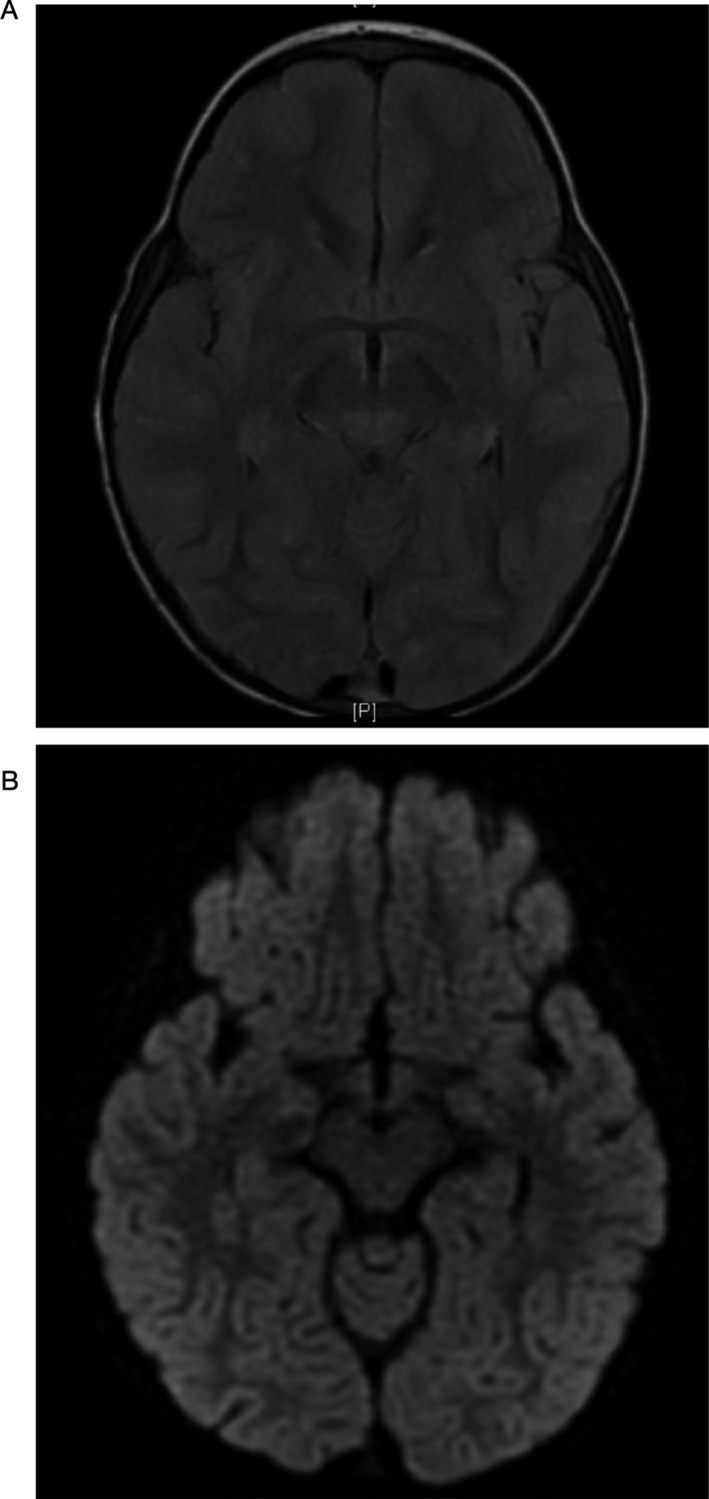
(A) FLAIR and (B) DWI imaging of Patient A post‐treatment shows resolution of lesions seen on previous studies.
Patient B began everolimus at age 69 months. The daily dose of 2.5 mg was gradually increased to a maximum dose of 4 mg. Periodic dose adjustments were necessary because of elevated serum trough levels, with levels ranging from 0.7 ng/mL to 39.7 ng/mL. One episode of stomatitis resolved after interrupting treatment for 5 days. He did not have hypertriglyceridemia. The MRI at diagnosis showed mild volume loss and ventricular dilatation as well as diffuse abnormalities of cortex, thalami, and putamen consistent with early‐onset MELAS.1 His condition continued to deteriorate and an MRI, prior to his death at age 79 months, demonstrated progression of disease (Fig. 3).
Figure 3.
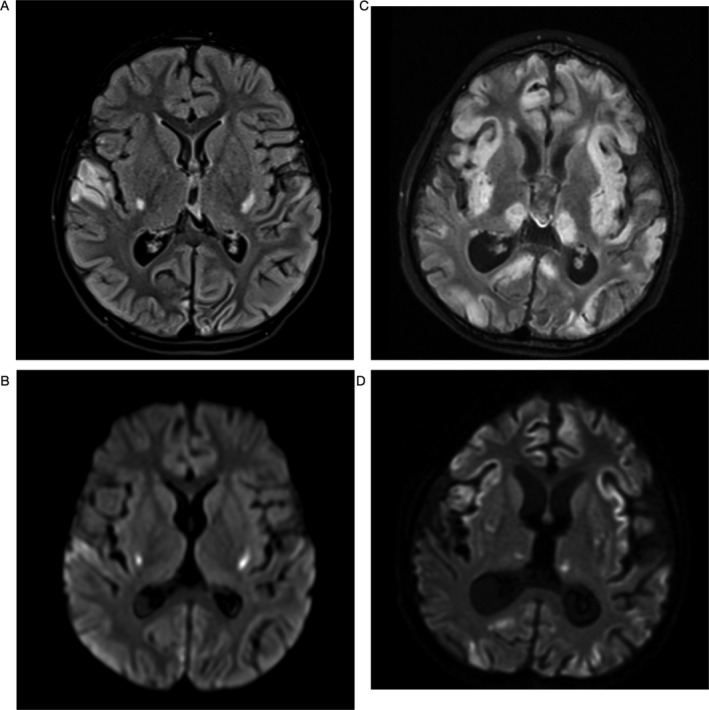
Patient B initial MRI: (A) FLAIR axial image confirm the abnormal signal in the putamen and the right superior lateral temporal lobe. (B) Diffusion weighted axial image shows abnormal diffusion signal in the inferior putaminal region, abnormal signal is also noted in the right lateral superior temporal lobe. Patient B MRI just prior to his death: (C) FLAIR axial image shows interval progression of diffuse volume loss and development of extensive abnormal signal in swollen cortex in multiple vascular distribution as well as in the bilateral thalamic nuclei. (D) Diffusion image show patchy scattered abnormal diffusion signal in the cortex and putamen.
Discussion
There are several proposed theories based on Drosophila,8 yeast,9 and mammalian models2 to explain the mechanism of action of mTOR inhibition as a potentially effective treatment for mitochondrial disease. These findings build on previous studies showing that caloric restriction extended life span by partially inhibiting the protein complex mTORC1.10 There are several proposed theories regarding why mTOR inhibition may be beneficial in mitochondrial disease. These theories include improved clearance of defective mitochondria through mitophagy and increasing lysosomal biogenesis,11, 12 and improvement in respiratory chain function. Other possible mechanisms are changes in metabolism via utilization of alternative energy reserves, such as amino acids and lipids, or enhanced glycolysis2 thus circumventing the defect in oxidative phosphorylation.13 A study of rapamycin therapy in an induced pluripotent stem cell‐based disease model of m.8993T>G maternally inherited Leigh syndrome (MILS) showed that reduction in mTOR activity results in a rise of ATP levels from a presumed decrease in the energy‐consuming process of protein production.14
Our experience with these two children suggests that some, but not all, patients with mitochondrial disease will respond to treatment with mTOR inhibitors. Identifying factors that distinguish responders from nonresponders should allow us to maximize the therapeutic benefits by targeting the responder subgroup while minimizing the potential risks by sparing the nonresponder subgroup. The response may not be disease‐specific since Patient A, with an autosomal recessive form of Leigh syndrome, and the four reported kidney transplant patients, with a maternally inherited form of mitochondrial disease, MELAS, improved while Patient B, also with MELAS, continued to deteriorate. Therefore, the stage, progression and severity of disease may be responsible for some of the variability in response.
Despite having the same MELAS mutation as patient B (m.3243 A>G), the four kidney transplant recipients were adults with a less severe phenotype at treatment initiation. Leukocytes from the kidney transplant patients showed low leukocyte heteroplasmy (10–15%, 10–15%, 15–20%, and <5%), compared to our Patient B with 78% heteroplasmy in leukocytes.15 Nevertheless, it is known that leukocyte heteroplasmy does not correlate with neurological severity, and the percentage of mutant mtDNA in blood declines with age despite progression of disease. At this time, there is no reliable biomarker of mitochondrial disease severity. The kidney transplant patients with MELAS showed hyperactive fibroblast mTOR activity that was attenuated with mTOR inhibitors, correlating with clinical improvement3 raising the possibilities that fibroblast mTOR activity may be informative as a disease biomarker or predictor of response to mTOR inhibition. In contrast, heteroplasmy levels remained unchanged, indicating that these percentages cannot be used as a reliable biomarker of disease progression.
The type of gene mutation, nuclear‐encoded versus mitochondrial‐encoded, also may influence the response. Patient A, with a nuclear‐encoded mutation, responded well despite being severely affected at treatment initiation while Patient B, with a mitochondrial‐encoded mutation, responded poorly. Patient B also presented much earlier than most MELAS patients consistent with a severe phenotype. Gender also may be a possible reason for the different responses of our two patients because it has been shown that females respond more robustly to caloric restriction and inhibition of mTOR.10
Further studies are required to assess which children with diverse mitochondrial disorders will respond to mTOR inhibitors, and what factors will predict clinical outcome. Measuring mTOR activity in cultured fibroblasts might help differentiate between responders and nonresponders. Everolimus and rapamycin both appear to be effective, and everolimus has a superior safety profile; but rapamycin should be considered as an alternative therapeutic agent in patients who fail to respond to everolimus. Notable limitations of this study include the small sample size, lack of fibroblast analysis and limited follow‐up of lactate levels in blood, CSF, or brain.
Conclusion
Treatment with mTOR inhibitors may be effective in some mitochondrial disorders, but the factors that predict a good outcome remain unclear. In our limited experience with two children, treatment was generally well tolerated over an extended interval. Patient A improved clinically and radiographically concordant with improvement seen in model mice with Leigh syndrome. The clinical course of Patient B, in contrast, followed the known natural history of severe, early‐onset MELAS culminating in neurological worsening and early death. Further research is needed to determine the mechanism(s) of action underlying the therapeutic effects of mTOR inhibition. These studies hopefully will lead to critically important guidelines governing the use of these promising therapeutic agents for currently untreatable childhood mitochondrial diseases while mitigating any possible toxic consequences.
Author Contributions
AS is the first author, wrote the initial draft of the manuscript and did a literature review on the topic. RS is a physical therapist that assessed Patient A, helped with the interpretation and analysis of the GMFM‐88 score. KE is a geneticist who helped with the initial work‐up of the patients and analysis of genetic results. AC helped to edit the final draft of the paper and also worked on editing the figures. AK is a neuro‐radiologist who helped to draft, edit, and interpret the imaging. JG is a neuro‐oncologist and administered the treatment to both patients and analysis of treatment results. DCD is an expert in mitochondrial disease and is the primary physician who took care of both patients, designed the study, supervised this project, and decided to treat both patients with everolimus.
Conflicts of Interest
Dr. C. Darryl De Vivo is an advisor/consultant for AveXis, Biogen, Cytokinetics, Ionis Pharmaceuticals, Inc., Metafora, Roche, Sanofi, Sarepta, and the SMA Foundation. He has grants from the Department of Defense, Hope for Children Research Foundation, the National Institutes of Health, and the SMA Foundation. He has clinical trial funding from Biogen, Mallinckrodt, PTC, Sarepta, and Ultragenyx. None of these companies/foundations were involved in the treatment of these patients.
Funding Information
No funding information provided.
References
- 1. Kaufmann P, Engelstad K, De Vivo DC, et al. Natural history of MELAS associated with mitochondrial DNA m.3243A>G genotype. Neurology 2011;77:1965–1971. [DOI] [PMC free article] [PubMed] [Google Scholar]
- 2. Johnson SC, Yanos ME, Kayser EB, et al. mTOR inhibition alleviates mitochondrial disease in a mouse model of Leigh syndrome. Science 2013;342:524–528. [DOI] [PMC free article] [PubMed] [Google Scholar]
- 3. Johnson SC, Martinez F, Canuad G, et al. MTOR inhibitors may benefit kidney transplant recipients with mitochondrial disease. Kidney Int. 2019;95:455–466. [DOI] [PMC free article] [PubMed] [Google Scholar]
- 4. Jeong A, Wong M. mTOR Inhibitors in Children: Current Indications and Future Directions in Neurology. Curr. Neurol. Neurosci. Rep. 2016;16:102. [DOI] [PubMed] [Google Scholar]
- 5. Russell DJ, Rosenbaum PL, Jarvis S, et al. The Gross Motor Function Measure: a mean to evaluate the effects of physical therapy. Dev. Med. Child Neurol. 1989;31:341–352. [DOI] [PubMed] [Google Scholar]
- 6. Koenig MK. Presentation and diagnosis of mitochondrial disorders in children. Pediatr Neurol. 2008;38:305–313. [DOI] [PMC free article] [PubMed] [Google Scholar]
- 7. Ortigoza‐Escobar JD, Oyarzabal A, Perez‐Duenas B, et al. Ndufs4 related Leigh syndrome: a case report and review of literature. Mitochondrion 2016;28:73–78. [DOI] [PubMed] [Google Scholar]
- 8. Wang A, Mouser J, Pitt J, et al. Rapamycin enhances survival in a Drosophila model of mitochondrial disease. Oncotarget. 2016;7:80131–80139. [DOI] [PMC free article] [PubMed] [Google Scholar]
- 9. Schleit J, Johnson SC, Kaeberlein M, et al. Molecular mechanisms underlying genotype‐dependent responses to dietary restriction. Aging Cell 2013;12:1050–1061. [DOI] [PMC free article] [PubMed] [Google Scholar]
- 10. Lamming Dudley W. Inhibition of the mechanistic target of rapamycin (mTOR) – rapamycin and beyond. Cold Spring Harb. Perspect. Med. 2016;6:a025924. [DOI] [PMC free article] [PubMed] [Google Scholar]
- 11. Civiletto G, Dogan SA, Cerutti R, et al. Rapamycin rescues mitochondrial myopathy via coordinated activation of autophagy and lysosomal biogenesis. EMBO Mol. Med. 2018;10:e8799. [DOI] [PMC free article] [PubMed] [Google Scholar]
- 12. Gilkerson RW, De Vries RL, Lebot P, et al. Mitochondrial autophagy in cells with mtDNA mutations results from synergistic loss of transmembrane potential and mTORC1 inhibition. Hum. Mol. Genet. 2012;21:978–990. [DOI] [PMC free article] [PubMed] [Google Scholar]
- 13. Siegmund SE, Hirano M, Schon EA, et al. Low‐dose rapamycin extends lifespan in a mouse model of mtDNA depletion syndrome. Hum. Mol. Genet. 2017;26:4588–4605. [DOI] [PMC free article] [PubMed] [Google Scholar]
- 14. Zheng X, Boyer L, Hunter T, et al. Alleviation of neuronal energy deficiency by mTOR inhibition as a treatment for mitochondria‐related neurodegeneration. ELife. 2016;5:e13378. [DOI] [PMC free article] [PubMed] [Google Scholar]
- 15. Kaufmann P, Engelstad K, De Vivo DC, et al. Protean phenotypic features of the A3243G mitochondrial DNA mutation. Arch. Neurol. 2009;66:85–91. [DOI] [PMC free article] [PubMed] [Google Scholar]