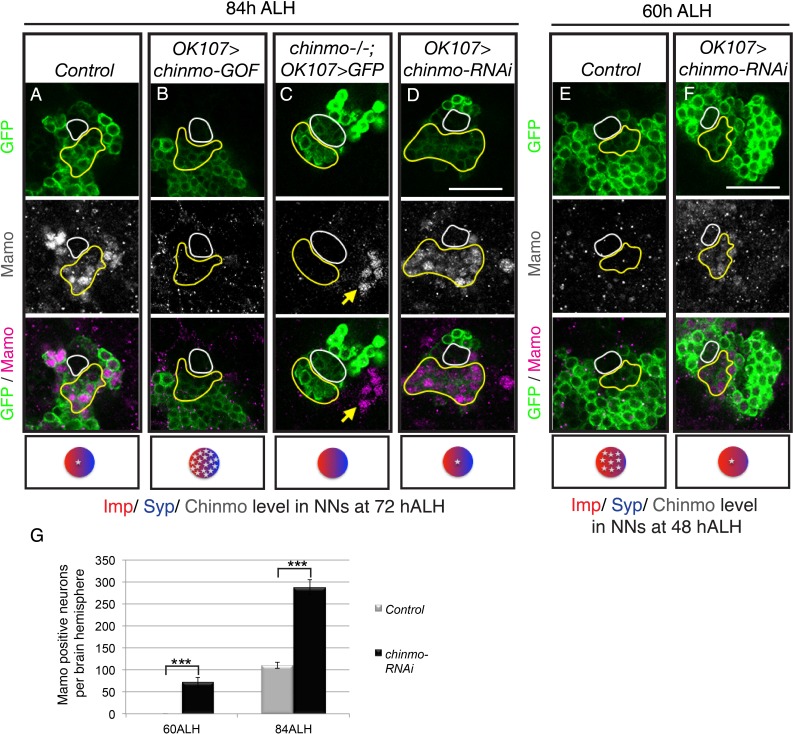
Figure 2. Weak Chinmo initiates Mamo protein expression.
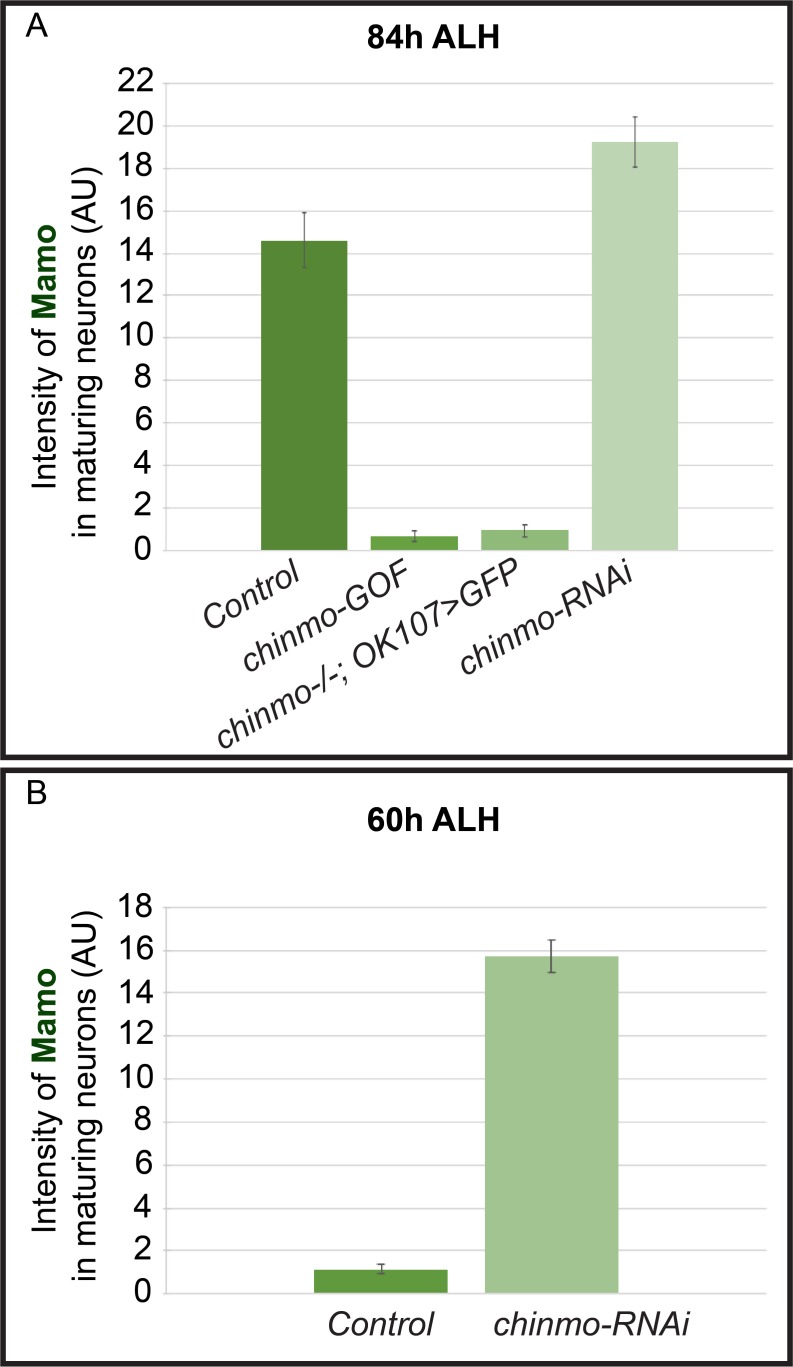
MB lineages (OK107 > GFP) with different genetic manipulations immunostained for GFP and Mamo. A single focal plane near the MB NB is shown. Newborn neurons (NN) are outlined in white. Young/maturing neurons are outlined in yellow. Images are representative of n > 18. Scale bar = 20 μm. The diagram below shows approximate levels of Imp (red), Syp (blue), and Chinmo (stars) expressed in the young/maturing neurons when they were NNs ~ 12 hr prior (as reported by Liu et al., 2015), or Figure 3—figure supplement 1). (A-F) At 84 hr ALH, Mamo staining is visible only in the young/maturing neurons in control brains (A) and brains expressing chinmo-RNAi (D). (C) chinmo-/-; OK107 > GFP is a chinmo null MARCM clone induced at newly hatched larvae (NHL). Note that OK107 drives GFP only within the clone. MB neurons outside of the chinmo-/- clone (eyeless+, data not shown) express Mamo (yellow arrow). (F) At 60 hr ALH, Mamo staining is only visible after OK107 > chinmo RNAi. (G) Mean number (± SEM) of Mamo positive neurons per brain hemisphere in control (gray) and chinmo-RNAi (black) expressing MBs (***p<0.005, n = 4–5). The quantification of Mamo staining is in Figure 2—figure supplement 1.


