. 2019 Sep 23;8:e48056. doi: 10.7554/eLife.48056

Figure 5. Mamo is necessary and sufficient for the α’/β’ fate.

(A) Schematic of MB lobe morphology and table of corresponding marker expression. (B–H) Adult MB lobes (OK107 > GFP) immunostained for GFP, Fas-II and Trio. Images are Z-stack projections of the axon region and are representative of n > 18. Lobes are identified based on both 3D structure and marker expression. α’/β’ lobes are outlined with orange dashed lines. Scale bar = 50 μm. Insert shows Trio staining alone. (A’) MB cell body markers that distinguish three MB neuron types. (B’–H’) Adult MB cell bodies (OK107 > GFP) immunostained for Abrupt, Trio and GFP. GFP channel is not shown, but is represented by a green outline. Colored arrows highlight MB neuron types red=γ ( TrioPM/Abrupt+ ), orange=α’/β’ (TrioPM,Cyto/Abrupt-), blue=α/β (Trio-/Abrupt-). Images are representative of n > 6. A single focal plane is shown. Scale bar = 20 μm. Note wide Fas-II++ α/β lobes and a morphologically indistinct FasII weak/negative lobe (magenta arrows) with mamo-RNAi (C). mamo-RNAi and chinmo-RNAi + mamo-RNAi both lack most cell body marker staining (C’ and E’). γ lobes and cell body markers are reduced in chinmo-RNAi alone (D and D’). Mamo overexpression (mamo-GOF) results in an expanded α’/β’ lobe (F) and increased numbers of TrioPM,Cyto/Abrupt- cell bodies (F’’). Note the Fas-II++, Trio- axons in the A/P (α), but not medial/lateral (β) portion of the axon lobe (blue arrow) which is surrounded by FasII-/weak, Trio+, morphologically indistinct axons (magenta arrow) in mamo-GOF (F). The cell body region is overwhelmingly Trio+ (F’). Syp-RNAi MB (G and G’) shows only γ neurons (note the A/P axon bundle characteristic of un-remodeled γ neurons). Syp-RNAi plus mamo-GOF produced expanded α’/β’ lobes (H) and mostly TrioPM,Cyto/Abrupt- cell bodies, with some TrioPM/Abrupt+ cells (H’). Note proliferating NBs (*) and adjoining unspecified young/maturing neurons produced with mamo-GOF (G’ and H’). The analysis of Mamo variants is in Figure 5—figure supplement 1. The analysis of hierarchical model is in Figure 5—figure supplement 2. The quantification of neuron populations is in Figure 5—figure supplement 3.

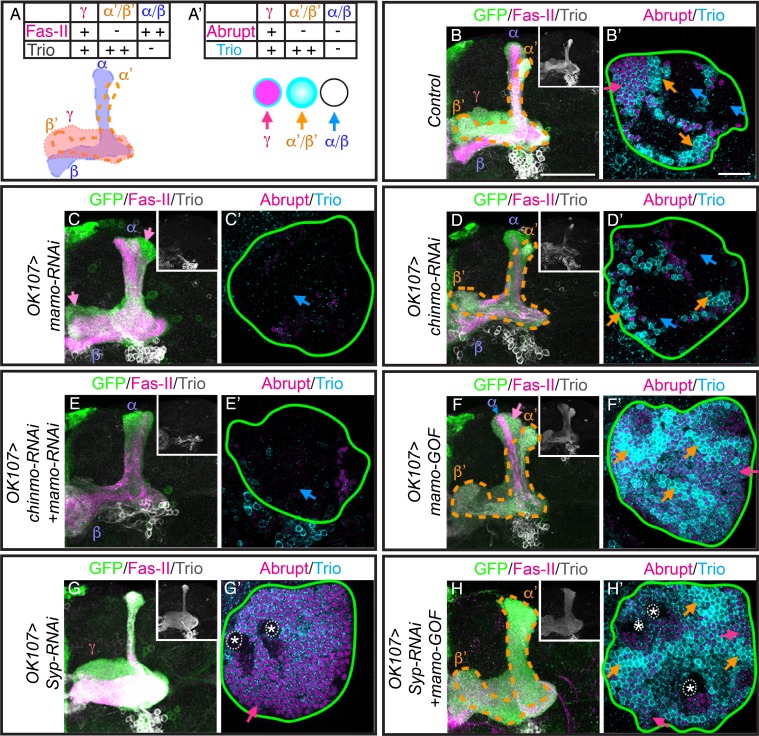
Figure 5—source data 1. Quantification of adult MB neuron types.
DOI: 10.7554/eLife.48056.022
Figure 5—source data 2. Intensity of Imp/Syp/Chinmo staining.
DOI: 10.7554/eLife.48056.023

Figure 5.

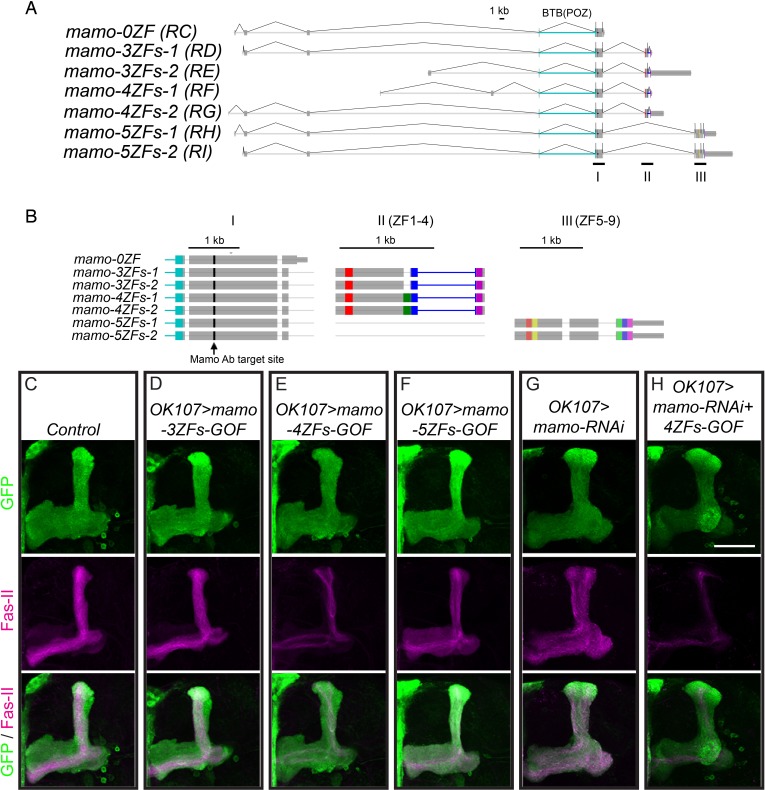
Figure 5—figure supplement 1. The Mamo variant containing 4ZFs is the prospective isoform acting in α’/β’ temporal fate determination.

Figure 5—figure supplement 1.

(A) mamo mRNA isoforms. Gray boxes show UTRs. Cyan labels BTB (POZ) domain at N-terminus, Different colors at C-terminus label zinc finger motifs. (B) Detailed motif descriptions of I, II, and III in (A). The Mamo antibody (Ab) target site (black arrow) is in N-terminus of the common region. There are nine ZF motifs labeled with different colors. (C–H) Adult MBs were immunostained for GFP (green) and Fas-II (magenta). Images are Z-stack projections (standard deviation) of the axon region and are representative of n > 6. Lobes are identified based on both 3D structure as well as marker expression. Scale bar = 50 μm. (D–F) Overexpression of different mamo variants with OK107. mamo-4ZFs-GOF results in altered MB lobe morphology with reduced Fas-II staining (E) compared to control (C). mamo-5ZFs-GOF expands Fas-II staining to a majority of axons. (G–H) mamo variant with 4ZFs rescues mamo-RNAi. Expression of mamo-RNAi induces expanded Fas-II staining (G). mamo-RNAi together with mamo-4ZFs-GOF results in a reduced Fas-II positive lobe, similar to mamo-4ZFs-GOF alone (E).
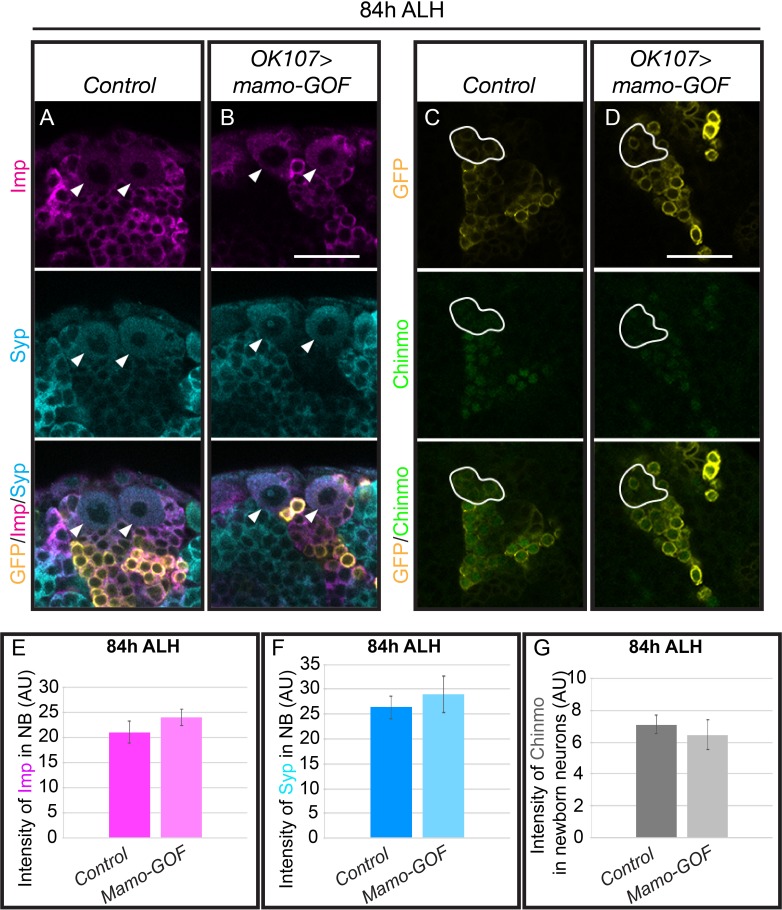
Figure 5—figure supplement 2. Mamo acts as a downstream factor of Imp/Syp/Chinmo gradients.

Figure 5—figure supplement 2.

(A–B) Larval MBs (OK107 > GFP) immunostained for Imp (magenta), Syp (Cyan) and GFP (yellow). NB are indicated with arrows. (C–D) Larval MBs (OK107 > GFP) immunostained for Chinmo (green, Rat-anti-Chinmo) and GFP (yellow). Newborn neurons are outlined in white. A single focal plane near the MB NB is shown. Images are representative of n > 6 Scale bar = 20 μm. (E–G) The intensity of Imp, Syp and Chinmo immunostaining in different genetic manipulations of MB neurons at 84 hr ALH. The Imp and Syp levels were measured in the NB and the Chinmo levels were measured in the newborn (mean ± SEM, n = 5–7 brains). AU, arbitrary fluorescent intensity units.
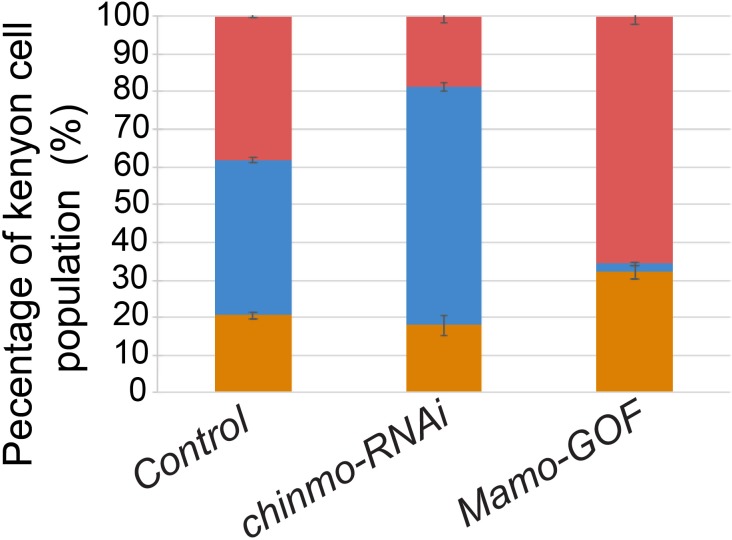
Figure 5—figure supplement 3. The quantification of MB neuron types.

Figure 5—figure supplement 3.

Different populations of MB neurons were counted and showed in percentage based on marker expression (Trio/Abrupt) in control, chinmo-RNAi and Mamo-GOF. Colored lines highlight MB neuron types, red=γ, orange=α’/β’ and blue=α/β neurons (mean ± SEM, n = 3 brains).