

Abstract
The role of ribavirin (RBV) in the era of direct-acting antivirals (DAA) is not clear, and DAA studies have been largely genotype- and regimen-specific. Using data from the Chronic Hepatitis Cohort Study, we evaluated the role of RBV and increased DAA treatment duration among patients with chronic hepatitis C (HCV) in routine clinical care. We performed multivariable analysis of data from 4133 patients receiving any of the following: sofosbuvir (SOF); daclatasvir + SOF; grazoprevir + elbasvir; paritaprevir/ritonavir + ombitasvir; simeprevir + SOF; and SOF + ledipasvir; SOF + velpatasvir ± voxilaprevir; and glecaprevir + pibrentasvir—all with/ without RBV. Inverse probability treatment weighting was used to adjust for treatment selection bias. Sustained virological response (SVR) was defined by undetectable HCV RNA 12 weeks after end of therapy. The overall SVR rate was 95%. Mean treatment duration was 12 ± 4.5 weeks. The final model included treatment duration and diabetes, as well as the interaction of RBV with previous treatment status (treatment naïve, interferon treatment failure [TF] or previous DAA TF), cirrhosis status, and HCV genotype (GT). Each one-month increment of treatment duration increased odds of SVR by 99% (aOR = 1.99). Diabetes, previous DAA TF, and decompensated cirrhosis significantly reduced odds of SVR. RBV significantly increased the likelihood of SVR among patients with decompensated cirrhosis (aOR = 5.05), previous DAA treatment failure (aOR = 5.43), and GT3 (aOR = 13.28). Among RBV-free regimens, patients with GT3 were less likely to achieve SVR than those with GT1 or 2 (aOR 0.07). Diabetes, decompensated cirrhosis, and prior DAA TF independently reduced the likelihood of SVR. Longer treatment duration increased likelihood of SVR. Conclusion: RBV increased likelihood of SVR among patients with GT3, previous DAA TF, or decompensated cirrhosis.
Keywords: Chronic Hepatitis Cohort Study, decompensated cirrhosis, direct-acting antivirals, ribavirin
1 |. INTRODUCTION
Direct-acting antivirals (DAA) have transformed the landscape of treatment for chronic hepatitis C virus (HCV) infections, with reports of nearly universal efficacy from clinical trials. 1,2 Recent studies suggest that cirrhotic status, patient race, and concomitant use of proton-pump inhibitors (PPI) may diminish response rates, but these cohorts have been limited by their focus on a single regimen (frequently sofosbuvir/ledipasvir) or HCV genotype (GT; often GT1), male patients, or cohorts drawn from academic or hepatology-focused medical centres. 2,3
Questions also remain regarding the impact of cirrhosis on rates of sustained virological response (SVR). Although DAA therapies are generally well tolerated in patients with compensated cirrhosis, a recent cohort study suggested that rates of SVR and adverse events were less favourable among patients with decompensated cirrhosis.4 Such findings have generated uncertainty regarding whether and how to treat these patients, particularly when they may soon be candidates for liver transplant. Likewise, the benefits and risks of adding ribavirin (RBV) to these regimens—often in the context of treatment challenges such as cirrhosis, decompensation, or drug-resistance—have not yet been adequately explored in patients under routine clinical care.5
More evidence is needed to inform hepatitis C treatment decisions across viral genotypes and among patients with ‘real-world’ clinical characteristics, including failure of prior antiviral treatment, compensated or decompensated cirrhosis, and multiple comorbidities. We used data from the racially and geographically diverse Chronic Hepatitis Cohort Study (CHeCS) to study treatment out-come among more than 4000 patients receiving interferon-DAA therapy (with and without ribavirin [RBV]) under routine clinical care at one of four large US health systems.
2 |. METHODS
CHeCS includes patients ≥18 years old who received health services on or after 1 January 2006 at one of four healthcare systems—Henry Ford Health System (Detroit MI); Geisinger Health System (Danville PA); Kaiser Permanente Northwest (Portland OR); and Kaiser Permanente Hawai’I (Honolulu HI). The study protocol was approved annually by the institutional review board at each site.
The current analysis included chronic HCV patients with at least 12 weeks of follow-up after receiving at least one course of one of ten types of interferon-free DAA regimens (Table S1), which were classified into three generations (Gen1, Gen2 and Gen3 [pangenotypic]).6 DAA treatment duration was also collected.
‘Index date’ was defined as the date of last DAA course initiation. Patients’ prior HCV treatment experience was categorized as follows: treatment naïve, prior interferon treatment failure (IFN TF), or prior DAA treatment failure (DAA TF). In addition, given that physicians may recommend discontinuation of proton-pump inhibitors (PPIs) during DAA treatment, we defined the use of PPI as any out-patient prescription or pharmacy fill for a PPI medication during DAA therapy for up to 3 days prior to start of therapy. Other index covariates included demographic characteristics (age; race; sex; insurance status) and clinical characteristics (HIV or HBV co-infection; BMI; viral genotype (GT); and compensated and decompensated cirrhosis status).7
2.1 |. Outcomes of interest
Sustained virological response (SVR) was determined if an undetectable HCV RNA viral load was observed ≥12 weeks after the end of treatment. Safety/toxicity was assessed using data collected through medical chart abstraction. These included reports of common adverse events (AEs; such as anaemia, fatigue, nausea/diarrhoea and skin rash) resulting in medical treatment or DAA dose change, as well as serious adverse events (SAEs; those requiring hospitalization, emergency department visits, or death).
2.2 |. Data analysis
To control for RBV treatment selection bias, we used all index date covariates to impute an inverse probability of treatment weighting (IPTW) score—a weighted propensity score (PS) approach.8 Potential treatment selection bias was considered to be controlled if there were no significant differences between patients who did and did not receive RBV after IPTW. The Charlson-Deyo comorbidity score 9 was included for IPTW score imputation, but was excluded from the final multivariable analysis due to confounding with the presence of diabetes and cirrhosis status.
Multivariable logistic regression was performed to study the impact of RBV and DAA treatment duration on SVR, as well as the influence of other index covariates, after adjusting for DAA generation and IPTW. Given the expected low rate of non-SVR events, we included covariates in the initial multivariable model only if they had either a significant individual effect or variable-by-RBV interaction (P < 0.05). In variable-by-RBV interaction comparisons, variable sub-categories that had no significant interaction effect with RBV were combined in order to avoid model overfitting. For example, there was a significant interaction between HCV genotype and RBV; however, RBV had no significant effect on SVR in patients with GT1 or 2, whereas RBV did have a significant effect in patients with GT3; therefore, the GT1 and 2 categories were combined for the GT-by-RBV comparison. Likewise, ‘no cirrhosis’ and ‘compensated cirrhosis’ were also combined for the cirrhosis-by-RBV comparison. Any variable-by-RBV interactions were further evaluated to determine whether they were qualitative (direction of effect) or quantitative (magnitude of effect) interactions. Pairwise comparisons estimated adjusted odds ratios [aOR] and 95% confidence intervals [95%CI]) for covariates and interactions retained in the final model. Given the low overall rate of non-SVR (~5%), the aOR can be interpreted as relative risk (RR).10
To specifically assess the combination effect of DAA treatment generation ±RBV on SVR, a sensitivity analysis was conducted by replacing the separate variables of RBV and DAA generation with a single combined variable of DAA generation ± RBV, which had five categories (ie Gen1 + RBV; Gen2 + RBV; Gen2 without RBV; Pangenotypic + RBV; and Pangenotypic without RBV), along with index covariates that were identified in the ‘main’ analysis. Because DAC + SOF regimen could arguably be classified as either Gen2 or Pangenotypic, we also performed a second sensitivity analysis that reclassified DAC + SOF as Pangenotypic. Finally, we performed a sensitivity analysis showing the effects of adjuvant RBV by cirrhosis status (no cirrhosis, compensated cirrhosis, and decompensated cirrhosis; as well as no cirrhosis vs any cirrhosis).
A descriptive analysis was conducted to study the effect of RBV on treatment-related toxicity, adjusting for IPTW.
3 |. RESULTS
Our sample included 4133 DAA-treated patients, 3923 of whom (95%) achieved SVR. Average DAA treatment duration was 12 (±4.5) weeks. RBV treatment selection bias was controlled after IPTW (Table S2). Table 1 displays univariate analysis of the effect of index demographic and clinical covariates, as well as treatment duration on SVR.
TABLE 1.
Unadjusted analysis of rates of sustained virological response (SVR) at 12 wk after the end of treatment with direct‐acting antivirals (DAA) by patient, viral, and treatment characteristics at ‘index date’ (date of last DAA regimen initiation)
| Variable | Response | Non-SVR (N = 210) | SVR (N = 3923) | P-value |
|---|---|---|---|---|
| Treatment duration | Months | 2.8 ± 1.4 | 3.1 ± 1.1 | 0.012 |
| Age group in | <40 | 7 (3%) | 245 (97%) | 0.249 |
| years | 40 < 50 | 13 (4%) | 300 (96%) | |
| 50 < 60 | 78 (6%) | 1316 (94%) | ||
| ≥60 | 112 (5%) | 2062 (95%) | ||
| Sex | Female | 64 (4%) | 1514 (96%) | 0.018 |
| Male | 146 (6%) | 2409 (94%) | ||
| Race category | Asian American/Pacific Islander | 8 (3%) | 227 (97%) | 0.364 |
| Black/ African American | 62 (6%) | 1003 (94%) | ||
| White | 129 (5%) | 2522 (95%) | ||
| Unknown/other | 11 (6%) | 171 (94%) | ||
| Insurance type | Medicaid | 36 (5%) | 683 (95%) | 0.369 |
| Medicare | 84 (6%) | 1348 (94%) | ||
| Private | 88 (5%) | 1824 (95%) | ||
| None | 2 (3%) | 59 (97%) | ||
| Previous antiviral treatment status | Treatment Naïve/IFN-based TF | 196 (5%) | 3807 (95%) | 0.003 |
| DAA TF | 14 (11%) | 116 (89%) | ||
| HCV Genotype | 1 or 2 | 154 (4%) | 3344 (96%) | <0.001 |
| 3 | 4 (6%) | 60 (94%) | ||
| Other | 52 (9%) | 519 (91%) | ||
| HIV at index date | 5 (5%) | 102 (95%) | 0.846 | |
| HBV at index date | 0 (0%) | 16 (100%) | 0.354 | |
| Diabetes at index date | 85 (6%) | 1237 (94%) | 0.007 | |
| Median house-hold income | <$15K | 6 (5%) | 117 (95%) | 0.978 |
| $15 < 30K | 34 (5%) | 591 (95%) | ||
| $30 < 50K | 76 (5%) | 1424 (95%) | ||
| $50 < 75K | 53 (5%) | 939 (95%) | ||
| ≥$75K | 19 (5%) | 383 (95%) | ||
| Missing | 22 (4%) | 469 (96%) | ||
| Charlson-Deyo comorbidity score | 0 | 64 (4%) | 1761 (96%) | <0.001 |
| 1 | 40 (4%) | 968 (96%) | ||
| 2 | 18 (5%) | 336 (95%) | ||
| 3 | 88 (9%) | 858 (91%) | ||
| Fibrosis-4 index | ≤1.21 | 17 (3%) | 575 (97%) | <0.001 |
| 1.21 ≤ 5.88 | 109 (4%) | 2342 (96%) | ||
| >5.88 | 57 (10%) | 541 (90%) | ||
| Missing | 27 (5%) | 465 (95%) | ||
| Cirrhosis status | No or Compensated Cirrhosis | 184 (5%) | 3719 (95%) | <0.001 |
| Decompensated Cirrhosis | 26 (11%) | 204 (89%) | ||
| BMI category | <25 | 38 (4%) | 923 (96%) | 0.008 |
| 25 > 30 | 57 (4%) | 1293 (96%) | ||
| ≥30 | 106 (6%) | 1581 (94%) | ||
| CHeCS site | KPNW | 44 (5%) | 887 (95%) | 0.310 |
| KPHI | 15 (4%) | 407 (96%) | ||
| HFHS | 102 (5%) | 1851 (95%) | ||
| GHS | 49 (6%) | 778 (94%) | ||
| PPI during antivi-ral treatment | Yes | 47 (9%) | 500 (91%) | <0.001 |
| DAA Category | Geni (SOF + RBV) | 41 (10%) | 377 (90%) | <0.001 |
| Gen2 no RBV | 104 (4%) | 2549 (96%) | ||
| Gen2 + RBV | 50 (8%) | 598 (92%) | ||
| Pangenotypic no RBV | 10 (3%) | 333 (97%) | ||
| Pangenotypic + RBV | 5 (7%) | 64 (93%) |
Note: Generation 1: sofosbuvir (SOF) with ribavirin (RBV); Generation 2: daclatasvir + SOF, grazoprevir + elbasvir, paritaprevir + ritonavir +ombitasvir (with and without dasabuvir), simeprevir + SOF and SOF + ledipasvir; and Pangenotypic: velpatasvir + SOF, voxilaprevir + velpatasvir+SOF and glecaprevir + pibrentasvir.
Abbreviations: BMI, body mass index (kg/m2); DAA, direct-acting antiviral; Diab, type 2 diabetes; GHS, Geisinger Clinic (Danville PA); HBV, chronic hepatitis B infection; HFHS, Henry Ford Health System (Detroit MI); IFN, interferon-based treatment; KPHI, Kaiser Permanente, Hawai’I (Honolulu, HI); KPNW, Kaiser Permanente Northwest (Portland, OR); PPI, proton-pump inhibitors; RBV, ribavirin; TF, treatment failure.
P-values less than .05 were highlighted in bold.
The final IPTW and DAA generation-adjusted multivariable model included five variables: treatment duration (in months); presence of diabetes at index; and interactions of RBV with history of previous treatment failure (TF), HCV genotype, and cirrhosis status.
3.1 |. Impact of treatment duration and inclusion of RBV on SVR
Each one-month increase in treatment duration increased odds of SVR by 99% (Figure 1; aOR = 1.99, 95%CI 1.66–2.38). Inclusion of RBV in the treatment regimen significantly increased the likelihood of SVR among patients with prior DAA treatment failure (aOR = 5.43, 95%CI 1.69–17.52), but had no impact among previously untreated patients or those with IFN TF (aOR = 1.27 95%CI 0.59–2.72).
FIGURE 1.
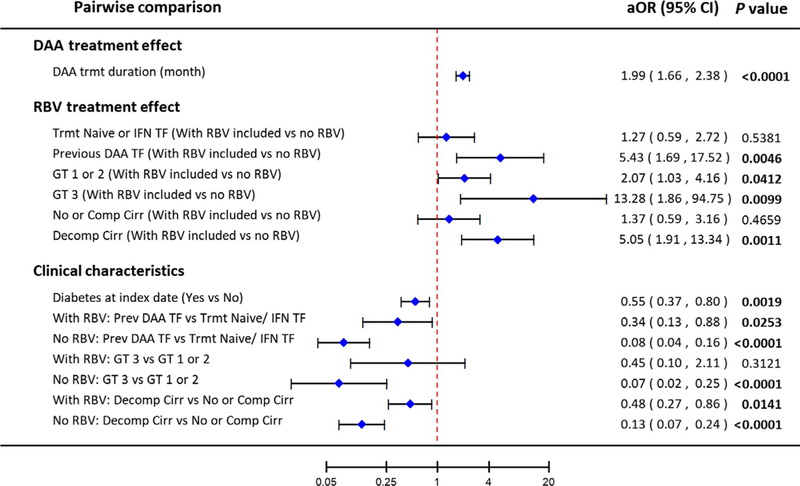
Pairwise comparisons of the effect of treatment duration, adjuvant ribavirin and patient clinical characteristics on likelihood of sustained virological response (SVR) at 12 wk after the end of treatment. aOR: adjusted odds ratio (adjusted for treatment duration, direct-acting antiviral generation, diabetes at index date, viral genotype, treatment history, and cirrhosis status); CI: confidence interval; DAA: direct-acting antiviral; TF: treatment failure; IFN: interferon-based treatment; GT: hepatitis C genotype; RBV: ribavirin
Adjuvant RBV was also associated with higher odds of SVR among patients with decompensated cirrhosis (aOR = 5.05, 95%CI 1.91–13.34), but not for patients without cirrhosis or with compensated cirrhosis (aOR = 1.37, 95%CI 0.59–3.16). This remained true in a sensitivity analysis that considered each cirrhosis category separately (Figure S1). Likewise, adjuvant RBV significantly increased SVR among patients with GT3 (aOR = 13.28, 95%CI 1.86–94.75) and had a smaller but a still significant effect among those with GT1 or 2 (aOR = 2.07, 95%CI 1.03–4.16).
3.2 |. Impact of baseline patient characteristics on SVR
Overall, patients with previous DAA TF were less likely to achieve SVR than those who were treatment naïve or had prior IFN TF (Figure 1), although the inclusion of RBV in the DAA regimen attenuated the difference (with RBV: aOR of SVR = 0.34, 95%CI 0.13–0.88; without RBV: aOR of SVR = 0.08, 95%CI 0.04–0.16). Likewise, patients with decompensated cirrhosis were less likely to achieve SVR than those with compensated cirrhosis or no cirrhosis, although the inclusion of RBV again modified the difference (with RBV: aOR of SVR = 0.48, 95%CI 0.27–0.86; without RBV: aOR of SVR = 0.13, 95%CI 0.07–0.24). In the absence of adjuvant RBV, patients with GT3 were less likely to achieve SVR than those with GT ½, but when RBV was included, there was no significant difference in SVR among genotypes. Patients with diabetes were less likely to achieve SVR than those without (aOR of SVR = 0.55, 95%CI 0.37–0.80), regardless of whether they did or did not receive RBV. Use of PPIs did not affect SVR rates (aOR = 1.23, 95%CI 0.78–1.93; P = 0.37).
3.3 |. Impact of DAA generation with and without ribavirin on SVR
The sensitivity analysis showed a significant difference in SVR rates by DAA generation, after adjusting for IPTW and covariates from the main analysis (Figure 2). Among regimens that included RBV, each subsequent DAA generation demonstrated better efficacy (Gen2 vs 1: aOR = 2.48, 95%CI 1.54–4.00; Pangenotypic vs Gen1: aOR = 16.02, 95%CI 5.26–48.80; Pangenotypic vs Gen2: aOR = 6.45 95%CI 2.22–18.78). Similarly, there was a significant difference in efficacy between pangenotypic and Gen2 regimens in the absence of RBV (aOR = 2.64, 95%CI 1.29–5.42).
FIGURE 2.
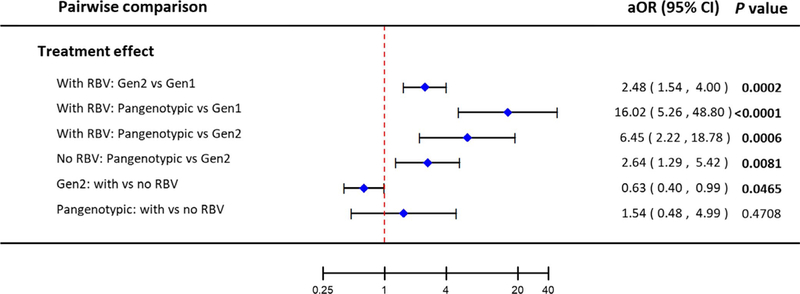
Pairwise comparisons of the effect of DAA generations on rate of sustained virological response (SVR) at 12 wk after the end of treatment. aOR: adjusted odds ratio (adjusted for treatment duration, direct-acting antiviral generation, diabetes at index date, viral genotype, treatment history, and cirrhosis status); TF: treatment failure; IFN: interferon-based treatment; Gen: treatment generation; RBV: ribavirin
In a sensitivity analysis that reclassified DAC + SOF as pangenotypic, the effects of treatment duration, adjuvant RBV in patients with decompensated cirrhosis and treatment generation were all similar to those of the main analysis (data not shown).
3.4 |. Impact of ribavirin on adverse events across DAA generations
The overall rate of adverse events (AE) was 12.0% (Table S3) and serious adverse events (SAE) was 2.6% (Table S4). The most common AEs were anaemia (4.4%), nausea (1.5%) and skin reaction (1.3%). After IPTW, patients treated with adjuvant RBV were nearly seven times more likely to have treatment-related toxicity, overall and among specific AEs, compared with those who did not receive RBV (aOR = 6.8, 95%CI 5.9–7.9). Risk of AEs with pangenotypic regimens was lower than with Gen1 or Gen2 regimens. Duration of treatment did not influence overall toxicity.
4 |. DISCUSSION
Despite the remarkable success of DAA regimens in clinical trials, they remain understudied in patients under routine care. In our cohort of ‘real-world’ patients, we observed high rates of SVR across regimens. However, a number of variables negatively affected patients’ likelihood of achieving SVR: history of previous DAA TF, decompensated cirrhosis, GT3 infection (if treated without RBV), and diabetes.
We found that patients with a history of DAA TF (either Genl or 2) were less likely to achieve SVR. Although rates of SVR in patients with previous DAA TF were still high (89%), this decreased response rate is similar to that observed in patients with decompensated cirrhosis at baseline (89%). In adjusted analyses, the impact of previous DAA TF (aOR = 0.34 and 0.08 for regimens with and without RBV, respectively, compared with treatment naïve patients or previous interferon-based TF) was greater than the impact of decompensated cirrhosis (aOR = 0.48 and 0.13 for regimens with and without RBV, respectively, compared with no cirrhosis/compensated cirrhosis). As patients with previous DAA TF comprise a significant and likely growing minority of the chronic HCV patient population (2.8% of our cohort), better guidance regarding appropriate management and treatment options (such as increased treatment duration) is needed to ensure that these patients are treated successfully.
We observed increasing proportions of treatment among patients with cirrhosis as DAA generations progressed. For example, only 16% of patients treated with Gen2 +RBV had decompensated cirrhosis; this proportion increased to 23% of patients receiving pangenotypic regimens +RBV. Despite a clear trend in reduction of SVR among patients with decompensated cirrhosis (aOR = 0.48 and 0.13 for regimens with and without RBV, respectively, compared with no or patients with compensated cirrhosis), overall SVR rates were still high (89%).
We observed marked differences in SVR rates by HCV geno-type. In pairwise comparisons of patients who did not receive RBV, GT1 or GT2 patients treated were 14.3 times as likely to achieve SVR than patients with GT3 patients.
Although there is clinical trials data suggesting that PPI use may reduce DAA effectiveness,2 we did not observe a significant reduction in SVR among patients using PPIs (OR = 1.23, 95%CI 0.78–1.93; P = 0.37) after adjusting the other baseline covariates, nor did we observe a significant interaction between PPI use and treatment generation, suggesting that there was no overall difference across treatment regimens. Although our sample size does not permit investigation of the impact of PPI use on individual treatment regimens, an ad hoc analysis did not find significant differences in the effect of PPI use on ledipasvir/sofosbuvir compared with other regimens (data not shown). Our findings are consistent with those of another study of patients under routine clinical care.11
We observed consistent SVR rates across all CHeCS health systems (including those with and without hepatology specialty clinics), suggesting consistent management across sites. There were also no differences in SVR rates between HIV or HBV co-infected patients and HCV mono-infected patients; this is consistent with a study in a German cohort that included HIV co-infected patients.12
Increasing treatment duration improved SVR rates, irrespective of treatment regimen. Each one-month increase in treatment duration nearly doubled the odds of SVR (aOR = 1.99, 95%CI 1.66–2.38). In other words, each additional month (4 weeks) of treatment reduced the risk of non-SVR by 50%. This finding should inform management of patients—such as those with previous DAA treatment failure—who are at higher risk of treatment failure.
The use of RBV in patients with decompensated cirrhosis increased the likelihood of SVR (aOR = 5.05, 95%CI 1.91–13.34). These findings are consistent with two previous clinical trials,13,14 corroborating that the addition of RBV may be particularly beneficial for patients with decompensated cirrhosis in a ‘real-world’ setting. Our study also demonstrates that adjuvant RBV increases the likelihood of SVR in patients with prior DAA TF (aOR = 5.43 95%CI 1.69–17.52). Likewise, among patients with GT3, regimens that included RBV improved the likelihood of SVR (aOR = 13.28, 95%CI 1.86–94.75) compared to those without.
We used several methods to address the inherent complexity of adjuvant RBV use with DAA regimens, including propensity score adjustment, which reduces confounding when both a treatment and the indications for that treatment may influence an outcome. We observed a number of significant differences between patients who did and did not receive RBV; however, these differences were balanced after propensity score adjustment, permitting valid comparisons between these groups. The analysis of covariate-by-RBV interactions further confirmed the benefit of adjuvant RBV among patients with decompensated cirrhosis, those with previous DAA TF, and those with GT3.
Although CHeCS is among the largest long-term observational studies of patients with chronic viral hepatitis, this analysis has several unavoidable limitations. One limitation is that we do not have data on resistance patterns due to the observational nature of our study. Another limitation is the low rate of treatment failure in our overall sample (n = 210, 5%). While an excellent outcome for patients, this limits statistical power to identify factors that may convey a low-to-moderate risk for non-SVR. It also limited the number of covariates that could be included in the multivariable model without overfitting, based on the 10-to-1 rule (minimum ratio of events per total predictor degrees of freedom).15,16 We sought to be conservative regarding which variables were included in the final model and tested only those covariate-by-RBV interactions for which the covariate was significant in the multivariable model. To avoid over-fitting, we were unable to test covariate-by-treatment duration interaction effects. Due to the low non-SVR rate and sample size, we are also unable to study the individual DAA drug regimen effects. However, given the lack of interaction between DAA generations/ RBV and HCV genotype, we conclude that the effects of antiviral regimens/RBV were consistent across genotypes. Finally, although our study cohort is large and reflective of routine clinical care at four large integrated health systems across the United States with broad catchment areas, the results may not be generalizable to other populations.
Using a large ‘real world’ sample of US patients, we have shown that the newest DAA regimens demonstrate excellent rates of SVR across patient populations. However, certain patient groups—particularly those with previous DAA treatment failure, those with decompensated cirrhosis, and those with GT3—still remain more difficult to treat successfully. We found that each one-month increase in DAA treatment duration reduced the rate of treatment failure by 50%, regardless of treatment regimen. We also found for the first time in a ‘real-world’ setting that adjuvant RBV significantly improved treatment SVR response in patients with cirrhotic decompensation or previously unsuccessful DAA treatment. These observations may help inform treatment decisions, especially among patients at higher risk of treatment failure.
Supplementary Material
Acknowledgments
Stuart C. Gordon receives grant/research support from AbbVie Pharmaceuticals, Bristol-Myers Squibb, Conatus, CymaBay, Gilead Sciences, Intercept Pharmaceuticals and Merck. He serves as an ad hoc consultant/advisor for AbbVie, Gilead, Intercept and Merck. Mei Lu, Kuan-Han Wu, Jia Li, Lora Rupp, Sheri Trudeau, Talan Zhang, Kuan-Han Wu, Yihe G. Daida, Mark A. Schmidt and Joseph A. Boscarino receive grant/ research support from Gilead Sciences and Intercept Pharmaceuticals.
Funding information
CHeCS is funded by Centers for Disease Control and Prevention, and by Gilead Pharmaceuticals. The findings and conclusions in this report are those of the authors and do not necessarily represent the official position of the Centers for Disease Control and Prevention.
Abbreviations:
- AE
adverse events
- aOR
adjusted odds ratio
- BMI
body mass index
- CHeCS
Chronic Hepatitis Cohort Study
- CI
confidence interval
- DAA
Direct-acting antivirals
- GHS
Geisinger Health System (Dansville PA)
- GT
genotype
- HCV
hepatitis C virus
- HFHS
Henry Ford Health System (Detroit MI)
- IFN
interferon-based treatment
- IPTW
inverse probability of treatment weighting
- KPHI
Kaiser Permanente, Hawai’ i (Honolulu, HI)
- KPNW
Kaiser Permanente Northwest (Portland, OR)
- PPIs
proton-pump inhibitors
- RBV
ribavirin
- SOF
sofosbuvir
- SVR
sustained virological response
- TF
treatment failure
Footnotes
CONFLICTS OF INTEREST
Other authors have no conflicts of interest to declare.
SUPPORTING INFORMATION
Additional supporting information may be found online in the Supporting Information section at the end of the article.
REFERENCES
- 1.Feld JJ, Moreno C, Trinh R, et al. Sustained virologic response of 100% in HCV genotype 1b patients with cirrhosis receiving om-bitasvir/paritaprevir/r and dasabuvir for 12 weeks. J Hepatol. 2016;64(2):301–307. [DOI] [PubMed] [Google Scholar]
- 2.Terrault NA, Zeuzem S, Di Bisceglie AM, et al. Effectiveness of ledipasvir-sofosbuvir combination in patients with hepatitis C virus infection and factors associated with sustained virologic response. Gastroenterology. 2016;151(6): 1131–1140.e5. [DOI] [PMC free article] [PubMed] [Google Scholar]
- 3.Backus LI, Belperio PS, Shahoumian TA, Loomis TP, Mole LA. Real-world effectiveness of ledipasvir/sofosbuvir in 4,365 treatment-naive, genotype 1 hepatitis C-infected patients. Hepatology. 2016;64(2):405–414. [DOI] [PubMed] [Google Scholar]
- 4.Calleja JL, Crespo J, Rincón D, et al. Effectiveness, safety and clinical outcomes of direct-acting antiviral therapy in HCV genotype 1 infection: results from a Spanish real-world cohort. J Hepatol. 2017;66(6):1138–1148. [DOI] [PubMed] [Google Scholar]
- 5.Feld JJ, Jacobson IM, Sulkowski MS, Poordad F, Tatsch F, Pawlotsky JM. Ribavirin revisited in the era of direct-acting antiviral therapy for hepatitis C virus infection. Liver Int. 2017;37(1):5–18. [DOI] [PMC free article] [PubMed] [Google Scholar]
- 6.Hezode C Treatment of hepatitis C: results in real life. Liver Int. 2018;38(Suppl 1):21–27. [DOI] [PubMed] [Google Scholar]
- 7.Lu M, Rabin D, Rupp L, Trudeau S, Li J, Gordon S. Validity of an automated algorithm using diagnosis and procedure codes to identify decompensated cirrhosis using electronic health records (EHR). Clin Epidemiol. 2017;9:369–376. [DOI] [PMC free article] [PubMed] [Google Scholar]
- 8.Steventon A, Grieve R, Sekhon J. A comparison of alternative strategies for choosing control populations in observational studies. Health Serv Outcomes Res Methodol. 2015;15:1–25. [DOI] [PMC free article] [PubMed] [Google Scholar]
- 9.Deyo RA, Cherkin DC, Ciol MA. Adapting a clinical comorbidity index for use with ICD-9-CM administrative databases. J Clin Epidemiol. 1992;45(6):613–619. [DOI] [PubMed] [Google Scholar]
- 10.Zhang J, Yu KF. What’s the relative risk? A method of correcting the odds ratio in cohort studies of common outcomes. JAMA. 1998;280(19):1690–1691. [DOI] [PubMed] [Google Scholar]
- 11.Tapper EB, Bacon BR, Curry MP, et al. Evaluation of proton pump inhibitor use on treatment outcomes with ledipasvir and sofosbuvir in a real-world cohort study. Hepatology. 2016;64(6):1893–1899. [DOI] [PubMed] [Google Scholar]
- 12.Bischoff J, Mauss S, Cordes C, et al. Rates of sustained virological response 12 weeks after the scheduled end of direct-acting antiviral (DAA)-based hepatitis C virus (HCV) therapy from the National German HCV registry: does HIV coinfection impair the response to DAA combination therapy? HIV Med. 2018;19(4):299–307. [DOI] [PubMed] [Google Scholar]
- 13.Charlton M, Everson GT, Flamm SL, et al. Ledipasvir and sofosbuvir plus ribavirin for treatment of HCV infection in patients with advanced liver disease. Gastroenterology. 2015;149(3):649–659. [DOI] [PubMed] [Google Scholar]
- 14.Curry MP, Forns X, Chung RT, et al. Sofosbuvir and ribavirin prevent recurrence of HCV infection after liver transplantation: an open-label study. Gastroenterology. 2015;148(1):100–107.e1. [DOI] [PubMed] [Google Scholar]
- 15.Harrell FE Jr, Lee KL, Califf RM, Pryor DB, Rosati RA. Regression modelling strategies for improved prognostic prediction. Stat Med. 1984;3(2):143–152. [DOI] [PubMed] [Google Scholar]
- 16.Harrell FE Jr, Lee KL, Mark DB. Multivariable prognostic models: issues in developing models, evaluating assumptions and adequacy, and measuring and reducing errors. Stat Med. 1996;15(4):361–387. [DOI] [PubMed] [Google Scholar]
Associated Data
This section collects any data citations, data availability statements, or supplementary materials included in this article.