Significance
Water is considered to be a stable and relatively inert molecule in bulk solution. We report an exceptional behavior of water: Water molecules are spontaneously oxidized to form hydrogen peroxide near the water−air interface of micron-sized water droplets. This process does not require any chemical reagent, catalyst, applied electric potential, or radiation. Only pure water in the form of microdroplets in air is necessary for the appearance of hydrogen peroxide. We suggest that this discovery opens various innovative opportunities including green and inexpensive production of hydrogen peroxide, green chemical synthesis, safe cleaning, and food processing.
Keywords: microdroplet, hydrogen peroxide, water oxidation, water−air interface, green chemistry
Abstract
We show H2O2 is spontaneously produced from pure water by atomizing bulk water into microdroplets (1 μm to 20 µm in diameter). Production of H2O2, as assayed by H2O2-sensitve fluorescence dye peroxyfluor-1, increased with decreasing microdroplet size. Cleavage of 4-carboxyphenylboronic acid and conversion of phenylboronic acid to phenols in microdroplets further confirmed the generation of H2O2. The generated H2O2 concentration was ∼30 µM (∼1 part per million) as determined by titration with potassium titanium oxalate. Changing the spray gas to O2 or bubbling O2 decreased the yield of H2O2 in microdroplets, indicating that pure water microdroplets directly generate H2O2 without help from O2 either in air surrounding the droplet or dissolved in water. We consider various possible mechanisms for H2O2 formation and report a number of different experiments exploring this issue. We suggest that hydroxyl radical (OH) recombination is the most likely source, in which OH is generated by loss of an electron from OH− at or near the surface of the water microdroplet. This catalyst-free and voltage-free H2O2 production method provides innovative opportunities for green production of hydrogen peroxide.
We have shown that, unlike bulk water, tiny water droplets (microdroplets) cause reduction of gold ions (1) as well as a number of organic compounds (2). Evidence has been presented that the source of electrons arises from hydroxyl anions (OH−) at or near the surface of the microdroplet (2). We report the formation of hydrogen peroxide (H2O2) in aqueous microdroplets and suggest that the observed H2O2 results from the recombination of hydroxyl radicals (OH) at or near the air−water interface of aqueous microdroplets sprayed into room-temperature air.
Hydrogen peroxide is a commodity chemical that has many different applications, such as chemical synthesis or as a disinfectant, in mining and metal processing, as well as pulp and textile bleaching (3). H2O2 has often been touted as a green oxidant because, upon decomposition, it generates oxygen and water (4). However, the most common industrial method (∼95% worldwide) for H2O2 synthesis (5), the 2-step anthraquinone process, cannot be considered green (6) because organic wastes are generated from inefficient oxidation of the anthraquinone. Some advances in H2O2 synthesis have focused on catalytically combining H2 and O2 (7, 8). Other methods electrochemically generate H2O2 by electrolysis of O2 at the anode (9, 10), or photocatalytically generate reactive superoxo radicals (11). Recently, H2O2 was formed from a reaction between plasma and a water surface (12). However, these direct synthesis methods of H2O2 have limitations, including the use of precious metal catalysts, low yields, required H2 supply, and high energy consumption (13, 14). In what follows, we report the direct, spontaneous generation of H2O2 from aqueous microdroplets in the absence of applied voltage, catalyst, or any other added chemicals. We also speculate about the nature of the mechanism responsible for these observations.
Results and Discussion
H2O2 Generation in Microdroplet Probed by a H2O2-Sensitive Fluorescence Probe.
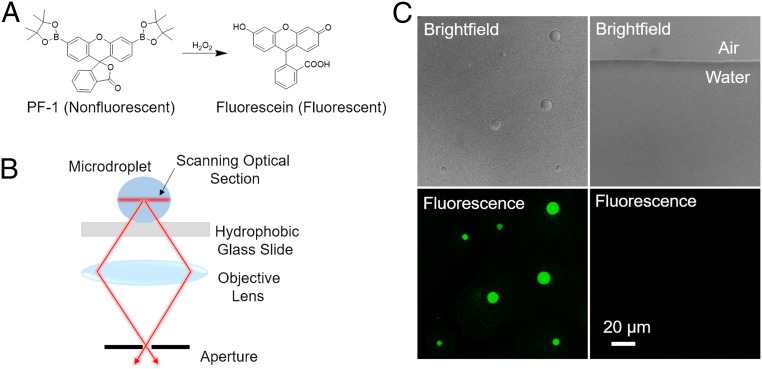
To examine the production of H2O2 in an aqueous microdroplet, we utilized a H2O2-sensitive water-soluble fluorescent probe, peroxyfluor-1 (PF-1), originally reported by Chang and coworkers (15, 16). The compound PF-1, which is not fluorescent, is known to respond selectively to H2O2 to liberate fluorescein (Fig. 1A). In bulk water, fluorescence was observed from a solution of 10 µM PF-1 and 100 µM H2O2 (SI Appendix, Fig. S1), but no fluorescence was observed in the absence of H2O2 (SI Appendix, Fig. S2). An aqueous solution containing 10 µM PF-1 was sprayed onto a hydrophobic silane-treated glass surface. The resulting supported microdroplets were analyzed by confocal microscopy to establish a relationship between microdroplet diameter and observed fluorescence intensity (Fig. 1B). Strong fluorescence emission was observed from microdroplets containing 10 µM PF-1, but not in bulk water (Fig. 1C). These observations demonstrate that H2O2 was generated in microdroplets, but not in detectable amounts in bulk water or at the air−water interface of bulk water (Fig. 1 C, Right).
Fig. 1.
Fluorescence imaging of spontaneous generation of hydrogen peroxide in aqueous microdroplets: (A) reaction scheme between PF-1 and hydrogen peroxide; (B) schematic of confocal microscope setup for imaging microdroplets; and (C) brightfield and fluorescence images of microdroplets (2 μm to 17 µm in diameter) at Left and bulk water at Right including the flat air-bulk-water interface. Each sample contains 10 µM PF-1. Only microdroplets display fluorescence from fluorescein caused by H2O2 cleavage of PF-1. (Scale bar, 20 μm.)
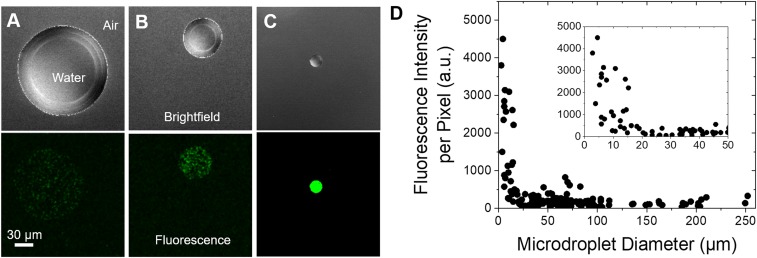
Fig. 2 A–C shows brightfield and fluorescence images of microdroplets of 160, 50, and 16 µm in diameter, respectively. Higher fluorescence intensity was observed for microdroplets with smaller diameters, indicating that the yield of H2O2 increased as microdroplet size decreased. A detailed analysis of the relationship between fluorescence intensity and microdroplet size revealed that the fluorescence intensity increased significantly below a diameter of ∼20 µm (Fig. 2D).
Fig. 2.
Dependence of fluorescence intensity on the size of microdroplets. Brightfield and fluorescence images of microdroplets containing 10 µM PF-1 with diameters of (A) 160 µm, (B) 50 µm, and (C) 16 µm. (D) Relationship between fluorescence intensity and microdroplet diameter, indicating a higher concentration of hydrogen peroxide is generated in smaller microdroplets. (Inset) fluorescence intensity vs. microdroplet diameter for 1 μm to 50 µm. (Scale bar, 30 μm.)
The Confirmation of H2O2 Generation in Microdroplets Using Mass Spectrometry and NMR.
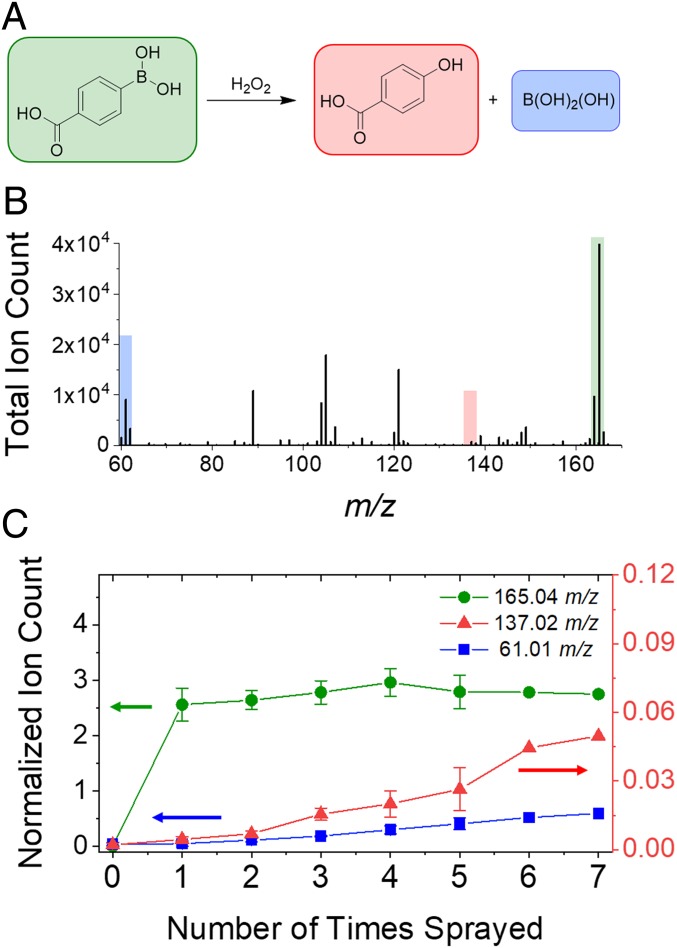
We further confirmed the production of H2O2 in aqueous microdroplets by assaying the cleavage of 4-carboxyphenylboronic acid (4-CPB) by H2O2, which yields boric acid and 4-hydroxybenzoic acid (4-HB) (Fig. 3A). An aqueous solution of 100 µM 4-CPB was sprayed into a mass spectrometer for analysis. In addition to the parent peak centered at 165.0359 mass to charge ratio (m/z) (4-CPB), small peaks at 137.0240 m/z and 61.0103 m/z were observed (Fig. 3B), corresponding to 4-HB and boric acid. The solution containing 4-CPB was sprayed into a collection vial, redissolved in water, and then resprayed. This process was repeated up to 7 times, and the relative ion count of both the 4-HB and boric acid increased linearly after each spray (Fig. 3C). This result indicates that the observed products of boronic acid cleavage are indeed from a reaction with H2O2 within the sprayed microdroplets and not from trace contaminants or from gas-phase reactions within the mass spectrometer.
Fig. 3.
Molecular signature of H2O2 production in aqueous microdroplets using boronic acid probe as a function of consecutive sprays. (A) Reaction scheme of H2O2-promoted deborylation of 4-CPB. (B) Mass spectrum of aqueous microdroplets containing 100 µM 4-CPB and 10 µM sodium benzoate (as internal standard) on the seventh consecutive spray. (C) Normalized ion count of 4-CPB (purple, 165 m/z) starting material, and H2O2 deborylation products, 4-HB acid (red, 137 m/z) and boric acid (blue, 61 m/z), over multiple sprays. Error bars represent 3 replicates for sprays 1 through 4, and 2 replicates for spray 5.
An additional experiment was carried out to assess whether the generation of the phenol 4-HB from 4-CPB was from H2O2 generated in microdroplets and not from another adventitious reaction of an arylboronic acid in microdroplets. In this experiment, D2O was sprayed and collected 3 times. The resulting solution was added to a 100-µM D2O solution of phenylboronic acid (PB), and this mixture was incubated overnight at room temperature. Analysis of the resulting solution by 1H NMR revealed that ∼30% of the PB was converted to phenol. This result indicates that hydrogen peroxide is generated in aqueous microdroplets and that the hydrogen peroxide can be collected and utilized for subsequent reactions (see SI Appendix, Fig. S3 and section S2 for further details). This additional experiment also shows that what we have observed by mass spectrometry is not an artifact or a result of microdroplet evaporation in the heated capillary inlet.
Quantification of H2O2 Production in Microdroplets.
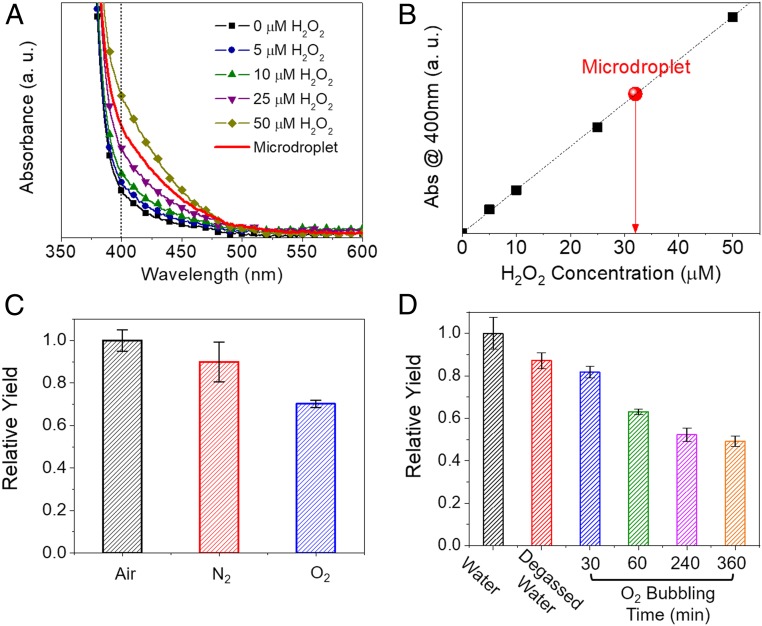
Quantitative analysis of H2O2 production from aqueous microdroplets was carried out with potassium titanium oxalate (PTO, K2TiO(C2O4)2·H2O) titration and peroxide test strip assays (Movie S1). The agreement between these 2 quantification methods was confirmed using a standard H2O2 solution (SI Appendix, Fig. S4). Fig. 4A shows the absorption spectra of 0.1 M PTO solution with various concentrations of H2O2 as well as with the microdroplet sample. As shown in Fig. 4B, the H2O2 production yield was ∼30 µM (∼1 part per million [ppm]).
Fig. 4.
H2O2 concentration as a function of different operating conditions. (A) Absorption spectrum of aqueous PTO solution with added H2O2. Example microdroplet spectrum in red. (B) Calibration curve at 400 nm from A. The red circle represents the concentration of H2O2 generated from aqueous microdroplets acquired from the spectra in A. (C) The effect of varying the nebulizing gas. (D) The effect of dissolving different gases in water. Both C and D are measured with peroxide test strips. Error bars represent 1 SD from 3 measurements.
The quantitative comparison of H2O2 production yield for microdroplets with different sizes was acquired by controlling microdroplet size with different N2 nebulization gas pressures. We find that the H2O2 production yield is inversely proportional to microdroplet size (SI Appendix, Fig. S5), which is consistent with the observation of higher fluorescence emission of PF-1 for smaller microdroplets (Fig. 2D).
Mechanism of H2O2 Generation in Microdroplets.
Having solidly established that H2O2 is produced in aqueous microdroplets, we investigated possible pathways for its formation. Hydrogen must originate from water, but there are 2 initial sources of oxygen to form H2O2: water and atmospheric O2. First, we measured H2O2 production under different nebulization gases: dry air, N2, and O2 using peroxide test strips (Fig. 4C). Changing the gas from N2 to air did not change the H2O2 yield significantly. Changing the gas from air to O2 led to a decrease in the H2O2 yield, suggesting that the reactions that generate H2O2 in microdroplets do not involve atmospheric oxygen as a reactant. In addition, we examined whether the dissolved oxygen is a source by measuring H2O2 yield after bubbling water with O2 for different durations (Fig. 4D). The amount of H2O2 produced decreased as a function of the time spent bubbling O2. These data show that the H2O2 was generated from aqueous microdroplets, not from oxidation by atmospheric or dissolved oxygen. The decrease of H2O2 yield upon dissolving oxygen in water microdroplets may be caused by the trapping of oxygen to form the perhydroxyl radical that interferes with H2O2 formation (17).
Water is not readily oxidized or reduced unless subjected to strong oxidants, reductants, or applied voltage. There are several possible origins for the formation of H2O2, including triboelectric effect, asymmetric charge separation during microdroplet fission, contact electrification, and the oxidation of water by the intrinsic surface potential of the water microdroplet surface. We have examined each possibility. First, the oxidation of water might be caused by the streaming electrification (18) between water and the capillary. We examined this possibility by measuring the production yield of H2O2 in microdroplets with different capillary lengths. Essentially no difference in the production yield was observed (SI Appendix, Fig. S6). If the phenomenon were caused by streaming electrification, the production yield would be expected to be proportional to the length of capillary. We also examined the production yield using different capillary materials, including silica, polyether ether ketone, and phenyl-methylpolysiloxane−coated fused silica (DB-5, Agilent Technologies). We observed no difference in the production yield (SI Appendix, Fig. S7). We also tested the possibility of electrification between water and the pressurized nebulizing gas being a cause of the water oxidation, by comparing the production yield of H2O2 from microdroplet spray and bulk water blown with the same dry N2 gas for several hours. There was no H2O2 formation in the bulk water with the contact of a stream of N2 gas. These data suggest that electrification may not likely be the origin.
Because electrification can occur by charge transfer between the silica capillary and the water inside the capillary, we measured the H2O2 yield after replacing the silica capillary with a stainless steel capillary with and without grounding (0 V). SI Appendix, Fig. S8 clearly shows that there is no difference in the production yield, demonstrating the charge transfer between silica capillary and water inside the capillary was not the origin of the water oxidation.
We also considered whether asymmetric microdroplet fission and imbalanced net charge formation during droplet fission and evaporation (19) could be a cause. Previously, we reported that aqueous microdroplets maintain their sizes with minimum evaporation up to ∼130 µs of microdroplet traveling time (20, 21). Moreover, asymmetric fission has been measured to occur on a longer timescale (22). We did observe the production of H2O2 at a short distance with less than ∼100-µs reaction time. This result shows that droplet fission or evaporation might not be the primary cause of H2O2 formation.
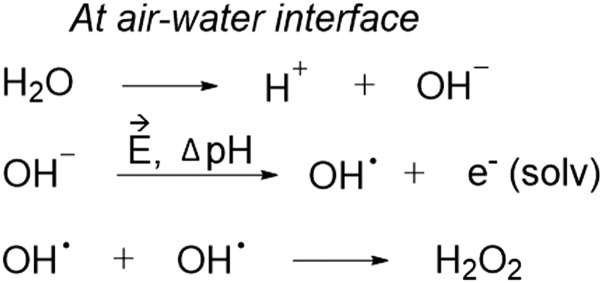
The fourth possibility would be the formation of H2O2 through spontaneous oxidation of water by a strong intrinsic electric field at the water−air interface of microdroplets. Several factors unique to microdroplets may be responsible for our proposed mechanism where an electric field generates hydroxyl radicals from OH−, which recombine into H2O2 (Fig. 5). First, the air−water interface of a microdroplet has a strong electric field, on the order of 109 V/m (23). This electric field strength is enough to ionize hydroxide ions to form hydroxyl radicals. Furthermore, in microdroplets, the hydronium ions and hydroxide ions are separated and heterogeneously distributed (24), which enhances the electric field strength at the microdroplet surface. This line of reasoning is supported by our observation of higher efficiency of H2O2 production for smaller microdroplets that have increased curvature, which induces charge accumulation at the surface, and thereby increases the electric field strength. Second, the redox potential can be shifted by electric field or local pH change (25) in microdroplets (24). In addition, it was shown that the pKa and the redox potential at the water−air interface shifts from that in the bulk, suggesting the microdroplet surface promotes redox reactions by providing an energetically favorable environment (26–29). These changes in redox potential may lower the energetic barrier for the water oxidation at the surface of the microdroplet, as we observed before, as a reduced free-energy barrier for ribose phosporylation in microdroplets (30). Previously, we have shown the spontaneous formation of hydroxyl radicals in water microdroplets using salicylate (31) that forms 2,3-dihydroxybenzoic acid and 2,5-dihydroxybenzoic acid upon reaction with OH radicals (2). The work of Du et al. (32) shows that OH radicals readily combine to form H2O2 in the presence of water. We do not know the fate of the released electrons, but, possibly, they can be accepted by liquid water or used for the reduction of hydrogen ions in water (33, 34).
Fig. 5.
Proposed mechanism to form H2O2 at the air−water interface of microdroplets. First, the autoionization of water into H+ and OH− readily occurs at and near the air−water interface of the microdroplet. Then, due to the pH gradient and electric field, OH radicals are formed, releasing a solvated electron. Finally, 2 OH radicals at and near the water microdroplet interface recombine to form H2O2.
It is well known that raindrops contain hydrogen peroxide (35, 36). The formation of hydrogen peroxide has been considered to be photochemical in origin, starting from ultraviolet (UV) photolysis of O3 (37). The positive correlation between the daytime and the amount of H2O2 found in raindrops clearly indicates that the photolysis of O3 would be a primary source of H2O2. However, approximately a 10-µM concentration of H2O2, similar to the concentration reported in this work, is found in nighttime raindrops, suggesting the presence of another mechanism of H2O2 production in clouds. Thus, the present study may help to explain a well-known fact of how nature behaves. In addition, we found that the production yield of H2O2 increased by irradiating UV (254 nm) lights on microdroplets, but was not affected by visible light, confirming that the production of H2O2 from water microdroplets did not arise from a photochemical origin (SI Appendix, Fig. S9)
Conclusions
The present work establishes the spontaneous generation of H2O2 from aqueous microdroplets and offers a method for its direct production from water. This chemical-free, catalyst-free, and voltage-free synthesis of H2O2 needs only water and modest equipment to generate sprayed microdroplets. Although water is a most common substance, its behavior still holds many poorly understood features. The present study on water microdroplets emphasizes how different their behavior can be from bulk water.
Materials and Methods
General Details.
High-performance liquid chromatography-grade water was used for all experiments. D2O (100 atom%) was from Acros Organics. The 4-CPB, salicylic acid, and K2TiO(C2O4)2·H2O were used as received from SigmaAldrich, and PB was used as received from Strem Chemical. Fluorophore PF-1 was synthesized as reported by Chang and coworkers (15). Peroxide test strips (Quantofix; Macherey-Nagel), range of 0.5 ppm to 25 ppm H2O2, were used.
Microdroplet Generation.
Unless otherwise noted in SI Appendix, Supplementary Materials and Methods, microdroplets were generated by spraying water at a rate of 5 μL/min through 100-µm inner diameter fused silica tubing with 120 pounds per square inch N2 coaxial sheath gas.
Fluorescence Imaging.
Confocal fluorescence imaging studies were performed with an inverted Zeiss LSM 780 AxioObserver laser scanning confocal microscope and 40× oil-type objective lens (EC Plan-Neofluar 40×/1.30 Oil DIC M27). The solution containing 10 μM PF-1 was excited with a 488-nm Ar ion laser, and emission was collected between 499 nm and 641 nm. The optical section thickness was ∼500 nm. Aqueous solution containing 10 μM PF-1 was sprayed on hydrophobic silane-treated glass slides at about 1.5 cm distance from a spray source. The glass slide with microdroplets sprayed was mounted on the confocal microscope equipped with a humidified chamber to prevent a rapid evaporation of sprayed microdroplets. Imaging was carried out within several seconds after spraying, before any significant evaporation occurred.
Preparing Hydrophobic Glass.
A coverslip (102460, thickness #1; Thermo Scientific) was rinsed with deionized water, sonicated in ethanol, and then sonicated in water. It was dried in an oven at 100 °C for 10 min and placed under a UV lamp for 30 min. Then, it was incubated in prepared trichloro(octadecyl)silane (OTS, 104817; Sigma) solution (30 μL OTS in 10 mL toluene) for 20 min. After the incubation, it was transferred to a beaker containing only toluene to remove excess OTS followed by drying in an oven at 100 °C for 5 min. It was then submerged in 10 mL of toluene to cover the entire surface of the glass and sonicated for 10 min. After all these processes were complete, the coverslip was dried under a flow of N2. It was confirmed that the fluorescence emission in microdroplets containing PF-1 was not affected by the glass surface functionalization.
Quantification of H2O2 Production.
The H2O2 concentration in microdroplets was determined by PTO and spectrophotometric analysis with a maximum response at 400 nm. A 0.1 M PTO (K2TiO(C2O4)2·H2O; ≥99.0%; Sigma-Aldrich) solution was prepared. To develop the calibration curve, 200 μL of a H2O2 standard solution with concentration between 0 mM and 100 µM was added into 200 μL of PTO solution. From this mixture, a 300-μL aliquot was removed, and its absorbance at 400 nm was measured using a Tecan Infinite M1000 Plate Reader (Tecan Benelux BVBA). An identical procedure was conducted on microdroplet samples where 200 μL of collected microdroplets was combined with PTO. The H2O2 concentration of microdroplet samples could be determined from the calibration curve.
The H2O2 concentration of microdroplets was also confirmed using peroxide test strips (range of 0.5–25 ppm H2O2, Quantofix; Macherey-Nagel). The effects of varying the nebulizing gas and dissolved gas composition in water, capillary length, capillary materials, grounded metal, and UV irradiation on H2O2 production yield were determined using peroxide test strip method. The agreement of measured H2O2 concentration between the methods of PTO assay and peroxide strip was confirmed as shown by SI Appendix, Fig. S4.
Supplementary Material
Acknowledgments
K.L.W. thanks the Graduate Research Fellowship Program (National Science Foundation) and the Center for Molecular Analysis and Design (Stanford University) for support. H.S.H. acknowledges support from the Volkswagen Group of America. This work was funded by the Air Force Office of Scientific Research through Basic Research Initiative Grant FA9550-12-1-0400, and by the Institute for Basic Science (IBS-R013-D1).
Footnotes
The authors declare no conflict of interest.
See Commentary on page 19222.
This article contains supporting information online at www.pnas.org/lookup/suppl/doi:10.1073/pnas.1911883116/-/DCSupplemental.
References
- 1.Lee J. K., Samanta D., Nam H. G., Zare R. N., Spontaneous formation of gold nanostructures in aqueous microdroplets. Nat. Commun. 9, 1562 (2018). [DOI] [PMC free article] [PubMed] [Google Scholar]
- 2.Lee J. K., Samanta D., Nam H. G., Zare R. N., Micrometer-sized water droplets induce spontaneous reduction. J. Am. Chem. Soc. 141, 10585–10589 (2019). [DOI] [PubMed] [Google Scholar]
- 3.Anonymous , “Environmental applications of hydrogen peroxide” in Applications of Hydrogen Peroxide and Derivatives, Jones C. W., Clark J. H., Eds. (The Royal Society of Chemistry, 1999), pp. 207–230. [Google Scholar]
- 4.Noyori R., Aoki M., Sato K., Green oxidation with aqueous hydrogen peroxide. Chem. Commun. (Camb.), 1977–1986 (2003). [DOI] [PubMed] [Google Scholar]
- 5.Anonymous , “Application of hydrogen peroxide for the synthesis of fine chemicals” in Applications of Hydrogen Peroxide and Derivatives, Jones C. W., Clark J. H., Eds. (The Royal Society of Chemistry, 1999), pp. 79–178. [Google Scholar]
- 6.Huang M. Z., Hsu H. J., Lee J. Y., Jeng J., Shiea J., Direct protein detection from biological media through electrospray-assisted laser desorption ionization/mass spectrometry. J. Proteome Res. 5, 1107–1116 (2006). [DOI] [PubMed] [Google Scholar]
- 7.Edwards J. K., et al. , The direct synthesis of hydrogen peroxide using platinum-promoted gold–palladium catalysts. Angew. Chem. Int. Ed. Engl. 53, 2381–2384 (2014). [DOI] [PubMed] [Google Scholar]
- 8.Landon P., Collier P. J., Papworth A. J., Kiely C. J., Hutchings G. J., Direct formation of hydrogen peroxide from H2/O2 using a gold catalyst. Chem. Commun. (Camb.), 2058–2059 (2002). [DOI] [PubMed] [Google Scholar]
- 9.Yamanaka I., Murayama T., Neutral H2O2 synthesis by electrolysis of water and O2. Angew. Chem. 120, 1926–1928 (2008). [DOI] [PubMed] [Google Scholar]
- 10.Murayama T., Yamanaka I., Neutral H2O2 synthesis by electrolysis of O2 and water. ECS Trans. 25, 19–24 (2010). [DOI] [PubMed] [Google Scholar]
- 11.Yasuhiro S., et al. , Sunlight-driven hydrogen peroxide production from water and molecular oxygen by metal-free photocatalysts. Angew. Chem. 126, 13672–13677 (2014). [DOI] [PubMed] [Google Scholar]
- 12.Liu J., et al. , Direct synthesis of hydrogen peroxide from plasma-water interactions. Sci. Rep. 6, 38454 (2016). [DOI] [PMC free article] [PubMed] [Google Scholar]
- 13.Samanta C., Direct synthesis of hydrogen peroxide from hydrogen and oxygen: An overview of recent developments in the process. Appl. Catal. A Gen. 350, 133–149 (2008). [Google Scholar]
- 14.Yi Y., Wang L., Li G., Guo H., A review on research progress in the direct synthesis of hydrogen peroxide from hydrogen and oxygen: Noble-metal catalytic method, fuel-cell method and plasma method. Catal. Sci. Technol. 6, 1593–1610 (2016). [Google Scholar]
- 15.Miller E. W., Albers A. E., Pralle A., Isacoff E. Y., Chang C. J., Boronate-based fluorescent probes for imaging cellular hydrogen peroxide. J. Am. Chem. Soc. 127, 16652–16659 (2005). [DOI] [PMC free article] [PubMed] [Google Scholar]
- 16.Chang M. C. Y., Pralle A., Isacoff E. Y., Chang C. J., A selective, cell-permeable optical probe for hydrogen peroxide in living cells. J. Am. Chem. Soc. 126, 15392–15393 (2004). [DOI] [PMC free article] [PubMed] [Google Scholar]
- 17.Collin F., Chemical basis of reactive oxygen species reactivity and involvement in neurodegenerative diseases. Int. J. Mol. Sci. 20, E2407 (2019). [DOI] [PMC free article] [PubMed] [Google Scholar]
- 18.Dumitrescu I., Anand R. K., Fosdick S. E., Crooks R. M., Pressure-driven bipolar electrochemistry. J. Am. Chem. Soc. 133, 4687–4689 (2011). [DOI] [PubMed] [Google Scholar]
- 19.Zilch L. W., Maze J. T., Smith J. W., Ewing G. E., Jarrold M. F., Charge separation in the aerodynamic breakup of micrometer-sized water droplets. J. Phys. Chem. A 112, 13352–13363 (2008). [DOI] [PubMed] [Google Scholar]
- 20.Lee J. K., Kim S., Nam H. G., Zare R. N., Microdroplet fusion mass spectrometry for fast reaction kinetics. Proc. Natl. Acad. Sci. U.S.A. 112, 3898–3903 (2015). [DOI] [PMC free article] [PubMed] [Google Scholar]
- 21.Lee J. K., Nam H. G., Zare R. N., Microdroplet fusion mass spectrometry: Accelerated kinetics of acid-induced chlorophyll demetallation. Q. Rev. Biophys. 50, e2 (2017). [DOI] [PMC free article] [PubMed] [Google Scholar]
- 22.Tang L., Kebarle P., Dependence of ion intensity in electrospray mass spectrometry on the concentration of the analytes in the electrosprayed solution. Anal. Chem. 65, 3654–3668 (1993). [Google Scholar]
- 23.Kathmann S. M., Kuo I. F. W., Mundy C. J., Electronic effects on the surface potential at the vapor−liquid interface of water. J. Am. Chem. Soc. 130, 16556–16561 (2008). Erratum in: J. Am. Chem. Soc.131, 17522 (2009). [DOI] [PubMed] [Google Scholar]
- 24.Wei H., et al. , Aerosol microdroplets exhibit a stable pH gradient. Proc. Natl. Acad. Sci. U.S.A. 115, 7272–7277 (2018). [DOI] [PMC free article] [PubMed] [Google Scholar]
- 25.Rivas L., et al. , Electric-field-induced redox potential shifts of tetraheme cytochromes c3 immobilized on self-assembled monolayers: Surface-enhanced resonance Raman spectroscopy and simulation studies. Biophys. J. 88, 4188–4199 (2005). [DOI] [PMC free article] [PubMed] [Google Scholar]
- 26.Zhong J., Kumar M., Francisco J. S., Zeng X. C., Insight into chemistry on cloud/aerosol water surfaces. Acc. Chem. Res. 51, 1229–1237 (2018). [DOI] [PubMed] [Google Scholar]
- 27.Kumar M., Zhong J., Zeng X. C., Francisco J. S., Reaction of Criegee intermediate with nitric acid at the air–water interface. J. Am. Chem. Soc. 140, 4913–4921 (2018). [DOI] [PubMed] [Google Scholar]
- 28.Kumar M., Li H., Zhang X., Zeng X. C., Francisco J. S., Nitric acid-amine chemistry in the gas phase and at the air-water interface. J. Am. Chem. Soc. 140, 6456–6466 (2018). [DOI] [PubMed] [Google Scholar]
- 29.Martins-Costa M. T., Anglada J. M., Francisco J. S., Ruiz-Lopez M. F., Reactivity of atmospherically relevant small radicals at the air-water interface. Angew. Chem. Int. Ed. Engl. 51, 5413–5417 (2012). [DOI] [PubMed] [Google Scholar]
- 30.Nam I., Lee J. K., Nam H. G., Zare R. N., Abiotic production of sugar phosphates and uridine ribonucleoside in aqueous microdroplets. Proc. Natl. Acad. Sci. U.S.A. 114, 12396–12400 (2017). [DOI] [PMC free article] [PubMed] [Google Scholar]
- 31.Floyd R. A., Henderson R., Watson J. J., Wong P. K., Use of salicylate with high pressure liquid chromatography and electrochemical detection (LCED) as a sensitive measure of hydroxyl free radicals in adriamycin treated rats. J. Free Radic. Biol. Med. 2, 13–18 (1986). [DOI] [PubMed] [Google Scholar]
- 32.Du S., Francisco J. S., Kais S., Study of electronic structure and dynamics of interacting free radicals influenced by water. J. Chem. Phys. 130, 124312 (2009). [DOI] [PubMed] [Google Scholar]
- 33.Gaiduk A. P., Pham T. A., Govoni M., Paesani F., Galli G., Electron affinity of liquid water. Nat. Commun. 9, 247 (2018). [DOI] [PMC free article] [PubMed] [Google Scholar]
- 34.Ben-Amotz D., Unveiling electron promiscuity. J. Phys. Chem. Lett. 2, 1216–1222 (2011). [DOI] [PubMed] [Google Scholar]
- 35.Deng Y., Zuo Y., Factors affecting the levels of hydrogen peroxide in rainwater. Atmos. Environ. 33, 1469–1478 (1999). [Google Scholar]
- 36.Scaramboni C., Crispim C., Toledo J. Jr, Campos M., Investigating hydrogen peroxide in rainwater of a typical midsized city in tropical Brazil using a novel application of a fluorometric method. Atmos. Environ. 176, 201–208 (2018). [Google Scholar]
- 37.Reeves C. E., Penkett S. A., Measurements of peroxides and what they tell us. Chem. Rev. 103, 5199–5218 (2003). [DOI] [PubMed] [Google Scholar]
Associated Data
This section collects any data citations, data availability statements, or supplementary materials included in this article.


