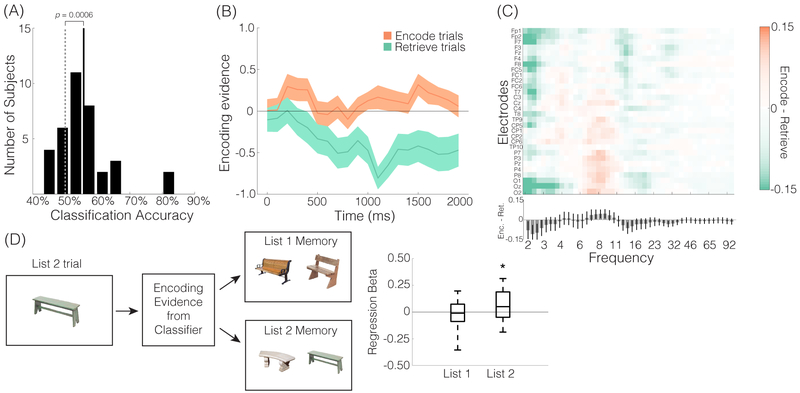
Figure 2. Decoding memory states.
(A) We trained subject-specific L2-logistic regression classifiers to discriminate encode vs. retrieve trials during List 2. The classifiers were trained and tested on average spectral power across the 0-2000 ms stimulus interval with all electrodes and frequencies used as features. Mean classification accuracy across all subjects (solid vertical line) is shown along with a histogram of mean classification accuracies for individual subjects (black bars) and mean classification accuracy for permuted data across all subjects (dashed vertical line). Mean classification accuracy for permuted data ranged from 49.79% to to 50.31% across individual subjects (1000 permutations per subject). (B) Time-course of encoding evidence across the 2000 ms stimulus interval (i.e., the time window when the object image was on screen). Here, the classifier was trained on the full 2000 ms interval, as described in (A), but tested on 100 ms time windows. (C) Mean spectrogram of differences in spectral power for encode vs. retrieve trials as a function of electrode (y-axis) and frequency (x-axis). Orange indicates greater power for encode trials, teal indicates greater power for retrieve trials. Spectrograms were generated for each subject and then averaged across subjects. Bar graph below the spectrogram illustrates the mean spectral difference, averaging across electrodes and then across subjects, between encode vs. retrieve trials at each frequency. Error bars denote SEM. (D) Subject-specific logistic regression analyses tested whether trial-level encoding evidence derived from the classifiers during List 2 predicted accuracy on the subsequent recognition memory test. Separate regressions were performed to predict memory for List 1 items and List 2 items. Box and whisker plots show a positive relationship between encoding evidence during List 2 trials and subsequent memory for List 2 items but no relationship between encoding evidence during List 2 trials and subsequent memory for List 1 items. * p < 0.05, ** p < 0.01

