Abstract
Multi-compartment tissue modeling using diffusion magnetic resonance imaging has proven valuable in the brain, offering novel indices sensitive to the tissue microstructural environment in vivo on clinical MRI scanners. However, application, characterization, and validation of these models in the spinal cord remain relatively under-studied. In this study, we apply a diffusion “signal” model (diffusion tensor imaging, DTI) and two commonly implemented “microstructural” models (neurite orientation dispersion and density imaging, NODDI; spherical mean technique, SMT) in the human cervical spinal cord of twenty-one healthy controls. We first provide normative values of DTI, SMT, and NODDI indices in a number of white matter ascending and descending pathways, as well as various gray matter regions. We then aim to validate the sensitivity and specificity of these diffusion-derived contrasts by relating these measures to indices of the tissue microenvironment provided by a histological template. We find that DTI indices are sensitive to a number of microstructural features, but lack specificity. The microstructural models also show sensitivity to a number of microstructure features; however, they do not capture the specific microstructural features explicitly modelled. Although often regarded as a simple extension of the brain in the central nervous system, it may be necessary to re-envision, or specifically adapt, diffusion microstructural models for application to the human spinal cord with clinically feasible acquisitions – specifically, adjusting, adapting, and re-validating the modeling as it relates to both theory (i.e. relevant biology, assumptions, and signal regimes) and parameter estimation (for example challenges of acquisition, artifacts, and processing).
Keywords: Spinal Cord, Diffusion MRI, microstructure, validation, multi-compartment model, signal model
1. Introduction
The spinal cord (SC) acts as the primary neurological signaling conduit between the brain and the extremities as well as interfacing with the peripheral nervous system, and performs primary functions such as conducting motor information to the extremities, relaying sensory information to the brain, acting as the center for controlling various autonomic reflexes, and is also responsible for generating complex patterns such as those involved in locomotion. The SC structure consists of a central, butterfly-shaped gray matter (GM) region composed of neuronal cell bodies, dendrites, and synapses, as well as surrounding white matter (WM) tissue composed of bundles of ascending and descending axons that convey the signals between the central and peripheral nervous systems. Both the SC WM and GM are known to exhibit a range of tissue microstructural environments, with relatively large variations in axon density, size, and myelination [1–4].
A number of neurodegenerative and immunological diseases, spinal cord pathologies, and traumatic or non-traumatic injuries can damage or affect these axons, resulting in motor and sensory deficits and a decreased quality of life. For example, inflammatory (multiple sclerosis (MS) [5, 6], transverse myelitis [7]), degenerative (amyotrophic lateral sclerosis [8], Friedreich’s ataxia [9, 10]), developmental (cerebral palsy [11, 12], spina bifida [13]), and orthopedic (stenosis [14]) disorders, as well as injury [15, 16] and tumors [17], are known to lead to changes in spinal cord microstructure, including demyelination, edema, axonal loss, reduced axon integrity, or axonal reorganization. Thus, characterizing the SC microstructure can serve an important role in diagnosis and prognosis of these pathologies, as well as lead to a better understanding of disease pathophysiology, functional impairment, or treatment efficacy.
Towards this end, non-invasive biomarkers based on quantitative magnetic resonance imaging (MRI) have shown potential for characterizing SC microstructure [18–27]. In particular, diffusion MRI (dMRI) shows promise for non-invasively characterizing tissue micro-environments. To date, the most readily available diffusion MRI technique (in both the brain and spinal cord) is diffusion tensor imaging (DTI) [28], which represents the diffusion of water in tissue as a 3D Gaussian distribution. DTI provides quantitative indices such as fractional anisotropy (FA), mean diffusivity (MD), axial diffusivity (AD), and radial diffusivity (RD) [29, 30] which have been shown to be sensitive to SC tissue properties [31–33], such as axon density, axonal injury, and degree of myelination. While DTI is sensitive to a number of microstructural features, it lacks the specificity to disentangle precise microstructural changes.
As an alternative to “signal” models (i.e., DTI), recent years have seen a proliferation of techniques - termed “microstructural” or “multi-compartment” models - which explicitly model certain aspects of the tissue environment [34–39]. Two of the more commonly implemented (and clinically feasible) microstructural models to date are the Neurite Orientation Dispersion and Density Imaging (NODDI) technique [40] and the Spherical Mean Technique (SMT) [41]. The NODDI model represents the signal in each voxel as the sum of three tissue compartments – intra-cellular, extra-cellular, and CSF compartments. The intra-cellular compartment is composed of neurites (modelled as zero-radius sticks) with a distribution of directions (i.e. a bipolar symmetric Watson distribution) that includes both an average direction and a spread of orientations around that direction. Thus, application of NODDI results in the isotropic (or CSF) volume fraction (FISO), the intra-cellular volume fraction (FICVF), and an orientation dispersion index (ODI) where a higher value represents a larger spread of axon orientations. SMT uses a two-compartment model that estimates microscopic features specific to the intra- and extra-neurite compartments un-confounded by the effects of fiber orientation and their distributions, by modelling the intra-neurite compartment as zero-radius sticks, and the extra-neurite tissue as a symmetric tensor. This technique results in an intra-neurite volume fraction (INTRA), a tissue intrinsic diffusivity (DIFF), and diffusivities of the (potentially) anisotropic extra-neurite compartment including its transverse microscopic diffusivity (EXTRA-TRANS) and mean diffusivity (EXTRA-MD).
Several microstructural models were originally applied to and validated within the spinal cord [37, 42, 43], due to its rather coherent white matter orientations, making it an ideal model for validation. However, many tissue models, including both NODDI and SMT, were developed for, and are largely applied to, the brain [44–55]. While application of multi-compartment models in the SC is limited, several studies have demonstrated feasibility and potential clinical utility of these techniques. For example, Grussu et al. [56] characterize WM and GM NODDI contrast, demonstrate superior fitting and reproducibility of NODDI metrics in comparison to DTI, and validate NODDI ODI index in characterizing MS lesions [57]. In parallel, By et al. [58] observed a decrease in FICVF in MS lesions and superior WM/GM contrast compared to DTI. Additionally, By et al. [59] implemented SMT in the same subjects, characterizing normal WM and GM indices, and demonstrating abnormal compartmental diffusivities in normal appearing WM of MS patients. Together, these studies suggest that the contrast provided by these models may offer useful, clinically feasible, outcomes that offer unique insight into the SC microstructure.
One limitation of clinically feasible diffusion microstructural modeling of the in vivo human SC is that currently they provide global characterization of WM and GM indices. However, these models have been unexplored in as to whether they provide contrast among the various SC pathways and regions where heterogeneous axonal environments are expected (we note several exceptions in animal models [37, 43] or using advanced hardware [60]). Thus, the first aim of the current study is to investigate WM and GM sub-regions of the SC and provide tissue- and column-specific normative values of both the signal models (DTI) and clinically achievable microstructural models (NODDI, SMT). We do this by analyzing twenty-one healthy subjects, in a standard space, and performing simple region-of-interest analysis. This aim is made possible by recent advancements in SC analysis and processing tools (i.e. the Spinal Cord Toolbox [61]) as well as the creation of a standard space SC atlas and templates [62] with integrated WM pathways and GM regions of interest (ROI).
While characterization of normative values is important, it is also necessary to properly validate potential biomarkers against ground truth measures of microstructure. Thus, our second aim is to validate sensitivity and specificity of these models. Validation can be performed against numerical or physical phantoms [63–68]; however, it is hard to replicate the enormous complexity and exact microstructural environments of the SC. Alternatively, comparisons against known anatomy (through histological analysis) can be made [52, 69–75], Knowledge about SC WM and GM composition is an accumulation of decades of research by neuroanatomists (see Saliani et al. for a review [1]). Most cyto- and myelo-architecture is described qualitatively, with microstructural metrics measured quantitatively in only specific tracts (most commonly the corticospinal and pyramidal tracts) and often using different methodologies – making comparisons across sub-regions difficult. However, recently Duval et al. [76] have imaged a fixed human spinal cord using high resolution scanning electron microscopy from C1 to L5 spinal levels, quantifying morphometric features across the entire cord (including both WM and GM) and essentially creating a “microstructural” template of the human spinal cord. Fortuitously, Duval et al [76], also register this to the same PAM50 template space in which we provide normative dMRI values, facilitating comparison of these values to expected trends observed in histological analysis.
This manuscript is organized as follows. We first describe methodologies related to image acquisition, processing, and alignment to standard space which facilitates quantification of dMRI-derived metrics in WM and GM, as well as in a number of SC sub-regions. We show qualitatively what these measures look like in the healthy human SC, and describe normative values in each ROI. Finally, we compare these measures to that expected from histological analysis and calculate correlation coefficients for all dMRI-estimated features against all histological microstructure features.
2. Methods
2.1. MRI experiments
Twenty-one healthy controls participated in this study. All experiments were performed on a 3.0T whole body MR scanner (Philips Achieva, Best, Netherlands). A two-channel body coil was used for excitation and a 16-channel SENSE neurovascular coil was used for reception. The maximum gradient strength of the system was 80 mT/m at a slew rate of 100 mT/m/s. All data were acquired under a protocol approved by the local institutional review board and signed, informed consent was obtained prior to the study.
For each subject, a high-resolution (0.65 × 0.65 × 5 mm3) multi-slice, multi-echo gradient echo (mFFE) anatomical image (Held et al., 2003) was acquired (TR/TE/ΔTE = 753/7.1/8.8 ms, α = 28°, number of slices = 14, 6:12 min) for co-registration and to serve as a reference image for segmentation. The diffusion sequence consisted of a cardiac-triggered (using a peripheral pulse oximeter with a delay set to 127ms), spin echo sequence with single-shot echo planar imaging (EPI) readout with the following parameters: TR/TE = 5 beats (~3000 ms)/65 ms, resolution = 1.25 × 1.25 mm2, slice thickness = 5 mm, FOV = 68 × 52 mm, SENSE (AP) = 1.5 and NEX = 3, number of slices ranged from 1-5 as the study progressed. Importantly, all images were centered on the C3 level and the middle slice of each was used for analysis. Reduced field-of-view was applied using an outer volume suppression technique [77] and fat suppression was achieved using SPIR. A multi-shell acquisition, similar to the previously published NODDI protocol in the brain [40] and the one implemented in the spinal cord [56] was used with uniform sampling: (i) b = 711 s/mm2 with 32 directions and (ii) b = 2855 s/ mm2 with 64 directions, with constant gradient times of Δ (separation between gradients) = 31.8 ms and δ (gradient duration) = 21.0 ms. A non-diffusion weighted scan (b = 0 s/mm2 or b0) was acquired with each shell. Total scan time was 18:11 min. Images were acquired in the axial plane for both the anatomical and diffusion images. SNR in the b0 images was found to be approximately 30 across the entire cord where noise was defined using the standard deviation of the difference of two measurements.
2.2. Image Processing and diffusion MRI-derived measures
A pipeline similar to the template-based analysis pipeline implemented in the SCT [61] was utilized. SCT diffusion MRI motion correction was performed [78], followed by registration of the b0 image to template space. Registration was assisted by segmentation of the spinal cord and vertebral labeling (i.e. designating that the slice is centered on C3) and performed in three steps: affine registration of the segmentation as initialization, affine registration of the b0 using a mean squares cost function, and finally a non-linear symmetric normalization algorithm. The resulting warp field was applied to all scalar quantitative diffusion MRI metrics (detailed below), resulting in all measures aligned with the PAM50 WM and GM labels, and the WM and GM tissue- and column-specific labels, as well as aligned with the histological template [76].
NODDI fitting was performed using the NODDI MATLAB Toolbox (https://www.nitrc.org/projects/noddi_toolbox). Diffusion coefficients for the intra-axonal and isotropic compartments were fixed with values of 1.7 μm2/ms and 3.0 μm2/ms respectively as in [40]. As described in the introduction, after fitting the derived NODDI indices included: the isotropic volume fraction (FISO) representing the fraction of free water such as CSF, the apparent intra-cellular volume fraction (FICVF) representing the fraction of dendrites and axons, and an orientation dispersion index (ODI) a measure of how axons disperse around a central orientation.
SMT fitting to the diffusion-weighted data was performed using C++ code provided by the authors of [41] (https://github.com/ekaden/smt). SMT fitting yielded maps of the apparent intra-axonal volume fraction (INTRA), the intrinsic diffusivity (DIFF), and the diffusivities associated with the extra-axonal compartment including the transverse (EXTRA-TRANS) and mean diffusivity (EXTRA-MD).
Finally, in contrast to microstructural models, the conventional DTI analysis (i.e. a signal model) was also performed using a non-linear fit in Camino utilizing both shells, resulting in fractional anisotropy (FA), mean diffusivity (MD), axial diffusivity (AD), and radial diffusivity (RD) indices.
2.3. Quantitative analysis
WM and GM comparison
To reproduce previous results characterizing indices over the full WM and GM ROIs, we calculated the medians of each derived index within both WM and GM. A nonparametric Wilcoxon rank sum test was performed for each index to probe statistically significant differences and discriminatory power of contrasts.
ROI-based normative values
To assess normative values in the tissue and column labels, we utilized those in the PAM50 template. In our data, this includes 33 labels (ROI names and abbreviations are given in the appendix), including 6 GM regions, 26 WM regions, and the CSF contour. For ease of visualization in boxplots, the WM can be hierarchically grouped into dorsal columns (4 labels), lateral funiculi (8 labels), and ventral funiculi (14 labels). We note that variations in microstructural environments are expected even within this hierarchical grouping.
Correlation with histological template
Finally, we related the median derived contrasts from DTI, NODDI, and SMT across all subjects to the ROI-median microstructural values provided in the histological template. The histological template includes axon diameter (μm), myelin volume fraction (%), axon volume fraction (%), the number of axons (axons/100μm2), and the density of axons (axons/100μm2) with a size range of 1-4μm and with a larger size of 4-8μm. Pearson’s linear correlation coefficients were determined between the diffusion-derived parameters and histological measures, with the two-tailed Student’s t-distribution used to determine statistical significance of correlations. We note that for extraction of ROI-based normative values and correlation of histological template a weighted average metric extraction [79] was utilized to attempt to account for possible partial volume effects, with similar (although not the same) results when using a simple binary average metric extraction.
3. Results
3.1. Anatomy and Template
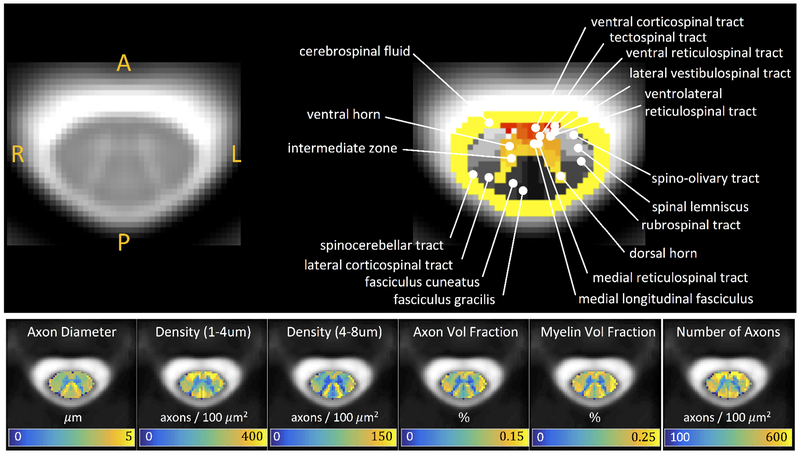
Figure 1 illustrates the ascending and descending WM pathways, as well as GM ROIs separated based on cytoarchitectural features, and is the standard diagram used to depict SC anatomy (figure illustrated by Frank H. Netter, and reproduced and adapted from Netter’s Atlas of Neuroscience, with permission from Elsevier). For comparison, Figure 2 (top) displays the T2* contrast from the SC template, as well as labels, which correspond well spatially to those from expected anatomy, although limited to a coarse spatial resolution defined by MRI.
Figure 1.
Spinal cord cross sectional anatomy. Illustration of the principal WM fiber tracts of the spinal cord (left) and GM ROIs and architectural features (right) are shown for a cross-section through the cord. Note that figure is only for educational purposes (and in our case, to orient reader to spinal cord anatomy) of white and gray matter regions and is not illustrative of one specific spinal cord level. Figures illustrated by Frank H. Netter, and reproduced and adapted from [111] with permission from Elsevier.
Figure 2.
PAM50 T2* template at the C3 vertebral level with WM pathways and GM subdivisions (top) and histological template of tissue microstructure indices (bottom). Note that histological indices were down-sampled to native atlas resolution.
Additionally, Figure 2 (bottom) displays the microstructural metrics extracted from the SEM-derived histological template. A delineation of WM and GM is clear, with GM consisting of microenvironments with smaller axon diameters, axon densities (of all sizes), axon volume fractions, and myelinated volume fractions. Notably, and as described by Duval et al. [76], several trends are also apparent across the WM pathways, revealing a somatotopic and/or functional organization [80]. For example, contrast between the fasciculus cuneatus and gracilis sensory axons originating from different parts of the body (i.e., arms and legs, respectively) [80] clearly shows an increased diameter, volume fraction, and myelin content of the cuneatus. Areas of high density small axons include many of the descending ventral funiculi (vCST, TST, vRST, IVST), while the spinocerebellar tract generally consists of large, myelinated axons. Thus, while not perfectly delineated by the atlas labels, key morphological differences are apparent.
3.2. Qualitative comparisons
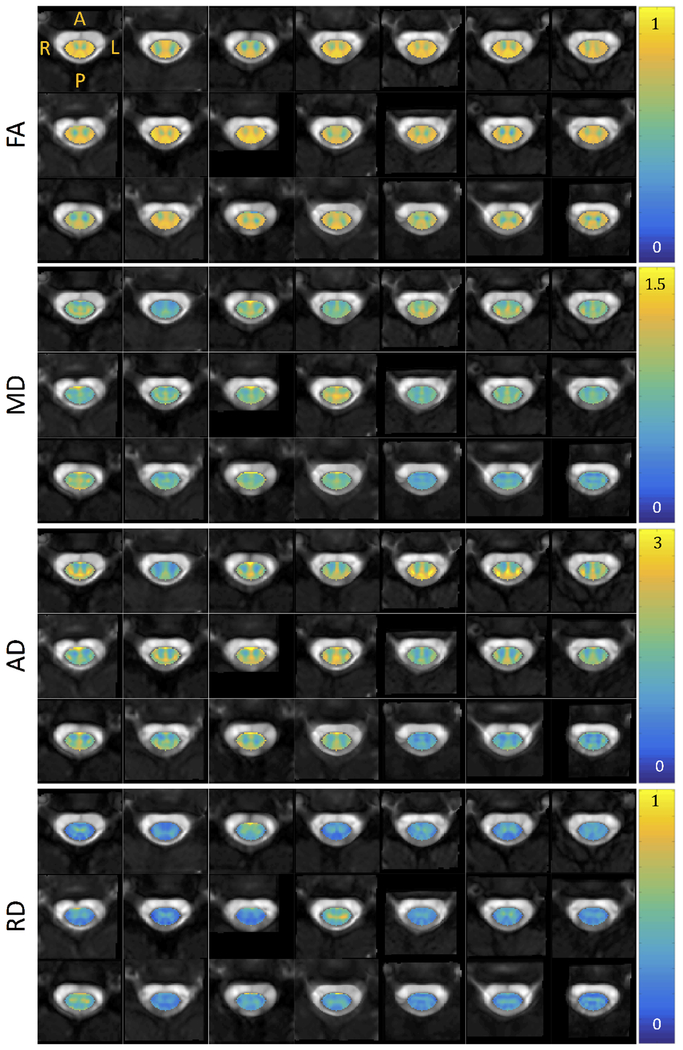
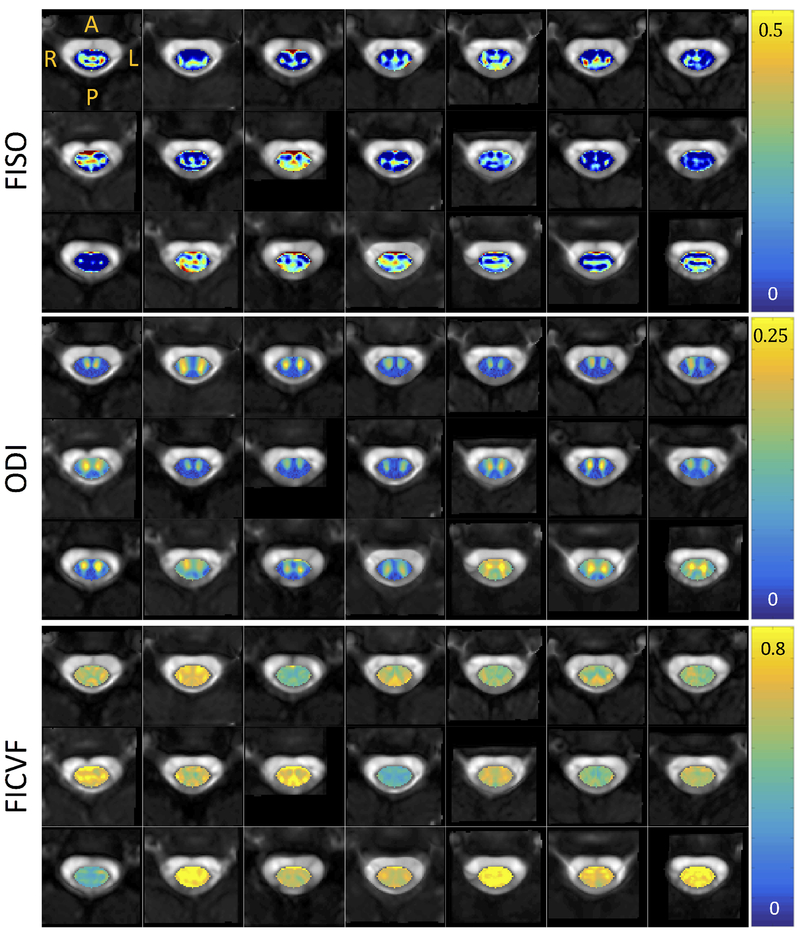
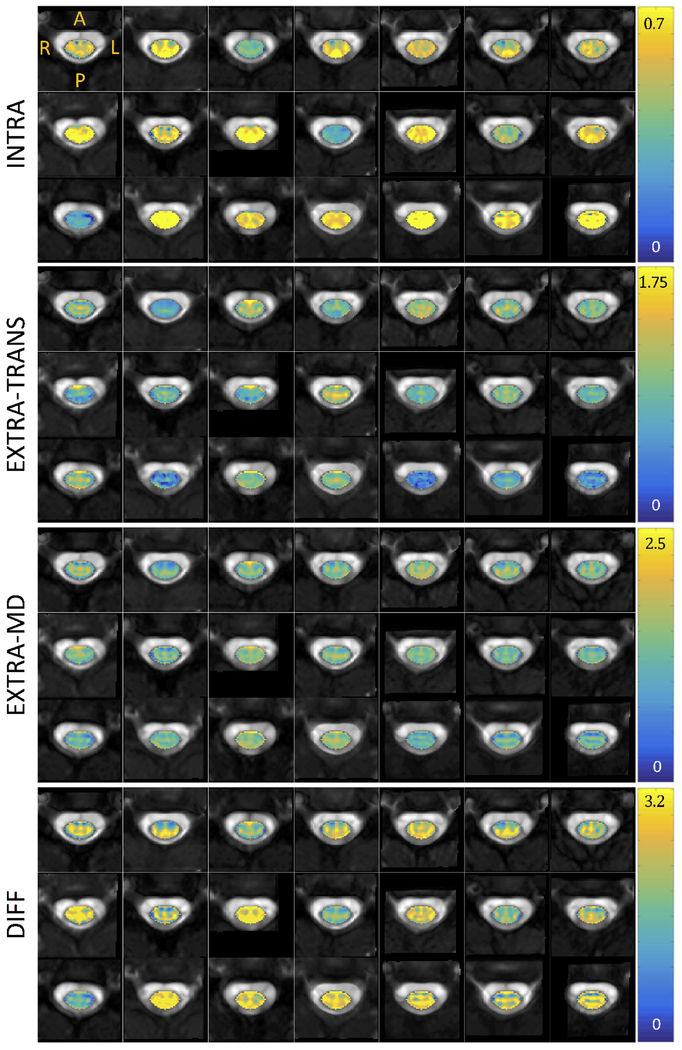
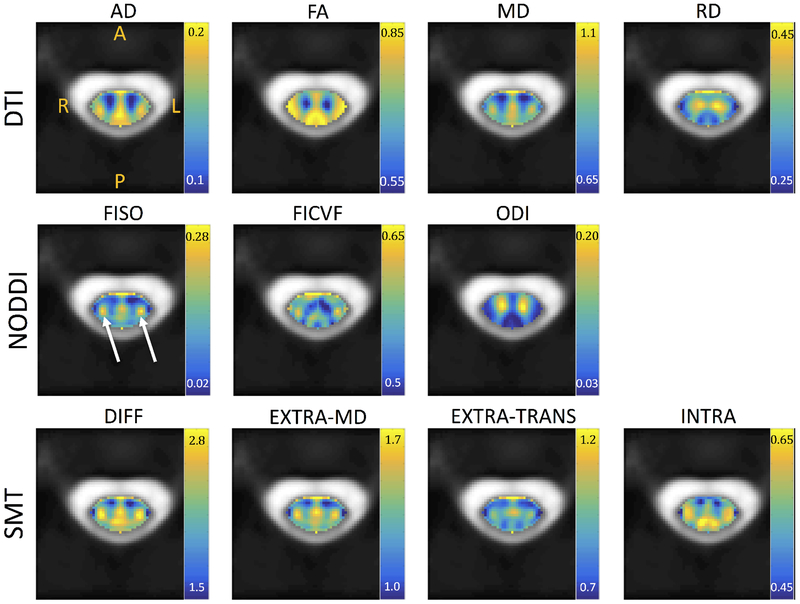
Figures 3, 4, and 5 show montage diffusion-derived maps for all 21 subjects for DTI, NODDI, and SMT, respectively. Note that the gray-scale background of each image is the individual subject’s non-diffusion weighted image, highlighting quality template normalization for all subjects. Most notable differences in contrast are observed between WM and GM, which are generally distinguishable in the DTI AD, FA, RD maps, the NODDI ODI map (which indicates high dispersion particularly in the ventral horns), and is somewhat distinguishable in the SMT DIFF and INTRA maps for several subjects. Interestingly, the DTI parametric maps are generally consistent across subjects, while there is some variation in scale and spatial patterns derived from the microstructural models.
Figure 3.
Montage of DTI metrics (fractional anisotropy, mean diffusivity, axial diffusivity, and radial diffusivity) for all subjects in atlas space. Diffusivity in units of 10−3 mm2/s. Note that each axial view corresponds to a different subject at the C3 vertebral level in atlas space.
Figure 4.
Montage of NODDI metrics (isotropic volume fraction, orientation dispersion index, intracellular volume fraction) for all subjects in atlas space. Note that each axial view corresponds to a different subject at the C3 vertebral level in atlas space.
Figure 5.
Montage of SMT metrics (intra-neurite volume fraction, extra-neurite transverse microscopic diffusivity, extra-neurite mean diffusivity, and tissue intrinsic diffusivity) for all subjects in atlas space. Diffusivity in units of 10−3 mm2/s. Note that each axial view corresponds to a different subject at the C3 vertebral level in atlas space.
3.3. Normative Values
The subject-averaged parametric maps in template space are shown in Figure 6. After averaging, spatial trends are apparent. DTI values tend to separate WM from GM. NODDI ODI clearly highlights the ventral horn and intermediate zones, and the dorsal horn to a lesser extent. FISO and FICVF show distinct patterns that do not necessarily follow the WM/GM boundaries. One clear feature near the left and right lateral corticospinal tracts is an increase in FISO and FICVF (white arrows). This unique, symmetrical feature is also apparent as high indices for all SMT metrics. SMT and NODDI qualitatively show similar boundaries or organization of spatial patterns, again not limited to highlighting WM/GM contrast.
Figure 6.
Metrics averaged over all subjects in atlas space. Diffusivity in units of 10−3 mm2/s.
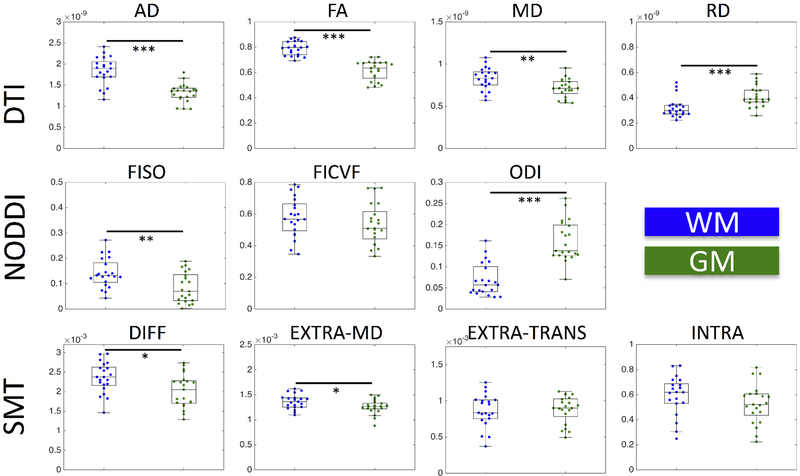
Quantitative WM and GM comparisons agree with qualitative results, as well as past quantitative SC diffusion studies [56, 58, 59, 81], with boxplots of the median value for all subjects shown in Figure 7. As in [56], DTI shows an increased AD, increased FA, increased MD, and decreased RD in WM compared to GM. Similarly, NODDI indicates a decreased ODI and increased FISO [56], although we found no significant difference in FICVF. A direct comparison with [59] is not possible because control WM was only compared to MS normal appearing WM, but we find significantly increased DIFF and EXTRA-MD in WM compared to GM.
Figure 7.
Medians of DTI, NODDI, and SMT metrics within WM (blue) and GM (green). Statistical significance is determined by a nonparametric Wilcoxon rank sum test and is indicated by asterisks (*p < 0.05; **p < 0.01; ***p < 0.001).
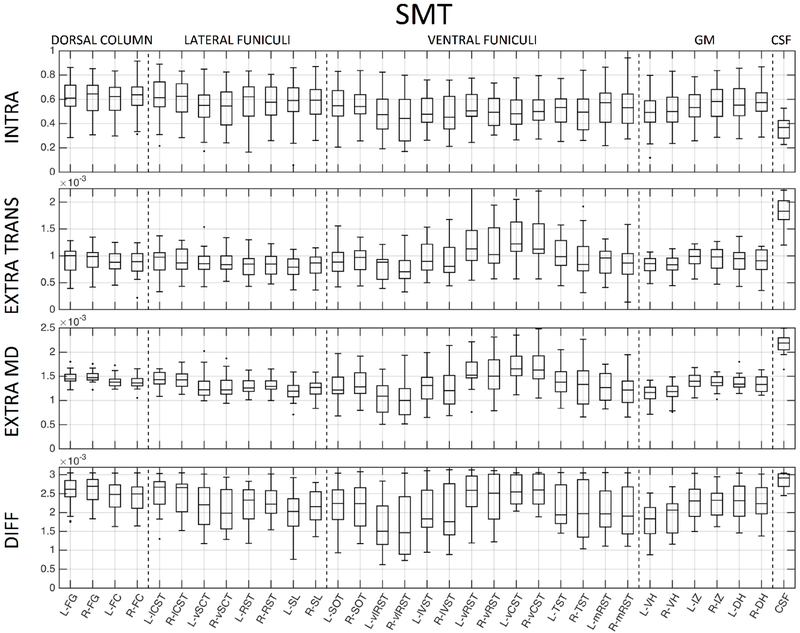
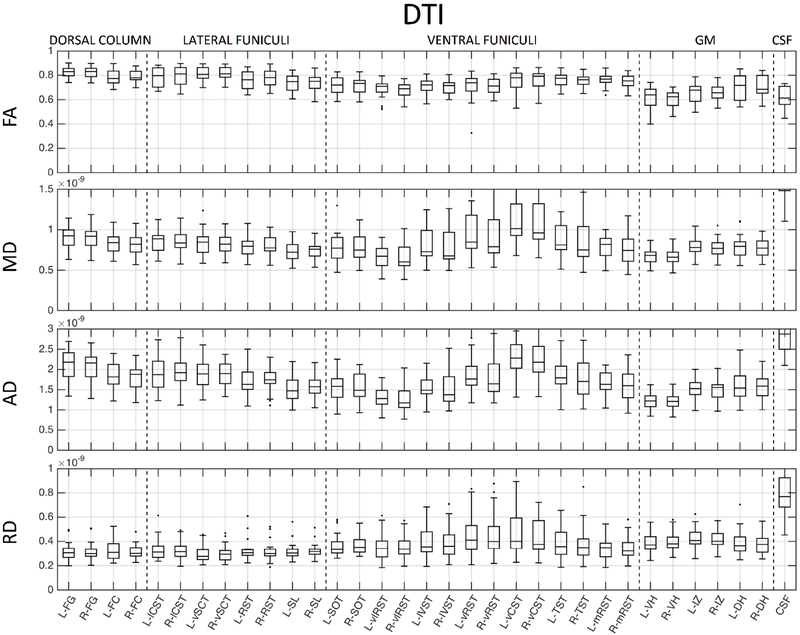
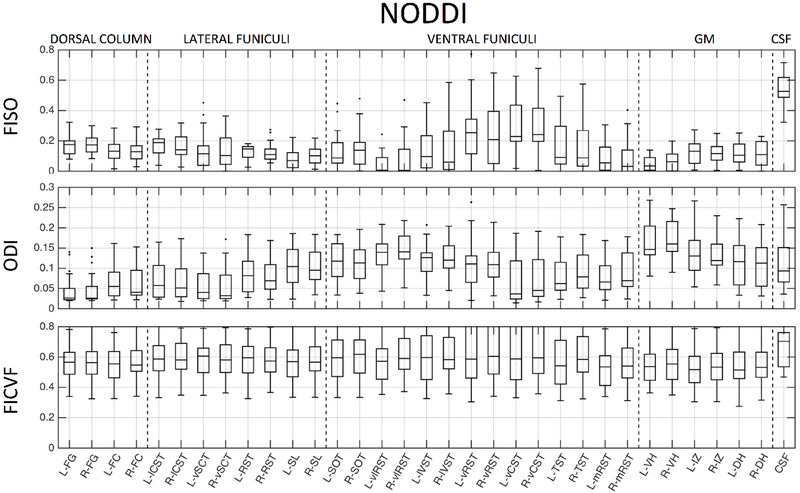
We next probe whether these metrics show contrast across heterogeneous WM pathways and GM sub-divisions. Figures 8, 9, and 10 show normative values over all subjects, across all 33 anatomical locations, for DTI, NODDI, and SMT, respectively. Note that vertical lines subdivide dorsal column labels, lateral funiculi, ventral funiculi, GM, and CSF for ease of viewing, although we may not expect the same values within or across regions. It is clear that there is significant variation across both WM and GM (and expected extreme values for CSF) for all metrics from all models. Inspection of inter-quartile range, which gives an indication of intersubject variability, indicates that DTI measures are more reproducible across subjects, while those of the more complex models generally show increased inter-subject variability. For all models, larger variation is observable in the ventral funiculi regions, which are generally smaller in size (i.e., prone to possible partial volume effects) than other white matter regions. We next ask whether these metrics follow expected histological trends.
Figure 8.
Normative DTI values, averaged across 21 healthy subjects, for 33 regions of interest. ROIs are subdivided with vertical lines (from left to right) into dorsal column labels, lateral funiculi, ventral funiculi, GM, and CSF.
Figure 9.
Normative NODDI values, averaged across 21 healthy subjects, for 33 regions of interest. ROIs are subdivided with vertical lines (from left to right) into dorsal column labels, lateral funiculi, ventral funiculi, GM, and CSF.
Figure 10.
Normative SMT values, averaged across 21 healthy subjects, for 33 regions of interest. ROIs are subdivided with vertical lines (from left to right) into dorsal column labels, lateral funiculi, ventral funiculi, GM, and CSF.
3.4. Comparisons and Correlations with histology
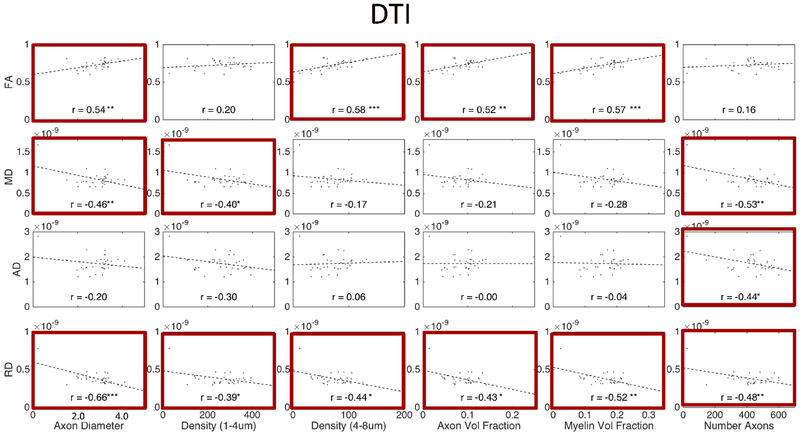
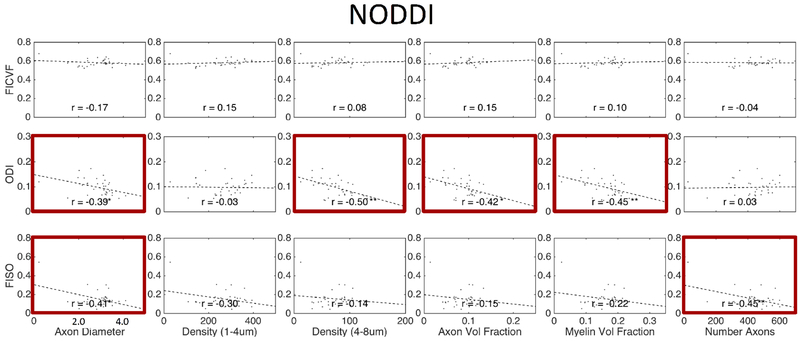
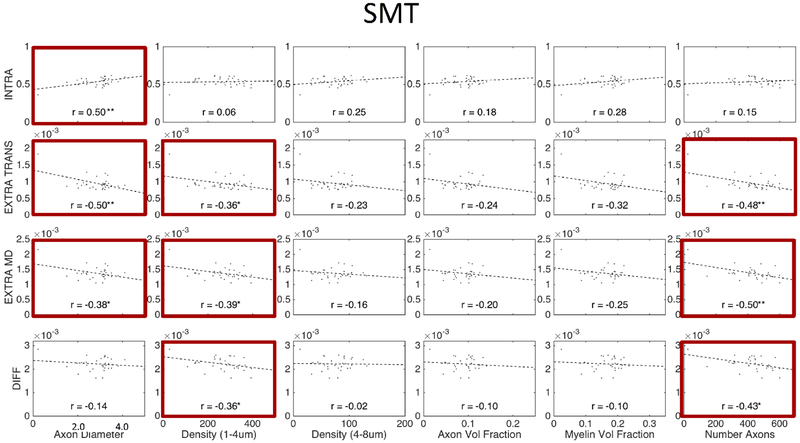
Figures 11, 12, and 13 show plots of the diffusion-derived indices plotted against histological measures for DTI, NODDI, and SMT, respectively. Correlation coefficients are indicated on each plot, with significance indicated by asterisks (and BOLD outline surrounding plot). We note that these plots include both WM and GM ROIs (they exclude CSF). Diffusion and histological correlations in WM only are given as supplementary Figures 1, 2, and 3 (for DTI, NODDI, and SMT, respectively) which indicate that some, but not all, of the correlations described below are driven by differences between WM and GM. Because these tissue and signal models estimate features that inherently exist in both white and gray matter (i.e., diffusivities, dispersion, and volume fractions), we chose to include the plots that validate microstructure of both tissue types in the main body of the manuscript.
Figure 11.
Correlation between expected histological indices and DTI-derived metrics. Linear correlation coefficient is indicated in each sub-plot and statistical significance indicated by asterisk (*p < 0.05; **p < 0.01; ***p < 0.001) and bold plot outline. Histology and diffusion values are median values from histological template and diffusion population average, respectively.
Figure 12.
Correlation between expected histological indices and NODDI-derived metrics. Linear correlation coefficient is indicated in each sub-plot and statistical significance indicated by asterisk (*p < 0.05; **p < 0.01; ***p < 0.001) ) and bold plot outline. Histology and diffusion values are median values from histological template and diffusion population average, respectively.
Figure 13.
Correlation between expected histological indices and SMT-derived metrics. Linear correlation coefficient is indicated in each sub-plot and statistical significance indicated by asterisk (*p < 0.05; **p < 0.01; ***p < 0.001) ) and bold plot outline. Histology and diffusion values are median values from histological template and diffusion population average, respectively.
As expected [31–33], DTI (Figure 11) is sensitive to nearly all microstructural features. For example, intuitively, RD decreases with an increased axonal volume fraction, increased axonal density (of all axons), and increased myelination, while FA increases under the same conditions. However, we note that most DTI correlations are driven by global differences in white and gray matter, rather than distinguishing white matter microstructure alone (see Supplementary Figure 1).
Similarly, NODDI (Figure 12) exhibited intuitive correlations. For example, isotropic volume fraction decreased with increasing densities of microstructural tissue (increasing densities, increasing axon and myelin volume fractions) although correlations were not as significant as DTI. However, FICVF, intended specifically to be a surrogate marker of axon volume fraction, did not significantly vary with this index. Additionally, ODI varied with diameter, density of larger axons, AVF and MVF, although none of these are measures of tissue orientation. Like DTI metrics, The FICVF and ODI trends described above are largely driven by the large dynamic range provided by including gray matter in the analysis (see Supplementary Figure 2)
SMT (Figure 13) showed most sensitivity to axonal diameter with an increasing diameter resulting in increased intracellular volume fraction and decrease extra-neurite diffusivities (similar trends are observed in WM analysis alone, although no longer statistically significant – see Supplementary Figure 3). While the intracellular volume fraction did positively correlate with the axon volume fraction, the correlation was small. Further, intracellular volume fraction and axon volume fraction correlation was non-existent when analyzing WM ROIs alone (Supplementary Figure 3).
Discussion
Often, in the diffusion literature, the spinal cord is assumed to be an extension of the brain, with a much-simplified geometry. In fact, due to its mostly parallel fiber orientations, it has served as the model of choice [82] for assessing anisotropy in the central nervous system [83, 84], demonstrating performance of microstructure or geometric models [42, 85], or studying diffusion time effects [86–89]. Here, however, we find that microstructural models created for the brain (and demonstrated to be quite useful for understanding normal and abnormal development and diseases) are not as strongly associated with the histological values they intend to recover (and sometimes explicitly model). In fact, the spinal cord may be one of the more simple neurological structures with which to validate models due to minimal confounds such as crossing fibers or large orientation dispersions yet has somatotopic organization. While this may seem like a relatively cynical view of these results, it is important to emphasize that these models still show strong sensitivity to various microstructural features relevant to a number of diseases and disorders, which have already proven to be potentially relevant markers of pathology [57]. Thus, although these “models” may not provide absolute interpretations of the tissue microstructure, they are still both practical and valuable [90]. However, it may be necessary to re-envision multi-compartment diffusion models and improved acquisitions for spinal cord architecture in order to exactly determine the tissue parameters of interest with high sensitivity and specificity.
For example, these models are not exempt from limiting assumptions and consequent biases. An example is the fixed diffusivity assumption and representation of distributions as a specific distribution in NODDI (both of which SMT is ideally unaffected by) [91], or the assumption of a discrete number of compartments (both studied models incorporate this, although others do not [92, 93]), or assumptions on diffusivity profiles or differences/similarities of intra and extra-cellular diffusivities [94]. Many of these assumptions can possibly be better adapted for the spinal cord. Possibly by utilizing prior knowledge of expected fiber orientation (at least in WM regions), largely parallel single fiber populations, or expected axonal diameters (which show greater variation of smaller spatial scales than that of the brain). Acquisition can additionally be optimized using similar prior information [95] (i.e. images acquired with diffusion weighting in the direction of axons are at or near the noise floor).
While the multi-compartment models show limited correlations with histology, the model itself may not be the sole source of the problem. Rather, the model in combination with analysis and acquisition may be the limiting factor. SC imaging is inherently noisy, susceptible to a number of artifacts, and a community consensus is lacking on acquisitions, analysis tools, and processing pipelines. Thus, partial-volume effects, subject-to-template registration, Gibbs ringing, susceptibility distortions, the relationship between cardiac triggering and CSF pulsation, and metric extraction all likely play a role in the limited microstructural sensiviity and specificity. However, our study was performed using a clinically acceptable acquisition (one which has been shown to be adequate for brain multi-compartment imaging) with preprocessing, processing, and analysis pipelines that are commonly applied (and are arguably the current state-of-the-art) in the in vivo human SC literature [16, 56, 58, 60–62, 79, 81, 96, 97]. Thus, there are limitations when using these multi-compartment models, in combination with standard clinical imaging protocols and open-sourced processing pipelines, and improvements in any or all of these areas are needed for accurate and precise SC tissue quantification in a clinically feasible scan. All aspects of the analysis should be carefully considered when designing diffusion studies of the cord, and we should be mindful of these potential shortcomings and how it affects what we study.
As described by Novikov et al. [90] modeling involves both theory and parameter estimation. In this study, while we cannot explicitly define the lack of sensitivity and specificity to either of these individually, our results suggest that “modeling” these microstructural measures (specifically axon volume fractio) in the spinal cord on clinical-quality datasets is not able to recover expected spatial trends in microstructure in the individual (or population averaged) cord. As described above, these limitations are likely a combination of both theory (i.e., the framework and assumptions of the model) and parameter estimation (inherently affected by image quality, image acquisition, and artifacts).
Although several tissue model parameters were indeed sensitive to microstructural indices, much of the strong correlation was driven by differences and the heteroscedasticity of variables between WM and GM. The variability between the two tissue types is greater than the variability between them, resulting in a large dynamic range (of both histology and diffusion metrics) and a strong correlation. However, within a tissue type (i.e., the WM), the variability between sub-regions is smaller than that detectable by the multi-compartment models and correlations are no longer apparent (see next paragraph on possible contributions to the low detectability of models in the SC). Although not broadly discussed, this is a common result in the literature. For example, when comparing an index between two populations (i.e., healthy and diseased) strong correlations may be present which are driven by the large dynamic range presented by the two populations together. This, in itself, doesn’t make the metric less valuable, as a strong effect size (i.e. Cohen’s d) can certainly result in a useful biomarker, even if biological interpretation is unclear or imprecise.
There are a number of modeling approaches and strategies not evaluated in this study due to relevant scan time or gradient strength limitations. For a time, spinal cord diffusion imaging was limited by motion, pulsatile flow artifacts, susceptibility artifacts, and the size of the cord [98] in addition to lack of SC specific tools for pre-processing. However, with advances in acquisition, tools [61], and templates [62], in parallel with advances in microscopy [76, 96], clinically feasible application and validation of these techniques is likely to increase in the future [37, 75, 99–103]. These may prove more sensitive to a number of indices.
Adding more contrasts, possibly in combination with diffusion data, may provide more sensitive and specific measures of SC microstructure. For example, magnetization transfer or quantitative magnetization transfer [18, 25, 104], g-ratio mapping [24, 105], or T1w/T2w imaging [106] may better quantify the myelin volume fraction (which diffusion is blind to) thereby improving estimates of the additional compartment sizes. Additionally, standard relaxometry [26, 27] can be combined with diffusion to gain insights into local tissue volumes or physiological environments. Finally, post-processing of diffusion data using fiber tractography may enable the ability to distinguish SC environments through tract density images [107], streamline clustering [108], or connectivity profiles [109]. As both diffusion and non-diffusion techniques become clinically viable, future in vivo human validation should be performed against prior anatomical knowledge or histological templates as in the current study.
Observations
While the brain and spinal cord share many of the same structures on the scale of microns (i.e. neurites, axons), they can vary dramatically in the scale of bundles of axons. For example, the pathways in the brain (e.g. the corpus callosum, internal capsule) can be as wide as multiple centimeters in diameter, whereas the entire spinal cord (and all associated pathways) is on the order of a single centimeter. Thus, the pathways we measure in this study are of a much finer scale than is typical in the brain. Although our in-plane resolution is higher than typical brain acquisitions (usually 2-2.5mm isotropic), many of the WM tracts analyzed occupy very few voxels (Figure 2), and partial volume effects are almost certain to occur (see Limitations section). Future microstructural models may incorporate not only multiple compartments with varying diffusivities, but multiple compartments of the same matter (i.e. multiple extracellular compartments) that also can vary in diffusivities.
Looking at the montage images (Figures 3–5) and subject-average templates (Figure 6) gives insight into potential limitations of some aspects of each model. DTI shows consistent indices, across all subjects, for all measures, and WM/GM boundaries are clearly delineated. These results are confirmed by significant differences in all metrics between WM and GM (Figure 7) for DTI. However, SMT and NODDI have some measures that vary greatly across subjects, in particular INTRA for SMT and FISO for NODDI. The FISO can possibly be explained by the fixed intrinsic diffusivity (which we see does indeed vary across and within subjects based on SMT DIFF values), causing estimates of FISO (which represents the compartment fraction with that fixed diffusivity) to increase/decrease unexpectedly. However, the other measures from these models show consistent patterns. Interestingly, these patterns do not always follow the WM/GM boundaries (with the exception of NODDI ODI). The templates show a unique “cheek-like” feature, near the left and right CST, which are expected to have high numbers of heavily myelinated large fibers (see Figure 2). Although boundaries between regions are not clearly delineated, there is the ability to distinguish some microstructural environments.
We anticipate that the normative values (Figures 8–10) should be useful when comparing healthy and patient populations as done for WM and GM in [58, 59]. Although not specific to any single microstructural environment, significant differences in quantitative metrics in specific tracts may provide more specific indices of disease progression or prognosis.
Correlations between histology and diffusion estimated microstructure provides insights into limitations of multi-compartment modeling. Most notably, the signal model (DTI) which makes no explicit assumptions on microstructure, showed strong correlations with all ground truth indices. The multi-compartment indices in which we expect strong correlations are the FICVF with the volume fraction of axons (r=−0.15) and INTRA with the same (r=0.18), both of which showed non-significant correlations. Additionally, although not direct measurements, we expect additional diffusion measures to be sensitive to several microstructural measures. For example, the extra-cellular diffusivities would intuitively be inversely related to the density, diameter, and number of axons (i.e. more, big axons result in less extra-neurite space with more restrictions). We did find these trends, although with limited statistical significance. One interesting observation was the strong correlations with ODI. Ideally, ODI would be independent of axons diameters and densities, and only dependent on orientation, however this was not the case. ODI decreased with increasing density and volume fraction, possibly due to a higher packing of parallel axons. The explanation for a decrease in ODI with increasing axon diameter requires further investigation.
Limitations
There are a number of limitations to the current study. Most importantly, the histological analysis and template is based on a single adult human SC, whereas we compare these measures to diffusion-based metrics from a population of 21 adults, making direct one-to-one comparisons impossible. However, we simply aim to ask whether the diffusion models show expected trends, or correlate well with known anatomy. It is important to point out that this single-subject histological template shows anatomical variation that agrees with decades of previously published histological literature in human and animal models [1]. Thus, rather than expect exact quantification or correlation, we also ask whether the diffusion contrasts allow identification or separation of the expected microstructural environments. The second limitation could occur in registration to template space. Diffusion MRI is inherently SNR-limited, and spatial alignment may not be exact for all subjects, contributing to intra-subject variability. Additionally, tools for spinal cord pre-processing, normalization, and analysis are lacking in comparison to those of the brain, although several strides have been made with atlases, templates, and normalization tools. However, mis-registration in combination with expected anatomical variation, could lead to lower correlation that expected. Qualitatively (see montage Figures 3–5), all subjects appear to be adequately registered and aligned. Third, there is inherent variability in the spinal cord imaging data, as expected in spinal cord diffusion imaging [56, 58, 59, 81, 110] – both due to noise and inherent inter-subject variations. This can cause possible inaccuracies in the derived metrics. As the imaging gets better, we expect accuracy and correlations to improve. Several experimental and design decisions could contribute to variability, including diffusion acquisition, registration algorithm utilized, metric extraction method, region of interest delineation. As discussed previously, the SC is composed of many small ROIs in both WM and GM, and partial volume effects contribute to both inter-subject variability and inter-ROI variability, particularly in small regions adjacent to the CSF.
Finally, the utilization of histology as a validation tool presents its own challenges, including choices of fixation procedures, myelin integrity preservation, staining limitations, and cutting/tissue preparation (see [76] for a full discussion of limitations related to the creation and quantification of the histological template). Together, these limitations may impact the magnitude and variance in all derived quantitative measures, as well as lead to biases (for example due to tissue shrinkage or lack of preservation). While biases and variation exist, the variation of microstructure within regions was shown to be less than that between regions (and less than that between various staining procedures) [76], and it is important to re-emphasize that our analysis (ie., correlation analysis) simply ask whether these tissue or signal models are able to allow identification and separation of the expected trends in microstructural environments.
Conclusion
In this study, we apply advanced quantitative diffusion microstructural models to the human cervical spinal cord. We provide normative values of DTI, SMT, and NODDI indices in a number of WM ascending and descending pathways, as well as various GM regions. We then relate these measures to indices of the tissue microenvironment provided by a histological template. We find that DTI indices are sensitive to a number of microstructural features, but lack specificity. The multi-compartment modeling strategies, while sensitive to a number of microstructural features, do not capture the appropriate specific microstructural environment that are explicitly modelled. Although often regarded as a simple extension of the brain in the CNS, it may be necessary to re-envision diffusion microstructural models, or rely on pure signal models, to provide microstructure-sensitive contrast in the human SC.
Supplementary Material
Acknowledgements
This work was supported by the National Institutes of health under award numbers R21 NS087465-01, R01 EY023240, R01EB017230 and T32EB001628, by the National Multiple Sclerosis Society award number RG-1501-02840, the Department of Defense award number W81XWH-13-0073, and in part by the National Center for Research Resources grant UL1 RR024975-0.
Abbreviations:
- SC
spinal cord
- GM
gray matter
- WM
white matter
- DTI
diffusion tensor imaging
- NODDI
neurite orientation dispersion and density imaging
- SMT
spherical mean technique
- CSF
cerebrospinal fluid
- FA
fractional anisotropy
- MD
mean diffusivity
- AD
axial diffusivity
- RD
radial diffusivity
- FISO
isotropic volume fraction
- FICVF
intra-cellular volume fraction
- ODI
orientation dispersion index
- INTRA
intra-neurite volume fraction
- DIFF
intrinsic diffusivity
- EXTRA-TRANS
extra-neurite transverse diffusivity
- EXTRA-MD
extra-neurite mean diffusivity
- ROI
regions of interest
Appendix A: Abbreviations
All regions of interest have both a left (L) and right (R) label.
FG: fasciculus gracilis; FC: fasciculus cuneatus; lCST: lateral corticospinal tract; vSCT: ventral spinocerebellar tract; RST: rubrospinal tract; SL: spinal lemniscus (spinothalamic and spinoreticular tracts); SOT: spino-olivary tract; vlRST: ventrolateral reticulospinal tract; lVST: lateral vestibulospinal tract; vRST: ventral reticulospinal tract; vCST: ventral corticospinal tract; TST: tectospinal tract; mRST: medial reticulospinal tract; DH: dorsal horn; IZ: intermediate zone; VH: ventral horn; CSF: CSF contour
Appendix B: Region grouping
WM dorsal column: FG, FC
WM lateral funiculi: lCST, vSCT, RST, SL
WM ventral funiculi: SOT, vlRST, lVST, vRST, vCST, TST, mRST
GM: VH, IZ, DH
CSF: CSF
Footnotes
Publisher's Disclaimer: This is a PDF file of an unedited manuscript that has been accepted for publication. As a service to our customers we are providing this early version of the manuscript. The manuscript will undergo copyediting, typesetting, and review of the resulting proof before it is published in its final citable form. Please note that during the production process errors may be discovered which could affect the content, and all legal disclaimers that apply to the journal pertain.
References
- [1].Saliani A, Perraud B, Duval T, Stikov N, Rossignol S, and Cohen-Adad J, “Axon and Myelin Morphology in Animal and Human Spinal Cord,” Front Neuroanat, vol. 11, p. 129, 2017, doi: 10.3389/fnana.2017.00129. [DOI] [PMC free article] [PubMed] [Google Scholar]
- [2].Felten DL, O’Banion MK, Maida MS, and Netter FH, Netter’s atlas of neuroscience, 3rd edition. ed. Philadelphia, PA: Elsevier, 2016, pp. xvii, 477 pages. [Google Scholar]
- [3].Carpenter MB, “Spinal cord: gross anatomy and internal structure,” in Core Text of Neuroanatomy, vol. 1 Baltimore, MD: Williams & Wilkins, 1991, pp. 57–82. [Google Scholar]
- [4].Carpenter MB, “Tracts of the spinal cord,” in Core Text of Neuroanatomy, vol. 1 Baltimore, MD: Williams & Wilkins, 1991, pp. 83–114. [Google Scholar]
- [5].Stadelmann C, “Multiple sclerosis as a neurodegenerative disease: pathology, mechanisms and therapeutic implications,” Current Opinion in Neurology, vol. 24, no. 3, pp. 224–229, 2011, doi: 10.1097/WCO.0b013e328346056f. [DOI] [PubMed] [Google Scholar]
- [6].De Santis S et al. , “Characterizing Microstructural Tissue Properties in Multiple Sclerosis with Diffusion MRI at 7T and 3T: The Impact of the Experimental Design,” Neuroscience, April 7 2018, doi: 10.1016/j.neuroscience.2018.03.048. [DOI] [PubMed] [Google Scholar]
- [7].Krishnan C, Kaplin AI, Pardo CA, Kerr DA, and Keswani SC, “Demyelinating disorders: update on transverse myelitis,” Curr Neurol Neurosci Rep, vol. 6, no. 3, pp. 236–43, May 2006. [DOI] [PubMed] [Google Scholar]
- [8].Kawamata T, Akiyama H, Yamada T, and McGeer PL, “Immunologic reactions in amyotrophic lateral sclerosis brain and spinal cord tissue,” The American journal of pathology, vol. 140, no. 3, pp. 691–707, March 1992. [PMC free article] [PubMed] [Google Scholar]
- [9].Chevis CF et al. , “Spinal cord atrophy correlates with disability in Friedreich’s ataxia,” Cerebellum, vol. 12, no. 1, pp. 43–7, February 2013, doi: 10.1007/s12311-012-0390-6. [DOI] [PubMed] [Google Scholar]
- [10].Mascalchi M, Salvi F, Piacentini S, and Bartolozzi C, “Friedreich’s ataxia: MR findings involving the cervical portion of the spinal cord,” AJR Am J Roentgenol, vol. 163, no. 1, pp. 187–91, July 1994, doi: 10.2214/ajr.163.1.8010211. [DOI] [PubMed] [Google Scholar]
- [11].Kuczynski AM et al. , “Corticospinal tract diffusion properties and robotic visually guided reaching in children with hemiparetic cerebral palsy,” Human brain mapping, November 29 2017, doi: 10.1002/hbm.23904. [DOI] [PMC free article] [PubMed] [Google Scholar]
- [12].Clowry GJ, “The dependence of spinal cord development on corticospinal input and its significance in understanding and treating spastic cerebral palsy,” Neurosci Biobehav Rev, vol. 31, no. 8, pp. 1114–24, 2007, doi: 10.1016/j.neubiorev.2007.04.007. [DOI] [PubMed] [Google Scholar]
- [13].Hasan KM, Eluvathingal TJ, Kramer LA, Ewing-Cobbs L, Dennis M, and Fletcher JM, “White matter microstructural abnormalities in children with spina bifida myelomeningocele and hydrocephalus: a diffusion tensor tractography study of the association pathways,” Journal of magnetic resonance imaging : JMRI, vol. 27, no. 4, pp. 700–9, April 2008, doi: 10.1002/jmri.21297. [DOI] [PMC free article] [PubMed] [Google Scholar]
- [14].Martin AR et al. , “Can microstructural MRI detect subclinical tissue injury in subjects with asymptomatic cervical spinal cord compression? A prospective cohort study,” BMJ Open, vol. 8, no. 4, p. e019809, 2018, doi: 10.1136/bmjopen-2017-019809. [DOI] [PMC free article] [PubMed] [Google Scholar]
- [15].Chen LM, Mishra A, Yang PF, Wang F, and Gore JC, “Injury alters intrinsic functional connectivity within the primate spinal cord,” Proceedings of the National Academy of Sciences of the United States of America, vol. 112, no. 19, pp. 5991–6, May 12 2015, doi: 10.1073/pnas.1424106112. [DOI] [PMC free article] [PubMed] [Google Scholar]
- [16].Guo Y et al. , “White matter microstructure alterations in patients with spinal cord injury assessed by diffusion tensor imaging,” Frontiers in Human Neuroscience, 2019, doi: 10.3389/fnhum.2019.00011. [DOI] [PMC free article] [PubMed] [Google Scholar]
- [17].Claus EB et al. , “Defining future directions in spinal cord tumor research: proceedings from the National Institutes of Health workshop,” J Neurosurg Spine, vol. 12, no. 2, pp. 117–21, February 2010, doi: 10.3171/2009.7.SPINE09137. [DOI] [PMC free article] [PubMed] [Google Scholar]
- [18].Smith AK, Dortch RD, Dethrage LM, and Smith SA, “Rapid, high-resolution quantitative magnetization transfer MRI of the human spinal cord,” NeuroImage, vol. 95, pp. 106–16, July 15 2014, doi: 10.1016/j.neuroimage.2014.03.005. [DOI] [PMC free article] [PubMed] [Google Scholar]
- [19].Lema A et al. , “A Comparison of Magnetization Transfer Methods to Assess Brain and Cervical Cord Microstructure in Multiple Sclerosis,” J Neuroimaging, vol. 27, no. 2, pp. 221–226, March 2017, doi: 10.1111/jon.12377. [DOI] [PubMed] [Google Scholar]
- [20].Levy S et al. , “Test-retest reliability of myelin imaging in the human spinal cord: Measurement errors versus region- and aging-induced variations,” PloS one, vol. 13, no. 1, p. e0189944, 2018, doi: 10.1371/journal.pone.0189944. [DOI] [PMC free article] [PubMed] [Google Scholar]
- [21].Battiston M et al. , “Fast and reproducible in vivo T1 mapping of the human cervical spinal cord,” Magnetic resonance in medicine : official journal of the Society of Magnetic Resonance in Medicine / Society of Magnetic Resonance in Medicine, vol. 79, no. 4, pp. 2142–2148, April 2018, doi: 10.1002/mrm.26852. [DOI] [PubMed] [Google Scholar]
- [22].Samson RS et al. , “Tissue- and column-specific measurements from multi-parameter mapping of the human cervical spinal cord at 3 T,” NMR in biomedicine, vol. 26, no. 12, pp. 1823–30, December 2013, doi: 10.1002/nbm.3022. [DOI] [PMC free article] [PubMed] [Google Scholar]
- [23].Ljungberg E et al. , “Rapid myelin water imaging in human cervical spinal cord,” Magnetic resonance in medicine : official journal of the Society of Magnetic Resonance in Medicine / Society of Magnetic Resonance in Medicine, vol. 78, no. 4, pp. 1482–1487, October 2017, doi: 10.1002/mrm.26551. [DOI] [PubMed] [Google Scholar]
- [24].Duval T et al. , “g-Ratio weighted imaging of the human spinal cord in vivo,” NeuroImage, vol. 145, no. Pt A, pp. 11–23, January 15 2017, doi: 10.1016/j.neuroimage.2016.09.018. [DOI] [PMC free article] [PubMed] [Google Scholar]
- [25].Dula AN, Gochberg DF, Valentine HL, Valentine WM, and Does MD, “Multiexponential T2, magnetization transfer, and quantitative histology in white matter tracts of rat spinal cord,” Magnetic resonance in medicine : official journal of the Society of Magnetic Resonance in Medicine / Society of Magnetic Resonance in Medicine, vol. 63, no. 4, pp. 902–9, April 2010, doi: 10.1002/mrm.22267. [DOI] [PMC free article] [PubMed] [Google Scholar]
- [26].Harkins KD, Dula AN, and Does MD, “Effect of intercompartmental water exchange on the apparent myelin water fraction in multiexponential T2 measurements of rat spinal cord,” Magnetic resonance in medicine : official journal of the Society of Magnetic Resonance in Medicine / Society of Magnetic Resonance in Medicine, vol. 67, no. 3, pp. 793–800, March 2012, doi: 10.1002/mrm.23053. [DOI] [PMC free article] [PubMed] [Google Scholar]
- [27].Harkins KD, Valentine WM, Gochberg DF, and Does MD, “In-vivo multi-exponential T2, magnetization transfer and quantitative histology in a rat model of intramyelinic edema,” Neuroimage Clin, vol. 2, pp. 810–7, 2013, doi: 10.1016/j.nicl.2013.06.007. [DOI] [PMC free article] [PubMed] [Google Scholar]
- [28].Basser PJ, Mattiello J, and LeBihan D, “Estimation of the effective self-diffusion tensor from the NMR spin echo,” Journal of magnetic resonance. Series B, vol. 103, no. 3, pp. 247–54, March 1994. [DOI] [PubMed] [Google Scholar]
- [29].Pierpaoli C, Jezzard P, Basser PJ, Barnett A, and Chiro GD, “Diffusion Tensor MR Imaging of the Human Brain,” Radiology, vol. 201, pp. 637–648, December 1996. 1996. [DOI] [PubMed] [Google Scholar]
- [30].Basser PJ and Pierpaoli C, “Microstructural and physiological features of tissues elucidated by quantitative-diffusion-tensor MRI,” (in eng), Journal of magnetic resonance. Series B, vol. 111, no. 3, pp. 209–19, June 1996. [DOI] [PubMed] [Google Scholar]
- [31].Budde MD, Xie M, Cross AH, and Song SK, “Axial diffusivity is the primary correlate of axonal injury in the experimental autoimmune encephalomyelitis spinal cord: a quantitative pixelwise analysis,” J Neurosci, vol. 29, no. 9, pp. 2805–13, March 4 2009, doi: 10.1523/JNEUROSCI.4605-08.2009. [DOI] [PMC free article] [PubMed] [Google Scholar]
- [32].Klawiter EC et al. , “Radial diffusivity predicts demyelination in ex vivo multiple sclerosis spinal cords,” NeuroImage, vol. 55, no. 4, pp. 1454–60, April 15 2011, doi: 10.1016/j.neuroimage.2011.01.007. [DOI] [PMC free article] [PubMed] [Google Scholar]
- [33].Song SK et al. , “Demyelination increases radial diffusivity in corpus callosum of mouse brain,” NeuroImage, vol. 26, no. 1, pp. 132–40, May 15 2005, doi: 10.1016/j.neuroimage.2005.01.028. [DOI] [PubMed] [Google Scholar]
- [34].Ferizi U et al. , “White matter compartment models for in vivo diffusion MRI at 300mT/m,” NeuroImage, vol. 118, pp. 468–83, September 2015, doi: 10.1016/j.neuroimage.2015.06.027. [DOI] [PubMed] [Google Scholar]
- [35].Panagiotaki E, Schneider T, Siow B, Hall MG, Lythgoe MF, and Alexander DC, “Compartment models of the diffusion MR signal in brain white matter: a taxonomy and comparison,” NeuroImage, vol. 59, no. 3, pp. 2241–54, February 1 2012, doi: 10.1016/j.neuroimage.2011.09.081. [DOI] [PubMed] [Google Scholar]
- [36].Assaf Y and Basser PJ, “Composite hindered and restricted model of diffusion (CHARMED) MR imaging of the human brain,” NeuroImage, vol. 27, no. 1, pp. 48–58, August 1 2005, doi: 10.1016/j.neuroimage.2005.03.042. [DOI] [PubMed] [Google Scholar]
- [37].Assaf Y, Blumenfeld-Katzir T, Yovel Y, and Basser PJ, “AxCaliber: a method for measuring axon diameter distribution from diffusion MRI,” Magnetic resonance in medicine : official journal of the Society of Magnetic Resonance in Medicine / Society of Magnetic Resonance in Medicine, vol. 59, no. 6, pp. 1347–54, June 2008, doi: 10.1002/mrm.21577. [DOI] [PMC free article] [PubMed] [Google Scholar]
- [38].Novikov DS, Fieremans E, Jespersen SN, and Kiselev VG, “Quantifying brain microstructure with diffusion MRI: Theory and parameter estimation,” NMR in biomedicine, p. e3998, October 15 2018, doi: 10.1002/nbm.3998. [DOI] [PMC free article] [PubMed] [Google Scholar]
- [39].Landman BA, Farrell JA, Smith SA, Reich DS, Calabresi PA, and van Zijl PC, “Complex geometric models of diffusion and relaxation in healthy and damaged white matter,” NMR in biomedicine, vol. 23, no. 2, pp. 152–62, February 2010, doi: 10.1002/nbm.1437. [DOI] [PMC free article] [PubMed] [Google Scholar]
- [40].Zhang H, Schneider T, Wheeler-Kingshott CA, and Alexander DC, “NODDI: practical in vivo neurite orientation dispersion and density imaging of the human brain,” NeuroImage, Research Support, Non-U.S. Gov’t vol. 61, no. 4, pp. 1000–16, July 16 2012, doi: 10.1016/j.neuroimage.2012.03.072. [DOI] [PubMed] [Google Scholar]
- [41].Kaden E, Kelm ND, Carson RP, Does MD, and Alexander DC, “Multi-compartment microscopic diffusion imaging,” NeuroImage, vol. 139, pp. 346–359, October 1 2016, doi: 10.1016/j.neuroimage.2016.06.002. [DOI] [PMC free article] [PubMed] [Google Scholar]
- [42].Assaf Y, Mayk A, and Cohen Y, “Displacement imaging of spinal cord using q-space diffusion-weighted MRI,” Magnetic resonance in medicine : official journal of the Society of Magnetic Resonance in Medicine / Society of Magnetic Resonance in Medicine, vol. 44, no. 5, pp. 713–22, November 2000. [DOI] [PubMed] [Google Scholar]
- [43].Ong HH and Wehrli FW, “Quantifying axon diameter and intra-cellular volume fraction in excised mouse spinal cord with q-space imaging,” (in eng), Neuroimage, vol. 51, no. 4, pp. 1360–6, July 2010, doi: 10.1016/j.neuroimage.2010.03.063. [DOI] [PMC free article] [PubMed] [Google Scholar]
- [44].Metzler-Baddeley C et al. , “Fornix white matter glia damage causes hippocampal gray matter damage during age-dependent limbic decline,” Sci Rep, vol. 9, no. 1, p. 1060, January 31 2019, doi: 10.1038/s41598-018-37658-5. [DOI] [PMC free article] [PubMed] [Google Scholar]
- [45].Li H, Chow HM, Chugani DC, and Chugani HT, “Linking spherical mean diffusion weighted signal with intra-axonal volume fraction,” Magnetic resonance imaging, vol. 57, pp. 75–82, April 2019, doi: 10.1016/j.mri.2018.11.006. [DOI] [PMC free article] [PubMed] [Google Scholar]
- [46].Pietsch M et al. , “A framework for multi-component analysis of diffusion MRI data over the neonatal period,” NeuroImage, vol. 186, pp. 321–337, February 1 2019, doi: 10.1016/j.neuroimage.2018.10.060. [DOI] [PMC free article] [PubMed] [Google Scholar]
- [47].Spano B et al. , “Disruption of neurite morphology parallels MS progression,” Neurol Neuroimmunol Neuroinflamm, vol. 5, no. 6, p. e502, November 2018, doi: 10.1212/NXI.0000000000000502. [DOI] [PMC free article] [PubMed] [Google Scholar]
- [48].Kadota Y et al. , “Differentiation between glioblastoma and solitary brain metastasis using neurite orientation dispersion and density imaging,” J Neuroradiol, November 12 2018, doi: 10.1016/j.neurad.2018.10.005. [DOI] [PubMed] [Google Scholar]
- [49].Masjoodi S, Hashemi H, Oghabian MA, and Sharifi G, “Differentiation of Edematous, Tumoral and Normal Areas of Brain Using Diffusion Tensor and Neurite Orientation Dispersion and Density Imaging,” J Biomed Phys Eng, vol. 8, no. 3, pp. 251–260, September 2018. [PMC free article] [PubMed] [Google Scholar]
- [50].Sone D, Sato N, Ota M, Maikusa N, Kimura Y, and Matsuda H, “Abnormal neurite density and orientation dispersion in unilateral temporal lobe epilepsy detected by advanced diffusion imaging,” Neuroimage Clin, vol. 20, pp. 772–782, 2018, doi: 10.1016/j.nicl.2018.09.017. [DOI] [PMC free article] [PubMed] [Google Scholar]
- [51].Araque Caballero MA et al. , “White matter diffusion alterations precede symptom onset in autosomal dominant Alzheimer’s disease,” Brain, vol. 141, no. 10, pp. 3065–080, October 1 2018, doi: 10.1093/brain/awy229. [DOI] [PMC free article] [PubMed] [Google Scholar]
- [52].Schilling KG, Janve V, Gao Y, Stepniewska I, Landman BA, and Anderson AW, “Histological validation of diffusion MRI fiber orientation distributions and dispersion,” NeuroImage, vol. 165, pp. 200–221, January 15 2018, doi: 10.1016/j.neuroimage.2017.10.046. [DOI] [PMC free article] [PubMed] [Google Scholar]
- [53].Parvathaneni P et al. , “Empirical reproducibility, sensitivity, and optimization of acquisition protocol, for Neurite Orientation Dispersion and Density Imaging using AMICO,” Magnetic resonance imaging, vol. 50, pp. 96–109, July 2018, doi: 10.1016/j.mri.2018.03.004. [DOI] [PMC free article] [PubMed] [Google Scholar]
- [54].Li H, Chow HM, Chugani DC, and Chugani HT, “Minimal number of gradient directions for robust measurement of spherical mean diffusion weighted signal,” Magnetic resonance imaging, vol. 54, pp. 148–152, December 2018, doi: 10.1016/j.mri.2018.08.020. [DOI] [PMC free article] [PubMed] [Google Scholar]
- [55].Kamiya K et al. , “Diffusional kurtosis imaging and white matter microstructure modeling in a clinical study of major depressive disorder,” NMR in biomedicine, vol. 31, no. 7, p. e3938, July 2018, doi: 10.1002/nbm.3938. [DOI] [PMC free article] [PubMed] [Google Scholar]
- [56].Grussu F, Schneider T, Zhang H, Alexander DC, and Wheeler-Kingshott CA, “Neurite orientation dispersion and density imaging of the healthy cervical spinal cord in vivo,” NeuroImage, vol. 111, pp. 590–601, May 1 2015, doi: 10.1016/j.neuroimage.2015.01.045. [DOI] [PubMed] [Google Scholar]
- [57].Grussu F et al. , “Neurite dispersion: a new marker of multiple sclerosis spinal cord pathology?,” Ann Clin Transl Neurol, vol. 4, no. 9, pp. 663–679, September 2017, doi: 10.1002/acn3.445. [DOI] [PMC free article] [PubMed] [Google Scholar]
- [58].By S, Xu J, Box BA, Bagnato FR, and Smith SA, “Application and evaluation of NODDI in the cervical spinal cord of multiple sclerosis patients,” Neuroimage Clin, vol. 15, pp. 333–342, 2017, doi: 10.1016/j.nicl.2017.05.010. [DOI] [PMC free article] [PubMed] [Google Scholar]
- [59].By S, Xu J, Box BA, Bagnato FR, and Smith SA, “Multi-compartmental diffusion characterization of the human cervical spinal cord in vivo using the spherical mean technique,” NMR in biomedicine, vol. 31, no. 4, p. e3894, April 2018, doi: 10.1002/nbm.3894. [DOI] [PMC free article] [PubMed] [Google Scholar]
- [60].Duval T et al. , “In vivo mapping of human spinal cord microstructure at 300mT/m,” (in eng), Neuroimage, vol. 118, pp. 494–507, September 2015, doi: 10.1016/j.neuroimage.2015.06.038. [DOI] [PMC free article] [PubMed] [Google Scholar]
- [61].De Leener B et al. , “SCT: Spinal Cord Toolbox, an open-source software for processing spinal cord MRI data,” NeuroImage, vol. 145, no. Pt A, pp. 24–43, January 15 2017, doi: 10.1016/j.neuroimage.2016.10.009. [DOI] [PubMed] [Google Scholar]
- [62].De Leener B, Fonov VS, Collins DL, Callot V, Stikov N, and Cohen-Adad J, “PAM50: Unbiased multimodal template of the brainstem and spinal cord aligned with the ICBM152 space,” NeuroImage, vol. 165, pp. 170–179, January 15 2018, doi: 10.1016/j.neuroimage.2017.10.041. [DOI] [PubMed] [Google Scholar]
- [63].Dyrby TB, Innocenti G, Bech M, and Lundell H, “Validation strategies for the interpretation of microstructure imaging using diffusion MRI,” NeuroImage, June 16 2018, doi: 10.1016/j.neuroimage.2018.06.049. [DOI] [PubMed] [Google Scholar]
- [64].Fan Q et al. , “Validation of diffusion MRI estimates of compartment size and volume fraction in a biomimetic brain phantom using a human MRI scanner with 300mT/m maximum gradient strength,” NeuroImage, January 12 2018, doi: 10.1016/j.neuroimage.2018.01.004. [DOI] [PMC free article] [PubMed] [Google Scholar]
- [65].Schilling KG et al. , “Limits to anatomical accuracy of diffusion tractography using modern approaches,” NeuroImage, vol. 185, pp. 1–11, October 11 2018, doi: 10.1016/j.neuroimage.2018.10.029. [DOI] [PMC free article] [PubMed] [Google Scholar]
- [66].Hubbard PL, Zhou FL, Eichhorn SJ, and Parker GJ, “Biomimetic phantom for the validation of diffusion magnetic resonance imaging,” Magnetic resonance in medicine : official journal of the Society of Magnetic Resonance in Medicine / Society of Magnetic Resonance in Medicine, January 27 2014, doi: 10.1002/mrm.25107. [DOI] [PubMed] [Google Scholar]
- [67].Fieremans E and Lee HH, “Physical and numerical phantoms for the validation of brain microstructural MRI: A cookbook,” NeuroImage, June 18 2018, doi: 10.1016/j.neuroimage.2018.06.046. [DOI] [PMC free article] [PubMed] [Google Scholar]
- [68].Fieremans E, De Deene Y, Delputte S, Ozdemir MS, Achten E, and Lemahieu I, “The design of anisotropic diffusion phantoms for the validation of diffusion weighted magnetic resonance imaging,” Phys Med Biol, vol. 53, no. 19, pp. 5405–19, October 7 2008, doi: 10.1088/0031-9155/53/19/009. [DOI] [PubMed] [Google Scholar]
- [69].Schilling K, Janve V, Gao Y, Stepniewska I, Landman BA, and Anderson AW, “Comparison of 3D orientation distribution functions measured with confocal microscopy and diffusion MRI,” NeuroImage, vol. 129, pp. 185–97, April 1 2016, doi: 10.1016/j.neuroimage.2016.01.022. [DOI] [PMC free article] [PubMed] [Google Scholar]
- [70].Seehaus A et al. , “Histological validation of high-resolution DTI in human post mortem tissue,” Front Neuroanat, vol. 9, p. 98, 2015, doi: 10.3389/fnana.2015.00098. [DOI] [PMC free article] [PubMed] [Google Scholar]
- [71].Budde MD and Annese J, “Quantification of anisotropy and fiber orientation in human brain histological sections,” Front Integr Neurosci, vol. 7, p. 3, 2013, doi: 10.3389/fnint.2013.00003. [DOI] [PMC free article] [PubMed] [Google Scholar]
- [72].Budde MD and Frank JA, “Examining brain microstructure using structure tensor analysis of histological sections,” NeuroImage, Research Support, N.I.H., Intramural Research Support, Non-U.S. Gov’t vol. 63, no. 1, pp. 1–10, October 15 2012, doi: 10.1016/j.neuroimage.2012.06.042. [DOI] [PubMed] [Google Scholar]
- [73].Leergaard TB et al. , “Quantitative histological validation of diffusion MRI fiber orientation distributions in the rat brain,” PloS one, vol. 5, no. 1, p. e8595, 2010, doi: 10.1371/journal.pone.0008595. [DOI] [PMC free article] [PubMed] [Google Scholar]
- [74].Dyrby TB, Sogaard LV, Hall MG, Ptito M, and Alexander DC, “Contrast and stability of the axon diameter index from microstructure imaging with diffusion MRI,” Magnetic resonance in medicine : official journal of the Society of Magnetic Resonance in Medicine / Society of Magnetic Resonance in Medicine, September 28 2012, doi: 10.1002/mrm.24501. [DOI] [PMC free article] [PubMed] [Google Scholar]
- [75].Alexander DC et al. , “Orientationally invariant indices of axon diameter and density from diffusion MRI,” NeuroImage, vol. 52, no. 4, pp. 1374–89, October 1 2010, doi: 10.1016/j.neuroimage.2010.05.043. [DOI] [PubMed] [Google Scholar]
- [76].Duval T et al. , “Axons morphometry in the human spinal cord,” NeuroImage, vol. 185, pp. 119–128, January 15 2019, doi: 10.1016/j.neuroimage.2018.10.033. [DOI] [PubMed] [Google Scholar]
- [77].Wilm BJ, Svensson J, Henning A, Pruessmann KP, Boesiger P, and Kollias SS, “Reduced field-of-view MRI using outer volume suppression for spinal cord diffusion imaging,” Magnetic resonance in medicine : official journal of the Society of Magnetic Resonance in Medicine /Society of Magnetic Resonance in Medicine, vol. 57, no. 3, pp. 625–30, March 2007, doi: 10.1002/mrm.21167. [DOI] [PubMed] [Google Scholar]
- [78].Xu J et al. , “Improved in vivo diffusion tensor imaging of human cervical spinal cord,” NeuroImage, vol. 67, pp. 64–76, February 15 2013, doi: 10.1016/j.neuroimage.2012.11.014. [DOI] [PMC free article] [PubMed] [Google Scholar]
- [79].Lévy S, Benhamou M, Naaman C, Rainville P, Callot V, and Cohen-Adad J, “White matter atlas of the human spinal cord with estimation of partial volume effect,” (in eng), Neuroimage, vol. 119, pp. 262–71, October 2015, doi: 10.1016/j.neuroimage.2015.06.040. [DOI] [PubMed] [Google Scholar]
- [80].Niu J et al. , “Modality-based organization of ascending somatosensory axons in the direct dorsal column pathway,” (in eng), J Neurosci, vol. 33, no. 45, pp. 17691–709, November 2013, doi: 10.1523/JNEUROSCI.3429-13.2013. [DOI] [PMC free article] [PubMed] [Google Scholar]
- [81].By S et al. , “Quantifying the impact of underlying measurement error on cervical spinal cord diffusion tensor imaging at 3T,” Journal of magnetic resonance imaging : JMRI, vol. 44, no. 6, pp. 1608–1618, December 2016, doi: 10.1002/jmri.25308. [DOI] [PMC free article] [PubMed] [Google Scholar]
- [82].Jelescu IO and Budde MD, “Design and validation of diffusion MRI models of white matter,” Front Phys, vol. 28, November 2017, doi: 10.3389/fphy.2017.00061. [DOI] [PMC free article] [PubMed] [Google Scholar]
- [83].Schwartz ED et al. , “MRI diffusion coefficients in spinal cord correlate with axon morphometry,” Neuroreport, vol. 16, no. 1, pp. 73–6, January 19 2005. [DOI] [PubMed] [Google Scholar]
- [84].DeBoy CA et al. , “High resolution diffusion tensor imaging of axonal damage in focal inflammatory and demyelinating lesions in rat spinal cord,” Brain, vol. 130, no. Pt 8, pp. 2199–210, August 2007, doi: 10.1093/brain/awm122. [DOI] [PubMed] [Google Scholar]
- [85].Skinner NP, Kurpad SN, Schmit BD, Tugan Muftuler L, and Budde MD, “Rapid in vivo detection of rat spinal cord injury with double-diffusion-encoded magnetic resonance spectroscopy,” Magnetic resonance in medicine : official journal of the Society of Magnetic Resonance in Medicine / Society of Magnetic Resonance in Medicine, vol. 77, no. 4, pp. 1639–1649, April 2017, doi: 10.1002/mrm.26243. [DOI] [PMC free article] [PubMed] [Google Scholar]
- [86].Nossin-Manor R, Duvdevani R, and Cohen Y, “q-Space high b value diffusion MRI of hemi-crush in rat spinal cord: evidence for spontaneous regeneration,” Magnetic resonance imaging, vol. 20, no. 3, pp. 231–41, April 2002. [DOI] [PubMed] [Google Scholar]
- [87].Biton IE, Duncan ID, and Cohen Y, “q-Space diffusion of myelin-deficient spinal cords,” Magnetic resonance in medicine : official journal of the Society of Magnetic Resonance in Medicine / Society of Magnetic Resonance in Medicine, vol. 58, no. 5, pp. 993–1000, November 2007, doi: 10.1002/mrm.21389. [DOI] [PubMed] [Google Scholar]
- [88].Biton IE, Duncan ID, and Cohen Y, “High b-value q-space diffusion MRI in myelin-deficient rat spinal cords,” Magnetic resonance imaging, vol. 24, no. 2, pp. 161–6, February 2006, doi: 10.1016/j.mri.2005.10.029. [DOI] [PubMed] [Google Scholar]
- [89].Jespersen SN, Olesen JL, Hansen B, and Shemesh N, “Diffusion time dependence of microstructural parameters in fixed spinal cord,” NeuroImage, vol. 182, pp. 329–342, November 15 2018, doi: 10.1016/j.neuroimage.2017.08.039. [DOI] [PMC free article] [PubMed] [Google Scholar]
- [90].Novikov DS, Kiselev VG, and Jespersen SN, “On modeling,” Magnetic resonance in medicine : official journal of the Society of Magnetic Resonance in Medicine / Society of Magnetic Resonance in Medicine, vol. 79, no. 6, pp. 3172–3193, June 2018, doi: 10.1002/mrm.27101. [DOI] [PMC free article] [PubMed] [Google Scholar]
- [91].Jelescu IO, Veraart J, Adisetiyo V, Milla SS, Novikov DS, and Fieremans E, “One diffusion acquisition and different white matter models: how does microstructure change in human early development based on WMTI and NODDI?,” NeuroImage, vol. 107, pp. 242–256, February 15 2015, doi: 10.1016/j.neuroimage.2014.12.009. [DOI] [PMC free article] [PubMed] [Google Scholar]
- [92].Wang Y et al. , “Quantification of increased cellularity during inflammatory demyelination,” Brain, vol. 134, no. Pt 12, pp. 3590–601, December 2011, doi: 10.1093/brain/awr307. [DOI] [PMC free article] [PubMed] [Google Scholar]
- [93].Scherrer B, Schwartzman A, Taquet M, Sahin M, Prabhu SP, and Warfield SK, “Characterizing brain tissue by assessment of the distribution of anisotropic microstructural environments in diffusion-compartment imaging (DIAMOND),” Magnetic resonance in medicine : official journal of the Society of Magnetic Resonance in Medicine / Society of Magnetic Resonance in Medicine, vol. 76, no. 3, pp. 963–77, September 2016, doi: 10.1002/mrm.25912. [DOI] [PMC free article] [PubMed] [Google Scholar]
- [94].Lee H-H, Fieremans E, and Novikov DS, “What dominates the time dependence of diffusion transverse to axons: Intra- or extra-axonal water?,” NeuroImage, vol. 182, pp. 500–510, 2018/November/15/ 2018, doi: 10.1016/j.neuroimage.2017.12.038. [DOI] [PMC free article] [PubMed] [Google Scholar]
- [95].Schilling K et al. , “Anatomically-informed and patient-specific diffusion tensor sampling schemes for the cervical spinal cord,” in Proceedings of the International Society of Magnetic Resonance in Medicine, 26, Paris, France, 2018. [Google Scholar]
- [96].Cohen-Adad J, “Microstructural imaging in the spinal cord and validation strategies,” NeuroImage, vol. 182, pp. 169–183, November 15 2018, doi: 10.1016/j.neuroimage.2018.04.009. [DOI] [PubMed] [Google Scholar]
- [97].Grussu F et al. , “A framework for optimal whole-sample histological quantification of neurite orientation dispersion in the human spinal cord,” (in eng), J Neurosci Methods, vol. 273, pp. 20–32, 11 2016, doi: 10.1016/j.jneumeth.2016.08.002. [DOI] [PubMed] [Google Scholar]
- [98].Wheeler-Kingshott CA et al. , “Investigating cervical spinal cord structure using axial diffusion tensor imaging,” NeuroImage, vol. 16, no. 1, pp. 93–102, May 2002, doi: 10.1006/nimg.2001.1022. [DOI] [PubMed] [Google Scholar]
- [99].Benjamini D, Komlosh ME, Holtzclaw LA, Nevo U, and Basser PJ, “White matter microstructure from nonparametric axon diameter distribution mapping,” NeuroImage, April 25 2016, doi: 10.1016/j.neuroimage.2016.04.052. [DOI] [PMC free article] [PubMed] [Google Scholar]
- [100].Xu J et al. , “Fast and simplified mapping of mean axon diameter using temporal diffusion spectroscopy,” NMR in biomedicine, vol. 29, no. 4, pp. 400–10, April 2016. [DOI] [PMC free article] [PubMed] [Google Scholar]
- [101].Xu J et al. , “Mapping mean axon diameter and axonal volume fraction by MRI using temporal diffusion spectroscopy,” NeuroImage, vol. 103, pp. 10–9, December 2014, doi: 10.1016/j.neuroimage.2014.09.006. [DOI] [PMC free article] [PubMed] [Google Scholar]
- [102].Dyrby TB, Sogaard LV, Hall MG, Ptito M, and Alexander DC, “Contrast and stability of the axon diameter index from microstructure imaging with diffusion MRI,” Magnetic resonance in medicine : official journal of the Society of Magnetic Resonance in Medicine / Society of Magnetic Resonance in Medicine, vol. 70, no. 3, pp. 711–21, September 2013, doi: 10.1002/mrm.24501. [DOI] [PMC free article] [PubMed] [Google Scholar]
- [103].Westin CF et al. , “Q-space trajectory imaging for multidimensional diffusion MRI of the human brain,” NeuroImage, vol. 135, pp. 345–62, July 15 2016, doi: 10.1016/j.neuroimage.2016.02.039. [DOI] [PMC free article] [PubMed] [Google Scholar]
- [104].Reich DS et al. , “Multiparametric magnetic resonance imaging analysis of the corticospinal tract in multiple sclerosis,” NeuroImage, vol. 38, no. 2, pp. 271–9, November 1 2007, doi: 10.1016/j.neuroimage.2007.07.049. [DOI] [PMC free article] [PubMed] [Google Scholar]
- [105].Duval T, Smith V, Stikov N, Klawiter EC, and Cohen-Adad J, “Scan-rescan of axcaliber, macromolecular tissue volume, and g-ratio in the spinal cord,” Magnetic resonance in medicine : official journal of the Society of Magnetic Resonance in Medicine / Society of Magnetic Resonance in Medicine, vol. 79, no. 5, pp. 2759–2765, May 2018, doi: 10.1002/mrm.26945. [DOI] [PMC free article] [PubMed] [Google Scholar]
- [106].Ganzetti M, Wenderoth N, and Mantini D, “Whole brain myelin mapping using T1- and T2-weighted MR imaging data,” Front Hum Neurosci, vol. 8, p. 671, 2014, doi: 10.3389/fnhum.2014.00671. [DOI] [PMC free article] [PubMed] [Google Scholar]
- [107].Calamante F, Tournier JD, Jackson GD, and Connelly A, “Track-density imaging (TDI): super-resolution white matter imaging using whole-brain track-density mapping,” NeuroImage, vol. 53, no. 4, pp. 1233–43, December 2010, doi: 10.1016/j.neuroimage.2010.07.024. [DOI] [PubMed] [Google Scholar]
- [108].Garyfallidis E et al. , “Recognition of white matter bundles using local and global streamline-based registration and clustering,” NeuroImage, vol. 170, pp. 283–295, April 15 2018, doi: 10.1016/j.neuroimage.2017.07.015. [DOI] [PubMed] [Google Scholar]
- [109].Fujiyoshi K et al. , “Diffusion tensor imaging and tractography of the spinal cord: from experimental studies to clinical application,” Exp Neurol, vol. 242, pp. 74–82, April 2013, doi: 10.1016/j.expneurol.2012.07.015. [DOI] [PubMed] [Google Scholar]
- [110].Grussu F et al. , “Relevance of time-dependence for clinically viable diffusion imaging of the spinal cord,” (in eng), Magn Reson Med, vol. 81, no. 2, pp. 1247–1264, February 2019, doi: 10.1002/mrm.27463. [DOI] [PMC free article] [PubMed] [Google Scholar]
- [111].Felten DL, Shetty AN, and Felten DL, Netter’s atlas of neuroscience, 2nd ed. Philadelphia, PA: Saunders/Elsevier, 2010, pp. xviii, 438 p. [Google Scholar]
Associated Data
This section collects any data citations, data availability statements, or supplementary materials included in this article.


