

Abstract
SUMMARY
SETTING:
Terizidone/cycloserine (TRD/CS) is included in standard treatment regimens for multidrug-resistant tuberculosis (MDR-TB) in many countries. The steady state pharmacokinetics (PKs) of CS after TRD administration are not known.
OBJECTIVES AND DESIGN:
We recruited in-patients treated with 250–750 mg oral TRD daily as part of standard treatment regimens for pulmonary MDR-TB in Cape Town, South Africa. Plasma CS assays were performed in samples taken pre-dose and at 2, 4, 6, 8 and 10 h post-dose. CS concentrations were measured using a validated liquid chromatography-tandem mass spectrometry method. Non-compartmental PK analyses were performed.
RESULTS:
Of 35 participants enrolled, 22 weres males, and 20 (57%) were infected with the human immunodeficiency virus; the median age was 37 years. The median duration on TRD at the time of sampling was 33 days (interquartile range [IQR] 28–39). The area under the concentration-time curve at 0–10 h (AUC0–10) was 319 μg.h/ml (IQR 267.5–378.7), and peak concentration was 38.1 μg/ml (IQR 32.6–47.2). On multiple regression, dose (mg/kg) was the only factor independently associated with AUC0–10.
CONCLUSION:
Steady state concentrations of CS in patients treated with TRD for MDR-TB were higher than those reported with CS formulations. Our findings support once-daily dosing.
Keywords: dose frequency, dose duration, HIV
Abstract
RÉSUMÉ
CONTEXTE :
La térizidone/cyclosérine (TRD/CS) est incluse dans les protocoles standard de traitement de la tuberculose multirésistante (TB-MDR) dans de nombreux pays. Mais la pharmacocinétique de la CS après l’administration de TRD est inconnue.
OBJECTIVES ET SCHEMA:
Nous avons recruté; des patients hospitalisés traités par 250–750 mg de TRD orale quotidienne dans le cadre du protocole standard de traitement de la TB-MDR pulmonaire au Cap, en Afrique du Sud. Les dosages plasmatiques de CS ont été réalisés sur des échantillons prélevés avant l’administration et à 2, 4, 6, 8 et 10 h après l’administration. Les concentrations de CS ont été mesurées avec un test validé de chromatographie liquide couplée à la spectrométrie de masse en tandem. Une analyse non-compartimentale de la pharmacocinétique a été réalisée.
RESULTATS :
Nous avons enrôlé 35 participants : 22 hommes, d’age médian 37 ans, et 20 (57%) qui étaient infectés par le virus de l’immunodéficience humaine. La durée médiane sous TRD au moment de l’échantillonnage était de 33 jours (IQR 28–39). La zone sous la courbe concentration-temps de 0–10 h (AUC0–10) a été de 319 μg.hr/ml (IQR 267,5–378,7) et la concentration maximale a été de 38,1 μg/ml (IQR 32,6–47,2). En régression multiple, la dose (mg/kg) a été le seul facteur indépendamment associé avec AUC0–10.
CONCLUSION :
Les concentrations de CS des patients traités par TRD pour une TB-MDR sont plus élerées que celles rapportées avec les formules à base de CS. Nos résultats soutiennent une seule administration par jour.
Abstract
RESUMEN
MARCO DE REFERENCIA:
En muchos países el tratamiento corriente de la tuberculosis multirresistente (TB-MDR) comporta el suministro de terizidona o cicloserina (TRD/CS). No se conoce la farmacocinética en equilibrio estacionario de la CS tras de la administración de TRD.
OBJETIVOS Y MÉTODOS:
Se incluyeron en el estudio pacientes hospitalizados que recibían de 250 mg a 750 mg de TRD diaria por vía oral como parte del régimen de tratamiento de la TB-MDR en la Ciudad del Cabo en Suráfrica. Se determinó) la concentración sérica de CS en muestras obtenidas antes de la dosis de TRD y 2, 4, 6, 8 y 10 h después de la misma. Las concentraciones de CS se midieron en un ensayo validado que comportaba una cromatografía de líquidos acoplada a la espectrometría de masas. Se realizó un análisis farmacocinético no compartimental.
RESULTADOS:
Se incluyeron en el estudio 35 pacientes, de los cuales 22 hombres; la mediana de la edad fue 37 años y 20 presentaban coinfección por el virus de la inmunodeficiencia humana (57%). La mediana de la duración del tratamiento con TRD en el momento de tomar la muestra fue 33 días (amplitud intercuartílica [AIC] de 28 a 39). El área bajo la curva de concentraciones plasmáticas contra el tiempo de 0 a 10 horas (ABC0–10) fue 319 μg.hr/ml (AIC de 267,5 a 378,7) y la concentración máxima fue 38,1 μg/ml (AIC de 32,6 a 47,2). En el análisis de regresión múltiple, la dosis (mg/kg) fue el único factor asociado de manera independiente con el ABC0–10.
CONCLUSIÓN:
Las concentraciones de CS en equilibrio estacionario de los pacientes que reciben TRD como parte del tratamiento de la TB-MDR son más altas que las concentraciones notificadas con las formas farmacéuticas de CS. Los resultados del estudio respaldan la pauta de administración una vez al día.
TERIZIDONE (TRD) IS A PRO-DRUG of cycloserine (CS) and consists of two linked CS molecules.1 CS is categorised as a group C anti-tuberculosis drug by the World Health Organization (WHO), and is widely used for the treatment of drug-resistant tuberculosis (TB).2 TRD has been used as a source of CS in some countries, including South Africa.
A meta-analysis of retrospective data reported that TRD may be better tolerated than CS; however, the difference was not statistically significant.1 A literature search revealed one single-dose study published in 1974 by Zitkova and Tousek of 25 patients with TB comparing CS and TRD pharmacokinetics (PKs) in patients given both drugs at different doses.3 However, the method they used to measure drug concentrations (calorimetry) is non-specific, and is no longer used to measure drug concentrations. Furthermore, single-dose studies give limited data on drug exposure. An enhanced understanding of the PKs and pharmacodynamics (PDs) of CS administered as TRD is important for dose optimisation. TRD hydrolyses pre-systemically to CS.4
We conducted a prospective PK study of CS at steady state in patients treated with TRD for pulmonary multidrug-resistant TB (MDR-TB) at two TB hospitals in Cape Town, South Africa.
STUDY POPULATION AND METHODS
Study design
We recruited patients aged ≥18 years initiated on treatment for pulmonary MDR-TB within the previous month. Patients were enrolled between July 2015 and January 2016 at two TB hospitals in the Western Cape Province of South Africa: the Brooklyn Chest Hospital and D P Marais Hospital.
During the study period, the standard regimen used to treat MDR-TB in Cape Town consisted of daily pyrazinamide, moxifloxacin (MFX), kanamycin, TRD, and either ethionamide (ETH) or isoniazid (INH), depending on the results of the line-probe assay for katG and inhA Mycobacterium tuberculosis mutations identified in the pre-treatment sputum cultures, which would indicate high-level INH or ETH resistance, respectively.5 Ethambutol (EMB) was added if a patient had not been treated with EMB for ≥1 month before starting MDR-TB treatment, and if suspicion of EMB resistance was low.6 After at least 2 weeks of treatment, patients received a dose of 250, 500 or 750 mg of TRD in accordance with national guidelines during the study period.6 However, dosing was modified for body weight and creatinine clearance at the discretion of the treating physician. Dosing was directly observed and performed under fasting conditions. Blood samples for CS assays were collected pre-dose and at 2, 4, 6, 8 and 10 h post-dose. The blood samples were centrifuged, and the plasma was frozen within 30 min of sampling and stored at −80°C.
CS assays were performed in the Division of Clinical Pharmacology of the University of Cape Town, Cape Town, South Africa. The method was validated for the quantification of CS in plasma, and consisted of precipitation, extraction and derivatisation of protein, followed by high-performance liquid chromatography with tandem mass spectrometry detection. An AB Sciex API 3000 mass spectrometer (GenTech Scientific, Arcade, NY, USA) at unit resolution in multiple-reaction monitoring mode was used to monitor the transition of the protonated precursor ion m/z 335.9 to the product ion m/z 157.2. Electrospray ionisation was used for ion production. The assay was validated over the concentration range 0.313–40.0 μg/ml. The accuracy of the combined low (0.783 μg/ml), medium (16.0 μg/ml) and high (32.0 μg/ml) quality controls was between 98.6% and 102.0%, and the coefficient of variation was <11.5%.
Statistical analyses
Stata v13.1 (StataCorp, College Station, TX, USA) was used for non-compartmental PK analyses and to perform the statistical analyses. Peak concentrations, area under the concentration-time curve at 0–10 h (AUC0–10) and half-life for each patient were assessed. As AUC0–10 displayed a skewed distribution, it was log-transformed before using linear regression to identify the factors associated with plasma CS exposure. The following variables were identified a priori and analysed using single and multiple regression analyses: sex, age at study enrolment, human immunodeficiency virus (HIV) status, body mass index, duration on TRD, creatinine clearance, and dose in mg/kg.
Ethics
The study protocol was approved by the Human Research Ethics Committee of the University of Cape Town (HREC 065/2015). Written informed consent was provided by all participants in their language of choice.
RESULTS
Thirty-five participants were enrolled (Table 1). The median time from treatment commencement until blood draw for CS assays was 33 days (range 18–56). On the day of blood sampling, 28 participants received 750 mg TRD, 6 participants received 500 mg TRD and one participant, who had significantly reduced creatinine clearance, received 250 mg TRD (see CS concentration-time curves in the Figure). Table 2 gives the steady state PK measures of CS. The half-life of CS for eight participants could not be calculated, as the CS concentration was either increasing or not decreasing at the final time of sampling. Covariates associated with CS exposure are shown in Table 3. On single and multiple regression analyses, the only factor independently associated with AUC0–10 was dose (mg/kg). There was a non-significant trend towards a higher AUC0–10 in patients who were HIV-infected.
Table 1.
Characteristics of 35 participants at steady state intensive pharmacokinetic sampling receiving treatment for multidrug-resistant tuberculosis
| Median [IQR] | |
|---|---|
| Participants, male:female, n | 22:13 |
| Age, years | 37 [28–46] |
| BMI, kg/m2 | 17.8 [15.6–20.1] |
| HIV status, n | |
| Positive | 20 |
| Negative | 15 |
| On ART at time of pharmacokinetic sampling, n | |
| Efavirenz* | 10 |
| Lopinavir*† | 1 |
| Creatinine clearance, ml/min | 76.1 [49.3–101.9] |
| Creatinine clearance <50 ml/min, n (%) | 10 (28.6) |
| Dose, mg/kg | 14.4 [13.4–16.0] |
| Dose per weight range, mg | |
| 750 (n = 28) | 39–73 kg |
| 500 (n = 6) | 33–38 kg |
| 250 (n = 1) | 43 kg |
including two nucleoside/nucleotide reverse transcriptase inhibitors.
Boosted with ritonavir.
IQR = interquartile range; BMI = body mass index; HIV = human immunodeficiency virus; ART = antiretroviral therapy.
Figure.
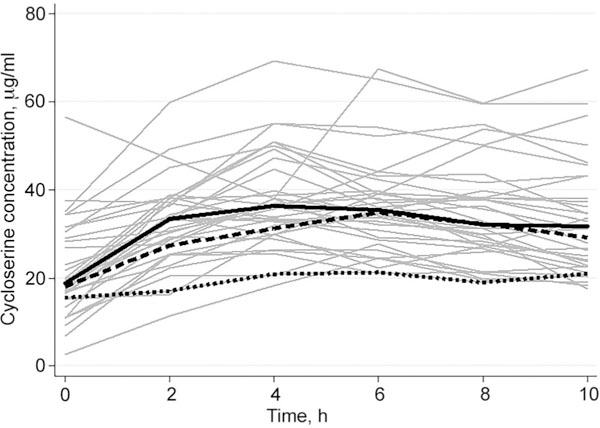
Cycloserine concentration-time profiles in 35 participants at steady state receiving treatment for multidrug-resistant tuberculosis, with median concentration-time profiles, by dose, in bold. Solid grey lines = concentration-time profile of each participant (n = 35); solid black line = median concentration-time profile for patients dosed at 750 mg (n = 28); dashed black line = median concentration-time profile for patients dosed at 500 mg (n = 6); dotted black line = concentration-time profile for patient dosed at 250 mg.
Table 2.
Pharmacokinetic measurements in 35 participants at steady state receiving treatment for multidrug-resistant tuberculosis
| Median [IQR] | |
|---|---|
| Tmax, h | 4 |
| Cmax, μg/ml† | 38.1 [32.6–47.2] |
| AUC0–10, μg.h/ml‡ | 319 [267.5–378.7] |
| Half-life, h (n = 27) | 14.7 [9.5–14.8] |
IQR = interquartile range; Tmax = time to maximum plasma concentration; Cmax = maximum plasma concentration; AUC0–10 = area under the concentration-time curve at 0–10 h.
Table 3.
Mean change in steady state AUC0–10 of cycloserine associated with covariates in patients with multidrug-resistant tuberculosis*
| Single | Multiple | |||
|---|---|---|---|---|
| AUC change* % (95%CI) |
P value | AUC change* % (95%CI) |
P value | |
| Sex | −9 (−26 to 13) | 0.377 | −5 (−25 to 21) | 0.669 |
| Age, years | 0 (−1 to 1) | 0.790 | 0 (−1 to 1) | 0.961 |
| HIV-infected, n | 18 (−3 to 45) | 0.097 | 16 (−9 to 47) | 0.216 |
| BMI, kg/m2* | −1 (−5 to 2) | 0.452 | 1 (−4 to 6) | 0.72 |
| Duration on terizidone, days | 0 (−1 to 1) | 0.945 | 0 (−1 to 1) | 0.951 |
| Creatinine clearance, ml/min | 0 (−1 to 0) | 0.325 | 0 (−1 to 0) | 0.68 |
| Dose, mg/kg | 5 (1 to 10) | 0.012 | 6 (1 to 12) | 0.028 |
The change in AUC is based on estimates from the linear regression model of the covariates on the log-transformed AUC, and expressed as percentage change in AUC for each unit change in covariate.
AUC0–10 = area under the concentration-time curve at 0–10h; HIV = human immunodeficiency virus; BMI = body mass index.
DISCUSSION
To our knowledge, this is the largest report of the PKs of CS at steady state, irrespective of whether it was administered as TRD or CS. Considering its association with neurotoxicity, and that efficacy is likely to be related to the serum concentrations achieved, characterising the PKs of CS is important for dose optimisation.1 Due to the paucity of PK data on TRD, the dose equivalent of CS is not known.
We found the maximum serum concentration (Cmax) and AUC0–10 to be higher than that reported previously for CS dosed at 250–500 mg daily.7 CS PKs have been reported in small, single-dose studies in healthy volunteers,7,8 or in patients after a limited duration of treatment.7,9 We performed intensive PK sampling after a longer treatment duration in patients given the pro-drug TRD, and accumulation could have accounted for the higher Cmax and AUC0–10 we observed. An alternative explanation for the high exposures of CS we found is a drug-drug interaction. A recent report of CS PKs in two groups of healthy volunteers given different MDR-TB treatment regimens reported a significantly higher CS AUC in participants in whom MFX was co-administered than in those who were treated with levofloxacin, even after accounting for weight differences between the two groups, suggesting the possibility of a drug-drug interaction between CS and MFX.7 Those findings need to be confirmed, but it is possible that MFX interferes with CS elimination. Unanticipated drug-drug interactions should also be contemplated for other second-line anti-tuberculosis drugs about which there is incomplete knowledge of disposition pathways.
The long half-life we observed suggests that once-daily dosing should be recommended for TRD. However, the PK-PD relationship associated with CS efficacy and toxicity is as yet not known. Definitive recommendations on optimal TRD dosing therefore await further studies.
Dose (mg/kg) was the strongest determinant of AUC. This observation is in keeping with the findings of a recent PK report on CS in a smaller cohort without HIV infection in Taiwan.9 We found a nonsignificant trend towards a higher AUC in patients infected with HIV after adjusting for dose/weight differences between patients who were non-HIV-infected. However, our sample size was not sufficiently powered to analyse the effect of HIV on CS PKs.
Our study was limited in that PK sampling was performed only for 10 h post-dose. As some participants had an increasing CS concentration at 10 h post-dose, it was not possible to extrapolate the AUC to infinity or accurately calculate the half-life of CS for all participants. A study with a longer sampling interval is needed to adequately characterise the PKs of CS administered as TRD. Second, although to our knowledge this is the largest report of CS PKs at steady state, a study with a larger cohort would be better powered to analyse factors associated with AUC and Cmax. Finally, our study was not designed to assess whether drug-drug interactions affected the PKs of CS.
This is the largest study to describe the steady state PKs of CS and the first to describe the steady state PKs of CS dosed as TRD in patients treated for TB. The steady state concentrations of CS in patients treated with TRD for MDR-TB were higher than those reported with CS formulations. Our findings suggest the accumulation of CS and support the notion of once-daily dosing.
Acknowledgements
The study was supported by grants from the National Institute of Allergy and Infectious Diseases of the National Institutes of Health (NIH), Bethesda, MD, USA (R01AI116155 to HM and TG, UM1 AI068634, UM1 AI068636, UM1AI106701 and U01 AI068632). The drug assays were also supported in part by the Eunice Kennedy Shriver National Institute of Child Health and Human Development, and the National Institute of Mental Health, Bethesda (AI068632). The content of this article is solely the responsibility of the authors and does not necessarily represent the official views of the NIH. HM and GM were also supported by the National Research Foundation, Pretoria, South Africa (grant numbers 90729 and 85810, respectively). The authors thank M. Solomons for her contribution to the study.
References
- 1.Hwang TJ>, Wares DF, Jafarov A, Jakubowiak W, Nunn P, Keshavjee S. Safety of cycloserine and terizidone for the treatment of drug-resistant tuberculosis: a meta-analysis. Int J Tuberc Lung Dis 2013; 17: 1257–1266. [DOI] [PubMed] [Google Scholar]
- 2.World Health Organization. WHO treatment guidelines for drug-resistant tuberculosis. WHO/HTM/TB/2016.04. Geneva, Switzerland: WHO, 2016. http://apps.who.int/iris/bitstream/10665/250125/1/9789241549639-eng.pdf?ua—1. Accessed September 2017. [Google Scholar]
- 3.Zitkova L, Tousek J. Pharmacokinetics of cycloserine and terizidone. Chemotherapy 1974; 20: 18–28. [DOI] [PubMed] [Google Scholar]
- 4.World Health Organization. Notes on the design of bioequivalence study: terizidone WHO/PQT: medicines. Geneva, Switzerland: WHO, 2015. https://extranet.who.int/prequal/sites/default/files/documents/29BEterizidone_Oct2015_0.pdf Accessed September 2017. [Google Scholar]
- 5.Caminero JA, Sotgiu G, Zumla A, Migliori GB. Best drug treatment for multidrug-resistant and extensively drug-resistant tuberculosis. Lancet Infect Dis 2010; 10: 621–629. [DOI] [PubMed] [Google Scholar]
- 6.South African Department of Health. Management of drug resistant tuberculosis. Pretoria, South Africa; DoH, 2013: pp 42–50. https://www.health-e.org.za/wp-content/uploads/2014/06/MDR-TB-Clinical-Guidelines-Updated-Jan-2013.pdf. Accessed September 2017. [Google Scholar]
- 7.Park S I, Oh J, Jang K, et al. Pharmacokinetics of second-line antituberculosis drugs after multiple administrations in healthy volunteers. Antimicrob Agents Chemother 2015; 59: 4429–4435. [DOI] [PMC free article] [PubMed] [Google Scholar]
- 8.Zhu M, Nix D, Adam R, Childs J, Peloquin C. Pharmacokinetics of cycloserine under fasting conditions and with high-fat meal, orange juice, and antacids. Pharmacotherapy 2001; 21: 891–897. [DOI] [PubMed] [Google Scholar]
- 9.Hung WY, Yu MC, Chiang YC, et al. Serum concentrations of cycloserine and outcome of multidrug-resistant tuberculosis in Northern Taiwan. Int J Tuberc Lung Dis 2014; 18: 601–606. [DOI] [PubMed] [Google Scholar]