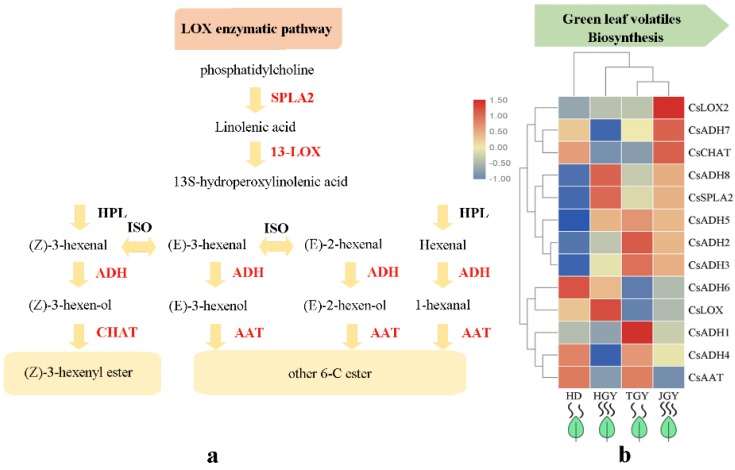
Figure 5.
Expression profiles of genes related to green leaf volatiles biosynthesis. (a) Heat map of the expression pattern of related DEGs in four different tea variety. TBtools software was used for drawing heatmap and the function “scale” was used for normalized the data by rows (b) A simplified model of LOX enzymatic pathway in tea plant.

