

Introduction
this is the first study to use US‐wide data to explore how influenza exposure affects fetal development, showing how differing exposure to influenza epidemics drives variations in birth weight, gestational age, and neonatal and infant mortality. It builds on previous work that suggests that in utero exposure to seasonal influenza might be responsible for some of the seasonal patterns in birth/infant health outcomes, and estimates the effect of influenza during different months of gestation. The measure of influenza exposure employed is the monthly, county‐level influenza‐attributable mortality rate per 100,000 population. Although this is changing, most of the published literature has focused on the impact of third trimester exposure (Omer et al. 2011; Steinhoff et al. 2012; Richards et al. 2013; Currie and Schwandt 2013). These results, which cover all gestation months, thus add robustness to current socio‐medical knowledge. An additional contribution of this study is its large sample size (over 28 million observations), which gives sufficient statistical power to study rare events such as infant deaths. Finally, the county‐ and time fixed effects approach goes beyond correlations to attempt to isolate the causal relationships between influenza exposure and birth/infant outcomes.
The study sample consists of all single births from 1989–1991 and 1995–2004 that took place in counties in the contiguous US with more than 250,000 inhabitants. These data, which include information on gestational age, are combined with a measure of influenza exposure (monthly, county‐level influenza mortality rates) during each month of gestation. I assign the same exposure to all conceptions that take place at the same time in the same county, which reduces the likelihood that the estimates will suffer from maternal selection into exposure.
To examine the impact on infant health outcomes of in utero exposure to influenza during critical periods of gestation, I regress individual‐level health outcomes on monthly, county‐level influenza mortality rates. The estimation strategy includes controls for individual, maternal, and county characteristics, county‐specific linear time trends, and, most importantly, county‐by‐calendar month and influenza‐season year fixed effects. The fixed effects isolate variation in influenza exposure arising from larger‐than‐average epidemics and minimizes confounding due to factors that vary by county, seasons, and year.
I find that exposure early in the first trimester is associated with increased risk of neonatal and infant mortality as well as increased risk of preterm birth. While exposure during the second trimester is associated with lower neonatal and infant mortality, this is most likely due to selective survival as a result of unobserved fetal loss. I also find that exposure during the second trimester is associated with increased risk of low birthweight even after controlling for gestational age. Exposure in the third trimester is associated with lower birthweight and gestation length, and increased risk of being born preterm or with low weight. These are the vulnerable periods that we would expect from the existing literature on fetal development.
The estimation strategy results in estimates that are population average effects, and therefore masks the much larger effects for the subset of pregnant women who actually contracted influenza. After converting population average effects into treatment‐on‐treated effects, on average, moderate influenza exposure changes (defined as going from a 25th percentile year to a 75th percentile year) during vulnerable months of gestation can increase neonatal and infant mortality rates by 45 percent, reduce birthweights by 44.8 grams (1.34 percent), increase the probability of low birth weight by 0.94 percentage points (15.37 percent), reduce gestation length by about one third of a week, and increase the risk of preterm by 1.59 percentage points (15.66 percent). Exposure to extreme changes in influenza exposure (the difference between being an extreme epidemic and a mild one) results in effects that are five times larger. The timing of the vulnerable months of gestation in relation to the peak influenza season is of significance. Effects from being exposed to moderate or extreme exposure changes are much larger if vulnerable months occur in winter instead of the summer months.
These effects on birth outcomes are large and meaningful. Extreme changes in influenza exposure result in effects that are of similar magnitude to the black‐white racial difference in birth outcomes, while the effects of moderate exposure changes are around 33 percent of the black‐white infant mortality gap and around 12 percent of the black‐white preterm gap (Rossen and Schoendorf 2014). These findings are in agreement with a study of the effects of in utero influenza infections on short‐term outcomes among cohorts of Danish births (Schwandt 2018). They are also in line with the literature that finds benefits of maternal influenza immunization for birth outcomes (Omer et al. 2011; Steinhoff et al. 2012; Richards et al. 2013).
Existing literature on seasonality in health at birth
Birth rates differ by season, and infant health outcomes vary by birth season (Lam and Miron 1991; Dorélien 2015). Part of the reason health at birth varies by birth month is an artifact. Specifically, seasonal fluctuations in birth rates can contribute to seasonal patterns in infant health outcomes that are associated with gestational age because of the mechanical relationship between gestation length and birth month (Currie and Schwandt 2013). For instance, rates of preterm birth (gestation length less than 37 weeks) are likely higher just before the annual birth peak: if risks of preterm births are the same across conception months and there are peaks in conception rates, then there will be more preterm births in the months just before the peak in births. Consequently, peak birth months are often associated with the best health outcomes (Dorélien 2015). We can eliminate this artifact by using data on gestational ages, allowing us to analyze patterns by conception month rather than birth month. Even after this correction, data from the US still exhibits seasonality by conception month in terms of health at birth (Currie and Schwandt 2013; author's own calculations in Figure 1).
Figure 1.
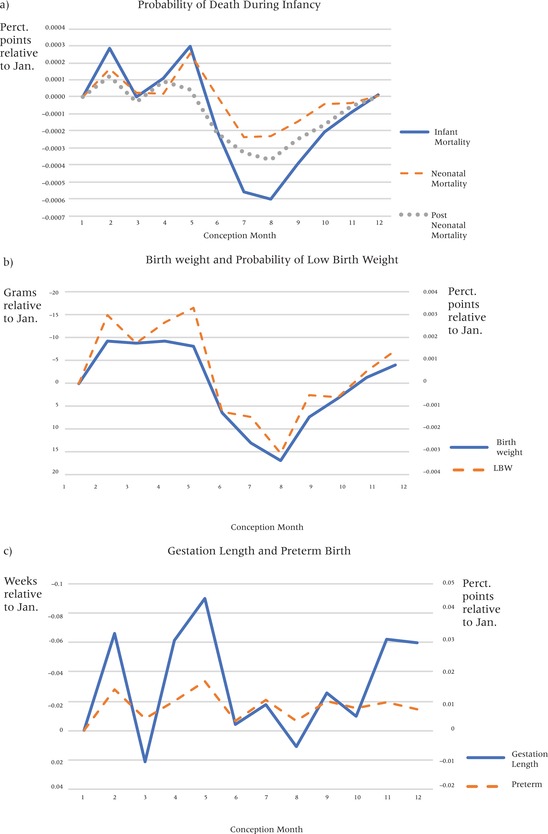
Birth outcomes by month of conception
NOTE: Birth outcomes are on average worse for infants conceived in May. The y‐axes are oriented so that poor outcomes are always above the zero‐reference line.
In the US and other countries in which high‐quality data on gestational ages and birth date records are available, we can group the remaining possible explanations for seasonality in health at birth into two categories: (1) maternal selection (in that women of different backgrounds do not give birth at the same rates across the year); and (2) the fact that different conception months are associated with different exposures to seasonally‐varying determinants of health (Dorélien 2015).
For certain outcomes, maternal selection explains a significant portion of the relationship between conception/birth month and later life outcomes. Buckles and Hungerman (2013) illustrate that 25 to 50 percent of the later‐life differences in educational attainment and earnings between individuals born in different months may be explained by seasonal differences in fertility patterns among women of different sociodemographic and economic backgrounds. Still, selection does not appear to explain most of the relationship between conception month and infant health outcomes. Currie and Schwandt (2013, 12269), whose estimation strategy followed the same mothers in three US states over time, were able to control for the role of maternal selection and found that “seasonal effects on birth outcomes are so strong that the bias because of selection is relatively small. In other words, a high SES [socioeconomic status] mother getting pregnant in an unfavorable month will, on average, experience similarly poor birth outcomes as the typical (lower SES) mother conceiving in this unfavorable month.” Consequently, even when maternal selection is accounted for, a good deal of the seasonal variation in infant health outcomes remains unexplained.
Differences in the timing of conception and birth expose people to varying physical, health, and social environments in utero. Shocks to the fetal environment affect health and socioeconomic outcomes in adulthood (Almond 2006; Kelly 2011; Torche 2011; Fan and Qian 2015), yet the most commonly studied shocks (e.g., pandemics, famines, and earthquakes) are infrequent and are not useful in explaining most people's health outcomes. Furthermore, because they use historical data, these studies have most often looked at long‐term effects rather than health at birth and other early life outcomes. For its part, birth month, which can be taken as a proxy for seasonal shocks, has been found to be an important predictor of health and other outcomes (Moore et al. 1997; Doblhammer and Vaupel 2001; Gluckman et al. 2008; Huber et al. 2004; Torrey et al. 1997; Dorélien 2015). The literature on seasonality in birth and infant outcomes in developed countries has primarily focused on and prioritized the role of ambient temperature and air pollution, and to a lesser extent has focused on the role of the disease environment. (Bell, Ebisu, and Belanger 2007; Murray et al. 2000; Strand, Barnett, and Tong 2011b). Seasonal variability in exposure to infectious diseases may account for previously‐unexplained seasonal fluctuations in health at birth and in infant health outcomes. I select seasonal influenza as my focal exposure because it is a recurring, preventable, seasonal shock and one of the few infectious diseases to which sizeable portions of the US population are susceptible each year, and it has been hypothesized (Currie and Schwandt 2013) to contribute to seasonality in US health at birth.
Infant health outcomes and seasonality of health at birth
In this article, health at birth is measured using data on gestational age, preterm birth (PTB, gestation less than 37 weeks), birthweight, low birthweight (LBW, birthweight less than 2,500 grams), and neonatal and infant mortality. Most research on birth and infant health outcomes has focused on the role of either sociodemographic determinants (including race, maternal age, obesity, and multiple births) or medical practices (including induced labor and C‐section rates), but these factors do not help explain the seasonality of health outcomes at birth.
In fact, health at birth varies substantially by season (Selvin and Janerich 1971; Strand, Barnett, and Tong 2011b; Currie and Schwandt 2013). On average in the United States, children born in the winter months have worse infant health compared to children born in other months (Eastman 1945; Buckles and Hungerman 2013). Currie and Schwandt (2013) noted that infants conceived in May (February births) are 13 percent more likely to be born premature compared to other infants, and that this dip in gestation length is correlated with influenza exposure in the last trimester. In Figure 1, seasonality in health outcomes by conception month is plotted using the entire sample of births. Analysis confirms that birth outcomes are often worse for children conceived in May (February births) with a third trimester coincident with the peak in influenza epidemics than for children conceived in the northern hemisphere's late summer months of July and August.
Background on influenza virus infections
Each year, some 10 to 20 percent of the US population is infected with influenza (Widdowson and Monto 2013), and an average of 27,000 to 55,000 deaths are attributed to the virus (Dushoff et al. 2006). In symptomatic individuals, influenza viruses produce febrile respiratory disease (i.e., fever, cough, sore throat, muscle fatigue, headache, and inflammation of the nasal mucous membrane) with symptoms lasting approximately one week (Carrat et al. 2008; Moniz and Beigi 2013). In some cases, patients with an influenza virus infection develop primary influenza viral pneumonia or secondary bacterial pneumonia (Steinhoff 2014; Shrestha et al. 2013).
Influenza viruses are well‐known for their antigenic variability, and new strains are quickly able to evade previously‐acquired immune memory (Steinhoff 2014). Therefore, there are recurring epidemics of influenza, and vaccination must be repeated annually. The incidence of influenza is seasonal, with US epidemics typically occurring between November and March and peaking in the early winter months (Moniz and Beigi 2013), but the virus does circulate at very low levels during the off‐peak months. Due to differences in strains, host immunity, and socioeconomic and environmental factors, there is great inter‐annual variation in monthly influenza incidence and mortality rates; this allows me to compare epidemics of different intensities across years (Figure 2) (Greene, Ionides, and Wilson 2006; Barreca and Shimshack 2012; Adda 2016).
Figure 2.
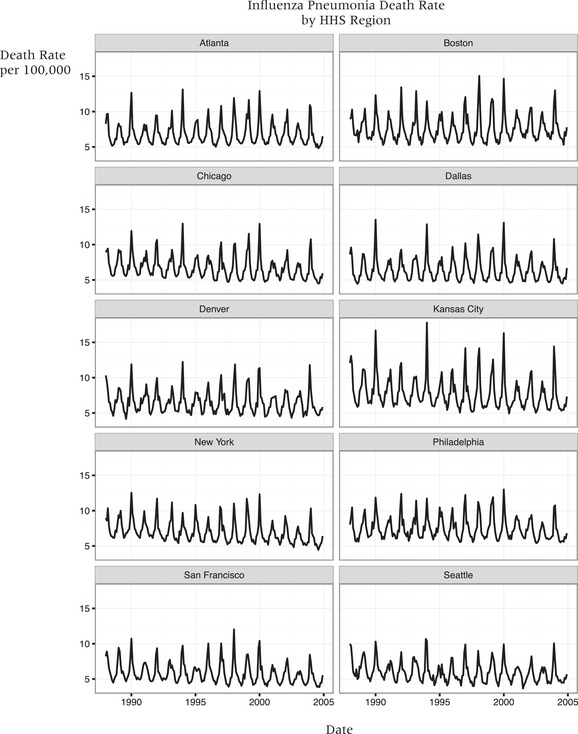
Time series graph illustrating the spatial variation in magnitude of influenza/pneumonia mortality rates between 1988 and 2004
NOTES: The magnitude of the epidemics vary by year, for instance influenza/pneumonia mortality was much higher during winter 1994 compared to winter 2001 epidemic. Influenza virus does circulate during the summer months but at low levels; an influenza epidemic is declared when influenza cases exceed baseline levels.
The incidence of influenza infection appears to be the same among pregnant women as in the general adult population (Moniz and Beigi, 2013). Because of the immunological and physiological changes in their bodies, however, pregnant women have an increased risk of suffering from severe influenza symptoms (Cox et al. 2006; Rasmussen, Jamieson, and Uyeki 2012; Kourtis, Read, and Jamieson 2014). The risk of influenza‐associated complications appears to increase monotonically with each trimester and is greater for pregnant women with multiple underlying conditions such as asthma, diabetes mellitus, and chronic cardiac disease compared with women with just one or none of these conditions (Dodds et al. 2007; Rasmussen, Jamieson, and Uyeki 2012).
Influenza and birth outcomes
During fetal development, some periods are critical (Class et al. 2011). That is, the timing of an in utero shock matters for birth and infant health outcomes. The same shock may result in fetal loss if it occurs early in pregnancy or preterm delivery if it occurs later in the pregnancy. Likewise, periods of vulnerability for different outcomes and the mechanisms involved may vary (Class et al. 2011). Rubella offers one of the best illustrations of this effect: if a susceptible mother contracts rubella before the 11th week of her pregnancy, her child is more likely to be deaf and have congenital heart defects, while infections contracted between the 11th and 16th weeks of pregnancy are only associated with an increased risk of deafness. In contrast, rubella infections contracted after 16 weeks are not associated with any increased risk of gestational defects (Miller, Cradock‐Watson, and Pollock 1982).
Unlike the rubella or Zika viruses, the influenza virus rarely crosses the placenta to infect the fetus; its effects are thus secondary (Rasmussen, Jamieson, and Uyeki 2012). For instance, the inflammation and hyperthermia that accompanies maternal influenza infection may impair the regulatory cells that protect the placenta, and therefore impact fetal development during certain stages (Kourtis, Read, and Jamieson 2014). Maternal influenza infection may also impact nutritional flows, having impact on infant birthweight through the reduction of a mother's nutritional intake, by reducing the mother's ability to absorb nutrients, and because fever accelerates energy consumption and nutrient loss (Kelly 2011).
The pathways tying in utero influenza exposure to birth outcomes are not fully understood (Rasmussen, Jamieson, and Bresee 2008). However, some existing studies show that in utero exposure may be associated with increased rates of fetal loss (Håberg et al. 2013), PTB, and LBW (Legge et al. 2014). In the US, two retrospective cohort studies have also showed that maternal influenza immunization is associated with lower rates of preterm deliveries and a lower probability that a newborn will be small for its gestational age during influenza season (Omer et al. 2011; Richards et al. 2013). These studies differ than those presented here in that they focus on the impacts of third trimester exposure, only include one influenza season, are more prone to concerns related to maternal selection, and have much narrower geographic scope. Perhaps the best current published evidence that influenza infections may be responsible for some of the seasonal patterns in infant outcomes comes from Steinhoff et al. (2012). They conduct a secondary analysis of a randomized control trial (which initially studied the effectiveness of pneumococcal and influenza vaccination), to study neonatal outcomes after maternal influenza and pneumococcal vaccinations during the third trimester. The study was conducted in Bangladesh during a period with limited or no circulating influenza virus (September 2004–January 2005) and during the influenza season (February–October 2005). The mean birthweight and gestational age were significantly lower among infants whose mothers received the pneumococcal vaccine (the control) compared to those who received the influenza vaccine—however this effect was only present and significant during the influenza season. Still, a systematic review (Fell et al. 2017) notes that some studies of women diagnosed with seasonal influenza during pregnancy did not find an increase in the risk of PTB or the chance that a newborn will be small for its gestational age. The authors conclude that, overall, there are very few high‐quality studies on the issue. By identifying vulnerable periods of gestation, I am able to elucidate the specific mechanisms through which influenza may affect such birth outcomes. Below I describe potential effects of influenza exposure during each of the trimesters of gestation.
Impacts from first‐trimester exposure
The first eight weeks of pregnancy are referred to as the embryonic period. Major organs are formed in this period, and the effects of exposure to influenza might result in structural defects leading to fetal loss or infant death. Importantly, many women do not yet know they are pregnant when their fetuses are in the embryonic stage, and so they are less likely to take precautions with regard to influenza exposure than women who know that they are pregnant. There is some evidence supporting an increase in miscarriage associated with influenza exposure; Bloom‐Feshbach et al. (2011) identify a decline in US birth rates approximately six months after the 1918 influenza pandemic's peak and attributed this decline to first‐trimester miscarriages. By analyzing fertility rates of Danish women, Schwandt (2018) also finds evidence of first‐trimester miscarriages among women who contracted influenza. If first‐trimester exposure does increase the risk of miscarriages, especially for the weakest fetuses, we might observe selective survival, which would alter the observed attributes of the subset of fetuses who survive exposure.
Impacts from second‐trimester exposure
In this, the fetal period of development (eight to 25 weeks), functional—as opposed to structural—defects are more likely to occur as a result of influenza exposure (see the fetal development chart created by Moore and Persaud (1993) for more details). The second trimester is a vulnerable period for brain development, with the peak proliferation of nerve cells and migration of neurons to different parts of the brain occurring between eight and 15 weeks. Shocks during this time most likely affect cognitive development and would be associated with later outcomes as opposed to measurable birth outcomes (Kelly 2011; Schwandt 2018). Between 16 and 25 weeks, we observe rapid neuron differentiation and the creation of new synapses in the fetal brain; many studies indicate that factors affecting these processes explain why second‐trimester exposure to influenza is associated with increased risk of schizophrenia as infants mature into young adults (O'Callaghan et al. 1991).
Impacts from third trimester exposure
Influenza exposure during the third trimester has been associated with triggering premature labor, and thus is associated with PTB and LBW (Omer et al. 2011; Richards et al. 2013; Currie and Schwandt 2013; Schwandt 2018).
To summarize, I expect to find impacts based on in utero exposure to influenza during the first two months and the last two months of gestation. I do not expect the impact of second trimester influenza exposure to be reflected in the birth outcomes that I measure.
Methods
Source of data on conceptions and health outcomes
All conception and birth data employed here come from the National Center for Health Statistics’ Birth Cohort Linked Birth‐Infant Death data files. These data are available at the county level from 1989 to 1991 and from 1995 to 2004 (after 2004, the county‐level identifiers were no longer publicly available) and contain all reported live births in the US. For conceptions resulting in death within one year of birth, age at death and the underlying cause of death are reported. The main outcomes of interests for this study are gestational age, PTB, birthweight, LBW, neonatal mortality (death within the first 28 days after birth) and infant mortality (death within the first year). Because LBW might be a consequence of reduced gestational length or intrauterine growth restriction, I further analyze LBW and birthweight controlling for gestational age. I group the causes of infant death into 17 broad categories. As a robustness check, I run a falsification test to see what impact in utero exposure to influenza has on injury and accidental deaths. The dataset also contains information on prenatal care, individual risk factors, and maternal risk factors (i.e., mother's tobacco and alcohol use, race, age, and education level).
This study does not examine fetal death or miscarriage. The dataset does not contain information on conceptions resulting in fetal death or miscarriage, and other sources of data on fetal loss are likely to suffer from severe selection bias due to underreporting. Consider that approximately 24,000 fetal deaths after 20 weeks’ gestation were reported in the US in 2013, but the CDC estimated more than one million fetal deaths that year (Curtin et al. 2013; MacDorman and Gregory 2015). One reason behind the underreporting of fetal loss is that most fetal deaths occur before 20 weeks, when women may have had limited interactions with the antenatal care system. Fetal loss reporting requirements also vary widely by state; only some states require reporting for all periods of gestation (Martin and Hoyert 2002). Finally, in the fetal death datasets, few of the risk factor variables pertinent to this study are systematically recorded. For instance, information on maternal age, maternal education, and the month in which prenatal care began are more likely to be missing in the fetal death data than in the data on live births.
Source of influenza exposure data
The influenza exposure variable is based on local‐area mortality from influenza‐like illness (ILI). I do not use individual ILI infection because information on actual maternal influenza infection during pregnancy is not included in the NCHS birth datasets. Instead, I use monthly county‐level ILI mortality rates (per 100,000) as a proxy for influenza exposure.
County‐level monthly ILI mortality rates are estimated by coding and tallying the monthly ILI (both influenza and pneumonia) deaths in each county and then converting them into rates, following Barreca and Shimshack (2012). Deaths due to both pneumonia and influenza are included, because death caused by pneumonia might occur after initial influenza infection (Dushoff et al. 2006). According to the CDC, influenza is underreported on the death certificate as the cause of death for people who die of influenza‐related complications. Furthermore, this inclusive measure follows the CDC's surveillance of ILI deaths, which counts all deaths for which pneumonia and/or influenza are listed as the underlying or contributing cause of death (CDC 2017).
The mortality data come from the National Center for Health Statistics’ Multiple Cause of Death files (1988–2004). The International Classification of Diseases Ninth Revision (ICD‐9) was used to code deaths from 1988 to 1998, and the ICD Tenth Revision (ICD‐10) was used for the remaining years, 1999–2004. The influenza‐attributable deaths were calculated from the following ICD codes that include both deaths attributable to influenza and pneumonia: influenza (ICD‐9: 487–488, ICD‐10: J 09–11) or infectious pneumonia (ICD‐ 9: 480–486, ICD‐10: J 12–18) as the primary or secondary cause of death (Dushoff et al. 2006).
For each county, monthly ILI mortality rates per 100,000 inhabitants are calculated by dividing the death counts by the estimated annual population size. For a sensitivity analysis, I also calculate an influenza mortality rate in which the numerator is the ILI deaths among population aged 65 and over, retaining the overall county population size count in the denominator; people aged 65 and over are responsible for 90 percent of all ILI deaths (Widdowson and Monto 2013). County‐year population estimates come from the National Cancer Institute's (NCI) Surveillance, Epidemiology, and End Results (SEER) system (National Cancer Institute 2013), as do the size of the population 65 and older.
Importantly, the ILI mortality rate lags behind influenza exposure and morbidity rates. Most influenza‐attributable deaths occur one to two weeks after initial infection, producing the lag between morbidity and mortality data (Denoeud et al. 2007). Since the NCHS mortality data is by month rather than by week, it is not possible to create a two‐week lag. Instead, I create a one‐month lag for the influenza exposure variables, reasoning that if exposure occurred in the last two weeks of a month, the resulting death might not occur until the following month.
The use of monthly county‐level ILI mortality rates as influenza exposure is advantageous because analyses based on mother's hospitalization records are often biased by the exclusion of milder disease cases (Fell et al. 2016). Furthermore, by using influenza exposure, my analysis is less likely to suffer from omitted‐variable bias, since different women may have different risk of contracting influenza based on their behavior and circumstances (Noble 2014). In these analyses, all infants living in the same county and conceived in the same month and year will have the same proxy measure of influenza exposure, reducing some selection concerns but attenuating my estimates in that not all mothers who are exposed to influenza will become ill.
The use of ILI mortality rates also allows for a large sample, which results in a well‐powered study. In the US, ILI mortality rates are available at finer spatial resolution (i.e., the county level) and for a longer time period than ILI infection rate data, thereby allowing for a more sophisticated research design. Note that the CDC did not begin collecting data on ILI infection rates until 1997, and the data are only available at the regional level. Google Flu Trends data are only available dating back to 2003, and it is not clear whether the data are robust when disaggregated (Adda 2016). Furthermore, the mortality data is a good approximation of the morbidity data (Noble 2014); for the time periods that there is an overlap in data, I find that ILI morbidity patterns were very similar to the ILI mortality rate patterns.
Additional county‐level variables
Additional county‐level variables are included in the dataset—in order to capture the healthcare and economic environment—and demonstrate that these outside factors are not jointly causing increased influenza mortality and poor infant health outcomes. From the Bureau of Labor Statistics Local Area Unemployment Statistics, I obtain the monthly unadjusted unemployment rate, and from the Health Resource and Service Administrations’ (HRSA) Area Health Resource Files, I obtain data on access to healthcare. Data on the number of hospitals and hospital beds are available annually (1988–2005); data on the number of active medical doctors are available starting in 1995.
Population created by merging conception with influenza exposure data
The study sample consists of approximately 28 million conceptions resulting in live single births with non‐missing information on gestation length. This sample is restricted in two ways: first, the analysis is limited to only those counties with more than 250,000 inhabitants, because counties with fewer inhabitants are not uniquely identifiable in the publicly available NCHS datasets. Second, only births in the contiguous US are included. I follow the methodology of Currie and Schwandt (2013, 12269) in calculating month of conception by “subtracting the rounded number of gestation months (gestation in weeks x 7/30.5) from the month of birth.” Each observation contains the corresponding county influenza mortality rate at the month of conception and influenza mortality rates for the next nine months following conception. Additionally, because influenza mortality rates might lag behind influenza exposure (Glezen et al. 1982), I include influenza mortality rates for the 10 months following conception. I base the timing on conception dates rather than birth dates so as to avoid artificial seasonal patterns owing to fluctuations in conception rates.
Since the data are based on births, the beginning and end of the sample is likely to over‐represent births with long and short gestation lengths. Therefore, conceptions occurring six months before the start and less than 10 months before the end of the sample are excluded (Strand, Barnett, and Tong 2011a; Currie and Schwandt 2013). Specifically, I dropped conceptions before July 1988 and after February 2004. Because of missing data from 1992 to 1994, I also dropped conceptions between February 1991 and July 1994. The flowchart in Appendix A illustrates the steps used to merge the different datasets and construct my study sample.
Table 1 shows descriptive statistics for the study sample. Of the births, 51 percent were boys; 10.2 percent were PTBs, 6.1 percent were LBW, 0.4 percent died within the first 28 days of life, and 0.6 percent died within the first year. The mean gestational age was 38.9 weeks, and the mean birthweight was 3,343 grams. The sample characteristics are very similar to statistics for overall US births from 1989 to 2008.
Table 1.
Summary statistics of study sample
| United States 1988–2004* | |||
|---|---|---|---|
| Mean | SD | SE | |
| Birth Outcomes | |||
| Gestation age (wks) | 38.9 | 2.507 | 0.0005 |
| Preterm (PTB) | 0.102 | 0.302 | 0.0001 |
| Birth weight (grams) | 3343 | 585 | 0.1105 |
| Low birth weight (LBW) | 0.061 | 0.239 | 0.0000 |
| Neonatal mortality | 0.004 | 0.061 | 0.0000 |
| Infant mortality | 0.006 | 0.076 | 0.0000 |
| Male | 0.512 | 0.500 | 0.0001 |
| Maternal Characteristics | |||
| Married | 0.664 | 0.472 | 0.0001 |
| White race | 0.752 | 0.432 | 0.0001 |
| Black race | 0.183 | 0.386 | 0.0001 |
| Other race | 0.065 | 0.247 | 0.0000 |
| Tobacco user | 0.077 | 0.266 | 0.0001 |
| Alcohol user | 0.012 | 0.107 | 0.0000 |
| Less than high school | 0.222 | 0.416 | 0.0001 |
| High school | 0.294 | 0.455 | 0.0001 |
| Some college educ. | 0.198 | 0.398 | 0.0001 |
| 16+ years of educ. | 0.240 | 0.427 | 0.0001 |
| under 20 | 0.110 | 0.313 | 0.0001 |
| 20–24 | 0.231 | 0.421 | 0.0001 |
| 25–29 | 0.275 | 0.447 | 0.0001 |
| 30–34 | 0.275 | 0.431 | 0.0001 |
| 35+ | 0.275 | 0.345 | 0.0001 |
| County Characteristics | |||
| Pop. proportion over 65 (%) | 11.55 | 2.96 | 0.0006 |
| Unemployment rate (%) | 5.28 | 2.19 | 0.0004 |
| Number of hospitals | 27.63 | 34.62 | 0.0065 |
| Number of hospital beds | 6,843.74 | 8,252.97 | 1.56 |
| Number of births | 27,993,469 | ||
*Infants born in 1992–1994 not included
Statistical analyses
To examine the effect of influenza exposure during different critical periods of gestation on infant health outcomes, I regress individual‐level health outcomes on monthly county‐level influenza mortality rates.
The ordinary least squares regression model is given by
| (1) |
where is the infant health outcome for individual i in county c at time t (conception date in month and year). is county‐level ILI mortality rate per 100,000 population during month j of gestation; is the ILI mortality rate during the month of conception, is the ILI mortality rate in the month after the infant is conceived, and so forth. Due to the potential lag between influenza exposure and mortality, the coefficient on the influenza mortality rate nine months after conception might really reflect exposure eight months after conception and so on. Therefore, I include ILI mortality in month 10 to capture effects in the last month of pregnancy. The PTB analysis does not include month 10 because all births in the 10th month after conception are full‐term. Estimating effects separately for each month of gestation allows me to identify critical periods of exposure. I also run an F‐test on the joint significance of all the influenza exposure coefficients ( which is a test of the overall effect of influenza exposure at any point of gestation, as well as a test on the equality of the influenza exposure coefficients (.
Due to the large size of the dataset, regressions are estimated using the reghdfe function in Stata SE version 14.2, which allows for the high‐speed estimation of linear regression models with large numbers of fixed effects (Correia 2014).
Fixed effects and county‐specific time trends
A key feature of the model is that it controls for county‐by‐calendar month fixed effects (μcm). Therefore, the model absorbs all typical seasonal patterns for a given county in both ILI mortality rates as well as infant health outcomes. The estimates are hence based on the relationship between deviations from a given county's seasonally‐typical mortality rates and seasonally‐typical infant health outcomes. That is, the variation exploited is not seasonal variation; I am not comparing winter influenza mortality rates with summer influenza mortality rates. Instead, I compare January influenza mortality rates within a county with other January influenza mortality rates in that same county, and likewise for the other months of the year. This minimizes confounding due to omitted variables (such as counties’ differential coding for influenza deaths, age structure, the socioeconomic and racial composition of the population, and seasonal variation in temperature and air pollution). The dummy variables for county‐by‐calendar months mitigate the spurious correlation between influenza mortality rates and pregnancy outcomes that would arise simply because they have the same seasonal patterns and control for unmeasured factors that also exhibit similar seasonal patterns. The model also includes county‐specific linear time trends () to control for long‐term trends in infant health outcomes that may vary by county. Tt is a continuous variable that starts at 0 in July 1988 and increases by one every month thereafter. My main specification includes influenza‐season year (from September to the following August) fixed effects (, which capture the average influenza mortality rate across one influenza season (as opposed to year fixed effects that would capture the average influenza mortality rate across two different influenza seasons). Finally, I cluster the standard errors at the county level to account for the fact that I use county‐level influenza mortality rates, and therefore there is some correlation at the county level. As sensitivity analyses, two additional versions of the model are presented in Appendix B; in one version, the county‐specific linear time trends are omitted; and in the other model, the influenza‐season year fixed effects is replaced with calendar year fixed effects.
Controls for individual and maternal characteristics
The fact that influenza exposure is assigned at the county level reduces the likelihood that results will be affected by maternal selection. Nevertheless, to address potential confounding from individual‐level selection into conception in specific periods, I include a set of individual‐level covariates . These include the infant's sex and maternal characteristics including age, educational attainment, race, marital status, and tobacco and alcohol use during pregnancy. I also control for a vector of county‐level characteristics () for county c in calendar year y when conception occurs. This vector includes the proportion of the population in the county that is above age 65 (because most influenza/pneumonia‐attributable deaths occur in individuals in that age range), the number of hospitals, and the number of hospital beds. I do not control for the number of active MDs because such data is available for only a fraction of my dataset; however, I do show that my estimation strategy passes a balance test for this variable (see Table 4). I also control for the monthly county unemployment rate ().
Table 4.
Balancing regressions of maternal and county characteristics variables
| Month of influenza Exposure | ||||||||||||||
|---|---|---|---|---|---|---|---|---|---|---|---|---|---|---|
| DependentVariables | Num. obs | Mean dep. Var. | concep | 1 | 2 | 3 | 4 | 5 | 6 | 7 | 8 | 9 | 10 | Joint Test |
| Mother's charac. | ||||||||||||||
| Age a | 27,993,469 | 27.37 | 0.0062 | −0.0022 | −0.0030 | −0.0060 | 0.0012 | 0.0055 | 0.0031 | 0.0020 | −0.0018 | −0.0006 | −0.0099 | 0.00 |
| [0.0073] | [0.0054] | [0.0054] | [0.0049] | [0.0053] | [0.0052] | [0.0053] | [0.0053] | [0.0057] | [0.0060] | [0.0070] | ||||
| −0.0013 | −0.0007 | −0.0001 | 0.0010 | −0.0009 | 0.0002 | −0.0012 | −0.0022 | −0.0019 | −0.0019 | −0.0025 | 0.07 | |||
| [0.001] | [0.0011] | [0.0012] | [0.0011] | [0.0011] | [0.0011] | [0.0012] | [0.0011] | [0.0012] | [0.0012] | [0.001] | ||||
| Education | ||||||||||||||
| less than high school | 27,993,469 | 0.22 | 0.0006 | 0.0005 | 0.0005 | 0.0001 | −0.0004 | −0.0008 | −0.0008 | −0.0004 | 0.0001 | 0.0005 | 0.0012 | 0.00 |
| [0.0008] | [0.0006] | [0.0005] | [0.0005] | [0.0005] | [0.0005] | [0.0005] | [0.0005] | [0.0005] | [0.0006] | [0.0007] | ||||
| 0.0003 | 0.0001 | 0.0002 | 0.0001 | 0.0000 | 0.0001 | 0.0001 | 0.0002 | 0.0005*** | 0.0003* | 0.0004** | 0.00 | |||
| [0.0001] | [0.0001] | [0.0001] | [0.0001] | [0.0001] | [0.0001] | [0.0001] | [0.0001] | [0.0001] | [0.0001] | [0.0001] | ||||
| high school | 27,993,469 | 0.29 | 0.000418 | 0.00081*** | 0.0007*** | 0.00105*** | 0.00064*** | 0.00012 | 0.00024 | 0.00013 | 0.00053** | 0.00077*** | 0.00188*** | 0.00 |
| [0.0003] | [0.0002] | [0.0002] | [0.0002] | [0.0002] | [0.0002] | [0.0002] | [0.0002] | [0.0002] | [0.0002] | [0.0003] | ||||
| 0.0003 | 0.0002 | 0.0000 | 0.0002 | 0.0003 | 0.0003 | 0.0005* | 0.0005** | 0.0006** | 0.0006** | 0.0007** | 0.01 | |||
| [0.0002] | [0.0002] | [0.0002] | [0.0002] | [0.0002] | [0.0002] | [0.0002] | [0.0002] | [0.0002] | [0.0002] | [0.0002] | ||||
| Some college education | 27,993,469 | 0.20 | −0.0004 | −0.0001 | 0.0000 | 0.0000 | 0.0001 | 0.0001 | −0.0001 | −0.0001 | 0.0000 | 0.0001 | 0.0004 | 0.00 |
| [0.0002] | [0.0002] | [0.0002] | [0.0002] | [0.0002] | [0.0002] | [0.0002] | [0.0002] | [0.0002] | [0.0002] | [0.0002] | ||||
| 0.0001 | 0.0001 | 0.0001 | 0.0001 | 0.0000 | 0.0001 | 0.0001 | 0.0001 | 0.0003 | 0.0002 | 0.0004* | 0.78 | |||
| [0.0002] | [0.0001] | [0.0001] | [0.0001] | [0.0001] | [0.0002] | [0.0001] | [0.0002] | [0.0002] | [0.0002] | [0.0002] | ||||
| 16+ years of education | 27,993,469 | 0.24 | −0.0012* | −0.0013** | −0.0011* | −0.0011** | −0.0002 | 0.0004 | 0.0002 | 0.0002 | −0.0005 | −0.0007 | −0.0017** | 0.00 |
| [0.0006] | [0.0004] | [0.0004] | [0.0004] | [0.0004] | [0.0004] | [0.0004] | [0.0004] | [0.0004] | [0.0005] | [0.0006] | ||||
| 0.0001 | 0.0000 | 0.0000 | 0.0001 | 0.0000 | 0.0000 | 0.0001 | 0.0002 | 0.0002 | 0.0003 | 0.0003 | 0.87 | |||
| [0.0002] | [0.0001] | [0.0002] | [0.0002] | [0.0002] | [0.0002] | [0.0002] | [0.0002] | [0.0002] | [0.0002] | [0.0002] | ||||
| White | 27,993,469 | 0.75 | −0.0023** | −0.0015* | −0.0010 | −0.0011* | −0.0007 | −0.0005 | −0.0004 | −0.0010 | −0.0017** | −0.0020*** | −0.0021** | 0.00 |
| [0.0009] | [0.0006] | [0.0006] | [0.0005] | [0.0005] | [0.0005] | [0.0005] | [0.0006] | [0.0006] | [0.0006] | [0.0007] | ||||
| −0.0001 | 0.0000 | 0.0000 | 0.0000 | −0.0001 | −0.0002 | 0.0000 | −0.0002* | 0.0000 | −0.0002** | −0.0001 | 0.03 | |||
| [0.0001] | [0.0001] | [0.0001] | [0.0001] | [0.0001] | [0.0001] | [0.0001] | [0.0001] | [0.0001] | [0.0001] | [0.0001] | ||||
| Black | 27,993,469 | 0.18 | 0.0019* | 0.0014* | 0.0011 | 0.0013* | 0.0007 | 0.0006 | 0.0004 | 0.0011 | 0.0017* | 0.0018** | 0.0020* | 0.00 |
| [0.0009] | [0.0007] | [0.0006] | [0.0006] | [0.0006] | [0.0005] | [0.0005] | [0.0006] | [0.0007] | [0.0007] | [0.0008] | ||||
| 0.0000 | 0.0000 | −0.0001 | 0.0000 | 0.0000 | 0.0001 | 0.0000 | 0.0002* | 0.0000 | 0.0002* | 0.0001 | 0.02 | |||
| [0.0001] | [0.0001] | [0.0001] | [0.0001] | [0.0001] | [0.0001] | [0.0001] | [0.0001] | [0.0001] | [0.0001] | [0.0001] | ||||
| Other Race | 27,993,469 | 0.07 | 0.0005 | 0.0000 | −0.0002 | −0.0003 | 0.0000 | −0.0001 | 0.0000 | 0.0000 | 0.0000 | 0.0001 | 0.0000 | 0.00 |
| [0.0003] | [0.0002] | [0.0002] | [0.0002] | [0.0002] | [0.0002] | [0.0002] | [0.0002] | [0.0003] | [0.0003] | [0.0003] | ||||
| 0.0001 | 0.0001 | 0.0000 | 0.0000 | 0.0000 | 0.0000 | 0.0000 | 0.0001 | 0.0001 | 0.0001 | 0.0001 | 0.87 | |||
| [0.0000] | [0.0000] | [0.0000] | [0.0000] | [0.0000] | [0.0000] | [0.0001] | [0.0001] | [0.0001] | [0.0000] | [0.0000] | ||||
| Married | 27,993,469 | 0.66 | −0.0026*** | −0.0018*** | −0.0017*** | −0.0016*** | −0.0008* | −0.0003 | −0.0003 | −0.0010** | −0.0022*** | −0.0025*** | −0.0023*** | 0.00 |
| [0.0006] | [0.0004] | [0.0004] | [0.0004] | [0.0004] | [0.0003] | [0.0004] | [0.0004] | [0.0004] | [0.0004] | [0.0005] | ||||
| 0.0002 | 0.0001 | 0.0001 | 0.0002 | 0.0002 | 0.0001 | 0.0001 | 0.0003* | 0.0002 | 0.0002 | 0.0002 | 0.43 | |||
| [0.0001] | [0.0001] | [0.0001] | [0.0001] | [0.0001] | [0.0001] | [0.0001] | [0.0001] | [0.0001] | [0.0001] | [0.0001] | ||||
| Drinks Alcohol | 27,993,469 | 0.01 | −0.0001 | 0.0001 | 0.0001* | 0.0002*** | 0.0001* | 0.0001* | 0.0001* | 0.0001* | 0.0002** | 0.0001 | 0.0002** | 0.00 |
| [0.0001] | [0.0001] | [0.0001] | [0.0001] | [0.0000] | [0.0000] | [0.0001] | [0.0001] | [0.0001] | [0.0000] | [0.0001] | ||||
| −0.0001 | 0.0000 | 0.0000 | 0.0000 | 0.0000 | −0.0001 | 0.0000 | 0.0000 | 0.0000 | 0.0000 | 0.0000 | 0.35 | |||
| [0.0001] | [0.0000] | [0.0000] | [0.0001] | [0.0001] | [0.0001] | [0.0000] | [0.0001] | [0.0000] | [0.0000] | [0.0000] | ||||
| Tobacco User | 27,993,469 | 0.08 | 0.0001 | 0.0005 | 0.0007** | 0.0008*** | 0.00054* | 0.00042 | 0.00029 | 0.0003 | 0.0008*** | 0.0007** | 0.00134*** | 0.00 |
| [0.0003] | [0.0003] | [0.0003] | [0.0003] | [0.0002] | [0.0002] | [0.0002] | [0.0002] | [0.0002] | [0.0003] | [0.0004] | ||||
| −0.0001 | −0.0001 | −0.0001 | −0.0001 | −0.0001 | 0.0001 | 0.0001 | 0.0000 | 0.0001 | 0.0001 | 0.0001 | 0.34 | |||
| [0.0001] | [0.0001] | [0.0001] | [0.0001] | [0.0001] | [0.0001] | [0.0001] | [0.0001] | [0.0001] | [0.0001] | [0.0001] | ||||
| County characteristics | ||||||||||||||
| Proportion over 65 years | 27,993,469 | 11.55 | 0.0996*** | 0.0741*** | 0.0758*** | 0.0691*** | 0.0718*** | 0.0688*** | 0.0694*** | 0.0703*** | 0.0825*** | 0.0783*** | 0.0920*** | 0.00 |
| [0.0154] | [0.0115] | [0.0107] | [0.0096] | [0.0101] | [0.0096] | [0.0105] | [0.0100] | [0.0101] | [0.0112] | [0.0131] | ||||
| 0.004489** | 0.00559*** | 0.00693*** | 0.00715*** | 0.00699*** | 0.00592*** | 0.0057*** | 0.00462** | 0.00351* | 0.00348* | 0.00432* | 0.00 | |||
| [0.0017] | [0.0015] | [0.0016] | [0.0018] | [0.0018] | [0.0017] | [0.0016] | [0.0017] | [0.0017] | [0.0016] | [0.0019] | ||||
| Unemployment rate (monthly) | 27,993,469 | 5.28 | 0.0699*** | −0.0163* | 0.0053 | −0.0145* | 0.0060 | 0.0077 | 0.0460*** | 0.0164* | −0.0147 | −0.0056 | 0.0282* | 0.00 |
| [0.0114] | [0.0082] | [0.0079] | [0.0074] | [0.0079] | [0.0076] | [0.0085] | [0.0077] | [0.0081] | [0.0085] | [0.0119] | ||||
| −0.0161* | −0.0081 | −0.0016 | 0.0102 | 0.0019 | −0.0216** | −0.0171** | −0.0158** | −0.0214*** | −0.0207*** | −0.0148* | 0.00 | |||
| [0.0068] | [0.0053] | [0.0059] | [0.0061] | [0.0061] | [0.0069] | [0.0059] | [0.0058] | [0.0060] | [0.0060] | [0.0070] | ||||
| Number of hospitals | 27,993,469 | 27.63 | 0.462 | 0.367 | 0.292 | 0.285 | 0.268 | 0.260 | 0.326 | 0.270 | 0.162 | 0.252 | 0.363 | 0.03 |
| [0.3851] | [0.2764] | [0.2433] | [0.2183] | [0.228] | [0.2243] | [0.2676] | [0.2279] | [0.1580] | [0.2249] | [0.3087] | ||||
| −0.0016 | 0.0185 | 0.0213 | 0.0208 | 0.0183 | 0.0058 | 0.0033 | −0.0022 | −0.0083 | −0.0094 | −0.0091 | 0.31 | |||
| [0.0045] | [0.0056] | [0.0069] | [0.0071] | [0.007] | [0.0059] | [0.0057] | [0.0046] | [0.0035] | [0.0035] | [0.0043] | ||||
| Number of hospital beds | 27,993,469 | 6844 | 139.8 | 108.8 | 90.1 | 89.8 | 85.7 | 81.9 | 98.4 | 84.4 | 66.4 | 82.1 | 112.0 | 0.11 |
| [87.569] | [62.324] | [55.637] | [51.436] | [53.341] | [50.908] | [60.594] | [52.733] | [40.268] | [52.92] | [72.825] | ||||
| −0.4978 | −5.2509 | −4.9473 | −3.4901 | −3.0890 | −1.9905 | −1.2323 | −1.0932 | −1.0445 | −0.5940 | −0.3138 | 0.79 | |||
| [1.8454] | [3.4294] | [3.1815] | [2.7261] | [2.6513] | [2.5953] | [1.8878] | [1.8092] | [1.8198] | [1.6487] | [1.7218] | ||||
| Number of active MDs | 20,758,872 | 5500 | 96.90 | 75.29 | 66.08 | 63.28 | 63.77 | 58.84 | 60.45 | 62.63 | 65.01 | 71.24 | 95.49 | 0.11 |
| [60.794] | [56.999] | [49.466] | [50.356] | [47.918] | [44.648] | [46.027] | [45.964] | [48.053] | [52.967] | [79.394] | ||||
| 1.099 | 1.179 | 1.950 | 1.666 | 1.408 | 1.493 | 1.418 | 0.960 | 1.059 | 1.198 | 1.519 | 0.08 | |||
| [1.439] | [1.4245] | [1.8727] | [1.8914] | [1.7536] | [1.5338] | [1.3465] | [1.3127] | [1.4782] | [1.394] | [1.6771] | ||||
NOTES:
*p<0.05, **p<0.01, ***p<0.001
aAge is modeled as a continuous variable here, while it is modeled as a set of age category dummy variables in my main model. If instead I run a set of five additional (highly correlated) balance regression for each age category, I will probably over reject the null hypothesis.
Balancing tests
The estimated effect of influenza exposure on birth and infant outcomes is given by the coefficients β0 through β10. These will be unbiased estimates of the true effects for each month if there is no omitted‐variable bias (orthogonality assumption). The regression equation does not control for mother fixed effects because the dataset does not contain identifiers that allow mothers to be linked across births. Therefore, the estimated effects might still be affected by mothers selecting into giving birth at specific times based on unobserved variables. Although county fixed effects are included, there could still be time‐varying county characteristics that are correlated with influenza mortality rates and the outcomes. To formally test for this, I run a series of balancing regression tests in which I consider each of the maternal and county characteristics controls as a dependent variable (Pei, Pischke, and Schwandt 2018). I run balancing regression tests with no other controls and then with the full set of other controls and fixed effects. The results of these regressions show the extent to which my estimates would be affected by omitted‐variable bias if I did not control for the balancing variables. Because I do control for the variables used in the balance tests, any imbalance is a concern to the extent that it indicates potential confounding from unobserved variables. Comparing the balancing tests across specifications will also illustrate to what extent my controls and fixed effects eliminate any potential omitted‐variable bias (Pei, Pischke, and Schwandt 2018; Schwandt 2018).
Results
Main model results
The panels in Figure 3a and 3b show the results of the main regression model. The figure shows the estimated effects of one additional ILI death per 100,000 inhabitants on neonatal mortality, infant mortality, gestational age, PTB, birthweight, and LBW, for each month of gestation. The birthweight and LBW results are presented both with and without controls for gestational age. The bars represent the 95% confidence intervals.
Figure 3.
Illustrates the effects of one additional ILI death per 100,000 on birth outcomes
NOTES: The capped lines represent the 95 percent confidence intervals. The y‐axes are oriented so that poor outcomes are always above the zero‐reference line. (***Significant at the 1 percent level. **Significant at the 5 percent level. *Significant at the 10 percent level.)


Statistically‐significant coefficients are labelled with stars: *: p<0.1; **: p<0.05; ***: p<0.001. The results of the joint test of all the influenza exposure coefficients and on the equality of the coefficients are also reported in Figure 3. The influenza exposure coefficients were jointly significant for all of the outcomes studied (at p<0.1 for LBW with gestational age controls; and at p<0.05 for all other outcomes). The y‐axes on all of the panels are oriented so that the negative outcomes are above the zero‐reference line and positive outcomes are below. For instance, the first panel shows the change in risk of neonatal mortality for different gestation months as a result of one additional ILI death per 100,000. The only two significant coefficients are for the conception month and six months after conception. Each increase in the ILI mortality rate per 100,000 around month of conception is associated with an increase in the neonatal mortality rate by 0.0027 percentage points; a one‐unit increase in ILI mortality rates six months after conception is associated with a 0.0028 percentage point decrease in risk of neonatal death.
In Appendix B, these same results (Main model) are presented against the results from a model in which, as described above, county‐specific linear time trends are omitted (Model 1) and a model in which the influenza‐season year fixed effects are replaced by calendar year fixed effects (Model 2).
Effects of variation in ILI mortality rates
The coefficients plotted in Figure 3 are for a single additional ILI death per 100,000 people, but pregnant women are often exposed to much larger changes in ILI death rates. To show how these changes affect infant health outcomes, I multiply the coefficients by the changes in ILI rates to which the pregnant women are exposed. For each of the 231 counties in my sample, I calculate the interquartile range (IQR) in January influenza mortality rates (a peak influenza month) and in August (a trough month). I also calculate the range (maximum minus minimum) of the January and August influenza mortality rates. For a given county, the IQR represents the difference between a moderately severe epidemic and a relatively mild one (which I call moderate exposure changes), whereas the range captures the difference between an extreme epidemic and a very mild one (which I call extreme exposure changes). Even the extreme exposure changes are relatively common: over the 14 years in the dataset, every county has births exposed to both the mildest and most extreme influenza epidemic.
Table 2 presents the population‐weighted distribution of the IQR and the range across counties. On average, women in the sample experience a January IQR of 2.10. This means that moving from the 25th to 75th percentile year (a moderate exposure change) exposes the average pregnant woman to 2.10 additional deaths per 100,000 population. An extreme exposure change, in contrast, exposes the average woman to 10.57 additional influenza deaths per 100,000 in January. The moderate and extreme exposure changes in influenza mortality rates are much smaller if we look at August rates (Table 2). Next, I use the mean outcomes experienced by women in the sample to calculate the percent change in each outcome due to these changes in ILI exposure (Noble 2014). For instance, on average, the percent change in one of my outcomes from influenza exposure around conception is:
| (2) |
Table 2.
Distribution of influenza mortality IQR and range across counties (1988–2004)
| January | August | |||
|---|---|---|---|---|
| Percentile | IQR | Range | IQR | Range |
| 1 | 0.89 | 4.76 | 0.24 | 1.18 |
| 25 | 1.66 | 8.87 | 0.83 | 2.52 |
| 50 | 2.05 | 10.51 | 1.18 | 3.26 |
| Mean | 2.10 | 10.57 | 1.23 | 3.38 |
| 75 | 2.48 | 12.23 | 1.53 | 4.13 |
| 99 | 3.61 | 18.73 | 2.69 | 6.68 |
Table 3 contains the main outcomes as well as their sample means. For each outcome, I list the vulnerable months of gestation and the associated coefficients (p<0.05) which represent the impact of one additional ILI death per 100,000 population (these coefficients are the same as the starred results in Figure 3). The table also contains the mean county IQR and range of January ILI mortality rates (obtained from Table 2). Finally, it shows the population‐average and treatment‐on‐treated effects as well as the percent change in each outcome as a result of moderate and extreme exposure changes in January ILI mortality rates.
Table 3.
Summary of the effect of in utero exposure during vulnerable months of gestation (p<0.05) to influenza on the different birth outcomes
| Moderate Exposure Changes in January | Extreme Exposure Changes in January | ||||||||||||
|---|---|---|---|---|---|---|---|---|---|---|---|---|---|
| Pop. Avg. | ToT | Pop. Avg. | ToT | ||||||||||
| Outcome | Mean | Sig. month | Coeff. | IQR | Effect | Pct. Chg. | Effect | Pct. Chg. | Range | Effect | Pct. Chg. | Effect | Pct. Chg. |
| Neonatal Mortality | 0.004 | C | 0.00003 | 2.10 | 0.00006 | 1.53% | 0.00186 | 50.39% | 10.57 | 0.00028 | 7.67% | 0.00935 | 253.09% |
| c + 6 | −0.00003 | −0.00006 | −1.62% | −0.00197 | −53.39% | −0.00030 | −8.13% | −0.00991 | −268.20% | ||||
| Infant mortality | 0.006 | C | 0.00004 | 2.10 | 0.00008 | 1.40% | 0.00267 | 46.10% | 10.57 | 0.00041 | 7.02% | 0.01343 | 231.54% |
| c + 2 | 0.00003 | 0.00007 | 1.23% | 0.00235 | 40.59% | 0.00036 | 6.18% | 0.01183 | 203.87% | ||||
| c + 6 | −0.00005 | −0.00010 | −1.77% | −0.00339 | −58.43% | −0.00052 | −8.89% | −0.01702 | −293.48% | ||||
| BW (grams) | 3,343 | c + 9 | −0.65 | 2.10 | −1.36 | −0.04% | −44.80 | −1.34% | 10.57 | −6.82 | −0.20% | −225.04 | −6.73% |
| LBW | 0.061 | c + 7 | 0.00010 | 2.10 | 0.00020 | 0.33% | 0.00669 | 10.96% | 10.57 | 0.00102 | 1.67% | 0.03359 | 55.07% |
| c + 9 | 0.00014 | 0.00028 | 0.47% | 0.00938 | 15.37% | 0.00143 | 2.34% | 0.04709 | 77.20% | ||||
| Gest. Age (wks) | 38.9 | c + 2 | −0.0013 | 2.10 | −0.003 | −0.01% | −0.091 | −0.23% | 10.57 | −0.014 | −0.04% | −0.456 | −1.17% |
| c + 9 | −0.0028 | −0.006 | −0.02% | −0.194 | −0.50% | −0.029 | −0.08% | −0.973 | −2.50% | ||||
| c + 10 | −0.0018 | −0.004 | −0.01% | −0.127 | −0.33% | −0.019 | −0.05% | −0.639 | −1.64% | ||||
| last 2 months | −0.0046 | −0.010 | −0.02% | −0.321 | −0.82% | −0.049 | −0.13% | −1.612 | −4.14% | ||||
| PTB | 0.102 | c + 1 | 0.000143 | 2.10 | 0.00030 | 0.30% | 0.00992 | 9.77% | 10.57 | 0.00151 | 1.49% | 0.04981 | 49.05% |
| c + 9 | 0.00023 | 0.00048 | 0.47% | 0.01590 | 15.66% | 0.00242 | 2.38% | 0.07989 | 78.66% | ||||
NOTES:
c is for conception month
last 2 months = c + 9 and c + 10
Population average effects as result of moderate and extreme exposure changes
In utero exposure to influenza around the conception month (when organs and vital function are developing in the embryonic stage) is associated with increased risk of neonatal mortality and infant mortality. If conception takes place in January, then on average, a moderate exposure change (the difference between a 25th and 75th percentile year) results in a 1.53 percent increase in the neonatal and 1.40 percent increase in the infant mortality rates. An extreme exposure change in January rates, on average, results in a 7.67 percent increase in the neonatal and 7.02 percent increase in the infant mortality rates. These effects, as hypothesized, vary by conception month. For instance, a moderate exposure change for August conceptions only increases neonatal mortality rates by 0.89 percent and infant mortality rates by 0.81 percent. An extreme exposure change for August conceptions rates increases neonatal mortality by 2.45 percent and infant mortality by 2.24 percent. Exposure six months after conception appears to be associated with increased neonatal and infant survival rates.
Infants exposed to influenza in utero have lower mean birthweights on average, but only if the exposure occurred nine months after conception (p<0.001). The same pattern holds if gestational age is controlled for. On average, if the ninth month after conception is January, then an extreme exposure change decreases the mean birthweight by 6.8 grams (0.20 percent). The probability of LBW also increases if exposure occurs nine months after conception, but that effect disappears after controlling for gestational age. These LBW infants are small because they are most likely born preterm. On average, if the ninth month after conception is January, then exposure to moderate exposure changes increases the probability of LBW by 0.47 percent; an extreme exposure change increases the probability of LBW by 2.34 percent.
Mean gestational age increases as a result of exposure around conception (p<0.1)) but decreases as a result of exposure in the last two months of gestation. If the last two months of gestation are January and February, then on average, an extreme exposure change during these months decreases the mean gestational age by 0.05 weeks (approximately 8 hours) or 0.13 percent. This decrease may appear small but is a large fraction of the variation in mean gestational age by conception month (see Figure 1 and Currie and Schwandt (2013)); it is also important to recall that these are population average effects which underestimate the true effect. The fact that exposure to influenza early in gestation is associated with longer gestational age at birth could be the result of selective survival—more frail fetuses might have been miscarried after being exposed to influenza.
The risk of PTB increases for infants exposed one month after conception and nine months after conception. PTB infants born nine months after conception are likely just shy of 37 weeks of gestation. If the birth month is January, then being exposed to extreme exposure changes in January ILI mortality rates increases the risk of PTB on average by 2.38 percent.
Treatment on the treated effects as result of moderate and extreme exposure changes
The above estimates ascribe changes in ILI mortality to all women in a county, but only a small fraction of women would actually experience additional ILI infections as a result of one additional ILI death per 100,000. Consider a case where only 1 percent of women are actually infected with influenza. Then if the population average effect is , the infected women would need to experience an effect of 100 x to generate that average effect. Thus, to better quantify the effect of in utero influenza exposure, I estimate treatment‐on‐treated (ToT) effects, conservatively assuming that each additional influenza death per 100,000 is associated with 3,000 cases of influenza per 100,000. This figure comes from dividing the high end of the range of annual estimated cases of influenza (35.6 million) by the low end of the range of deaths (12,000), based on data from the CDC (CDC 2018; Rolfes et al. 2018). I do not assume that the women in my sample are at increased or lower risk of catching influenza compared to the overall population (Lemaitre and Carrat 2010; Caini et al. 2018). Studies indicate that the influenza relative illness ratio (RIR)—defined as the ratio of the percentage of influenza cases in a given age group to the percentage of the general population belonging to the same age group—for adults 18–49 is just below or about one (Caini et al. 2018). If the RIR for an age group is greater than one, then individuals in that age group have a higher chance of being infected compared to the general population. If the RIR for pregnant women is less than one, then an even bigger scaling factor would be required. Together, these calculations imply that a conservative scaling factor of at least 33 should be applied to my population average effects to convert them to ToT effects.
On average, for January conceptions whose mothers contracted influenza as a result of experiencing moderate exposure changes in ILI rates (ToT effects), the neonatal mortality rate increases by 50.39 percent and the infant mortality rates increase by 46.10 percent, and both more than double as a result to extreme exposure changes.
The ToT effects of moderate exposure changes nine months after conception are a 44.8 gram (1.34 percent) decrease in mean birthweight; for an extreme exposure change the effect is 225 grams (6.73 percent). Both these figures use exposures for the peak influenza month of January. These same effects would be smaller; we instead used exposure changes for August (a mean birthweight decline of 26 grams after moderate exposure changes and decline of 72 grams after extreme exposure changes).
The ToT effects resulting from moderate exposure changes in ILI rates nine months after conception are associated with an increase in risk of LBW by 15.37 percent or 0.94 percentage points if that vulnerable period is in January. The ToT effects indicate a 77.20 percent (4.71 percentage point) increase in the risk of LBW as a result of extreme exposure changes for January ILI mortality levels.
If extreme exposure changes take place during the last two months of gestation, and these months are January and February, then the ToT estimates indicate a decline in gestational age by 1.6 weeks; the decline in gestational age is about one third of a week if exposed to moderate exposure changes. For pregnancies that end in January, the ToT effect from a moderate exposure change in the last month of gestation is an increase in the likelihood of PTB by 1.59 percentage points (15.66 percent); the corresponding effect for an extreme exposure change is 7.99 percentage points (78.66 percent).
Seasonality in health at birth
The combination of differential exposure to influenza based on conception month, together with the small windows during which in utero exposure to influenza significantly impacts neonatal and infant health, means that influenza exposure partly explains seasonality in health at birth for these outcomes.
Sensitivity analyses and falsification tests
To verify that estimated treatment effects are driven by influenza exposure, and not other omitted factors, I separately analyze the impact of in utero influenza exposure on infant deaths due congenital abnormalities and injury or poisoning. As expected, in utero influenza exposure has an impact on risk of dying from congenital abnormalities (joint test of significance p = 0.0123 and joint test of equality p = 0.0092). Specifically, exposure around the conception month (month of conception and one month after conception) is associated with an increase in risk of infant death due to congenital abnormalities. Exposure six months after conception is associated with a decreased risk of dying from congenital abnormalities, which might be due to selective survival. In contrast, in utero influenza exposure does not have an overall effect on risk of dying from injury (joint test of significance p = 0.3549 joint test of equality p = 0.3465). Exposure to influenza 10 months after conception does have a small negative effect on the risk of dying due to injury, but this could be a spurious correlation given the overall null results. This is a useful falsification test for my main results.
I find similar results if, instead of using both influenza and pneumonia mortality rates as a measure of influenza exposure, I use the influenza mortality rate alone (Appendices C and D). The similarities indicate that, in the main model, variation in winter mortality rates is driving the results. I also run a sensitivity test in which I use the influenza/pneumonia mortality “rate” for those individuals aged 65 and older (I divide by the entire population size, not just the population 65 plus), making it mechanically impossible for a given influenza death to be on both the right and left hand side of the equation; this is specifically relevant for the analyses of neonatal and infant mortality. One disadvantage of this approach, however, is that this measure of influenza exposure underestimates the strength of exposure for epidemics associated with mortality at younger ages. The results from this specification are nearly identical to my main results (Appendix E).
Balancing test results
It is important to remember that the variable of interest, influenza exposure, is captured at the county level, mitigating individual‐level selection into exposure (on the reasonable assumption that people do not elect to change their residence based on variations in the strength of seasonal influenza epidemics). This means that we are most interested in balance regression results for the county‐level characteristics. Table 4 contains the results of the balancing regressions of the maternal and county characteristics. For each variable of interest, the first row of coefficients displays results from the regression without any controls and the second row shows the results after adding the controls and fixed effects. Since my main specification controls for all observed characteristics, I have perfect balance by construction on all of the variables in this table.
To shed light on the potential degree of imbalance on other, unobserved variables, I omit the characteristic in question from the set of controls when estimating the coefficients in the second row of each table. For example, I omit the county unemployment rate from the set of controls when evaluating balance on the county unemployment rate, and I omit all the age category indicators when evaluating balance on age. The results indicate small amounts of imbalance on unobserved characteristics. There is no omitted‐variable problem for any of the variables reported in Table 4, because I control for all observed characteristics in the regression (the one exception is the number of active MDs, which is only available for part of the time period and thus is not included as a control in my analyses; this variable appears to be well‐balanced with respect to influenza mortality). The balance regression tests on some of the dummy categorical variables (e.g. education levels dummy variables, race dummy variables) are all highly correlated and hence could lead to probable over‐rejection of the null hypothesis. Nevertheless, some variables are slightly imbalanced when they are omitted from the set of controls in my estimation equation, but these differences are small. Each unit increase in the influenza mortality rate during each month in the last trimester of gestation is associated with a slight (0.03–0.05 percentage point) increase in the probability that the mother has not finished high school, with similar patterns for mothers whose highest completed level of education is high school. An increase in the influenza mortality rate is associated with increase in the proportion of the county with population over 65 years; this is expected, since the majority of influenza deaths are among these individuals. Increased exposure to influenza during the second half of pregnancy is associated with lower county‐level unemployment rate, in line with research by Adda (2016) who finds that epidemics spread faster during economic booms and related to research that finds mortality declines during recessions, in part, because of changes in health behavior (Ruhm 2000). Therefore, the negative correlation between influenza mortality and unemployment may mean that the analysis suffers from omitted‐variable biases related to health behaviors and contact patterns. This probably makes the estimates biased toward zero. Unemployment, which is negatively correlated with influenza exposure, is associated with worse maternal and birth outcomes (Raatikainen, Heiskanen, and Heinonen 2006; Margerison‐Zilko, Li, and Luo 2017).
Discussion and policy implications
This is the first study to use US‐wide data to explore the extent to which the timing of influenza exposure matters for fetal development. Its findings are most similar to Schwandt (2018), who studies the effects of in utero exposure to influenza on short‐ and longer‐term outcomes in Danish cohorts born between 1980 and 1993. I find that exposure during the first trimester is associated with increased risk of neonatal and infant mortality but lower rates of PTB and longer gestational ages. These results are in line with the finding that miscarriages increase as a result of first trimester influenza exposure (Bloom‐Feshbach et al. 2011; Schwandt 2018).
Results indicate that second‐trimester exposure is associated with a lower risk of neonatal and infant mortality. This may be due to selective survival due to unobserved fetal loss. They indicate, as well, that exposure in the second trimester is associated with increased risk of LBW (Figure 3b). These unexpected negative second trimester effects could be due to indirect effects of influenza exposure such as maternal stress which could cause alterations to the hypothalamic‐pituitary adrenal axis and associated stress regulators. Class et al. (2011) find that maternal stress from loss of a close relative during the second trimester is associated with lower gestational age, increased risk of PTB, LBW, and the newborn being small for gestational age. Hence, the negative impacts during the second trimester could be related to losing a grandparent due to influenza.
Finally, this analysis has found that third‐trimester exposure is associated with lower gestational age and birthweights and increased risks of PTB and LBW. The effects on birthweight are mostly tied to gestational age. These third trimester results are once again in line with Schwandt (2018) and in agreement with the literature on the benefits of maternal influenza immunization on decreasing the risk of PTB and small‐for‐gestational‐age births (Omer et al. 2011; Steinhoff et al. 2012; Richards et al. 2013).
Effect size
The magnitude of birthweight results after extreme exposure changes, which are lower‐bound population average effects, are smaller than the population average effects reported in studies of the effect of non‐infectious in utero exposures—such as the effects of weather and fasting holidays like Ramadan on infant outcomes (Deschênes, Greenstone, and Guryan 2009; Almond and Mazumder 2011).
The scaling factor of 33 used here to convert population average effects to ToT effects is conservative because it likely overestimates the ratio of influenza cases to influenza deaths and the probability that a pregnant women contracts influenza. The conservativeness of this scaling factor is further supported by the fact that Schwandt (2018) estimated a ratio of 50–80 (depending on the birth outcome) when he compared the effects from his analyses with actual information on maternal influenza infection (micro‐level estimates) to the results from his cohort‐level estimates (similar to my population average effects).
The ToT effects found here are large and meaningful. For example, moderate exposure changes can increase the infant mortality rate from 6 per 1000 to 8 per 1000 and extreme exposure changes could increase the infant mortality rate from 6 to 19 per 1000 if the vulnerable period occurs during a peak influenza month (Table 3). While the impacts of moderate exposure changes are less than the magnitude of the US black‐white disparities in infant mortality and PTB during this period; extreme exposure changes can result in differences that are in the same order of magnitude if not larger (Rossen and Schoendorf 2014). These striking findings are not unprecedented: Schwandt (2018) finds that maternal influenza infection about doubles the risk of PTB and LBW.
Limitations
The NCHS birth datasets provide birth month, but not birth dates, and so some of the differences due to conception month might be lost in the resulting analysis. The data did not contain mother identifiers, so it was impossible to completely control for maternal selection; however, this is not a major concern because Currie and Schwandt (2013) showed that seasonal patterns in birth outcomes were not driven by maternal selection in the US. Maternal selection is also less of a concern because the exposure used was assigned at the county level. The estimates are likely attenuated toward zero because the balance regression tests identified potential selection concerns that are correlated with monthly county‐level unemployment rates. This specific omitted‐variable bias would tend to operate in the opposite direction of the findings reported here.
The dataset employed here only contains information on conceptions resulting in live births; therefore, there is some survivor bias, and I cannot directly test whether in utero influenza exposure might have resulted in fetal loss or miscarriage.
Not all of the effects of in utero exposure to influenza are identified; there are possible latent health, educational, and labor effects (Almond and Currie 2011; Kelly 2011; Schwandt 2018). For instance, using a twin, fixed‐effects analysis, Black et al. (2007) find that a 10 percent increase in birthweight increases the high school completion rate by a little less than one percentage point and increases full‐time earnings by 1 percent. I estimate that extreme changes in influenza exposure in January would decrease birthweights by an average of about 7 percent for infants whose mothers who fall ill; this would imply a decline in full‐time earnings of 0.7 percent for those children. This study does not identify the specific biological mechanisms by which influenza affects fetal development and growth, but the fact that there are differences in critical periods of gestation with regard to different outcomes indicates that in utero exposure to influenza affects the fetus through multiple mechanisms.
A final concern centers on the influence of influenza vaccination on in utero exposure effects. Fortunately, data used in this study are from a time period with low levels of vaccinations among pregnant women. Vaccination rates in the US have increased from 4 percent in the late 1980s; however, by 2005, vaccination rates in the population of pregnant women had only reached 15.6 percent (CDC 2015). Given that, as discussed above, the influenza virus is highly adaptable and vaccine efficacy varies from year to year (as the vaccine's target strain is forecasted and cannot be predicted with perfect accuracy), even being vaccinated does not always confer protection against contraction. Consequently, the pregnant population at risk of infection was, in this study, large.
Policy implications
In conclusion, in the US, part of the reason for seasonal patterns in health at birth is differential exposure to infectious diseases such as influenza. Consequently, disease exposure should be considered alongside environmental measures like ambient temperature and air pollution in analyses of seasonality of health at birth. The results of this study support a push for stronger recommendations that women planning their pregnancies should be vaccinated prior to becoming pregnant. Even the earliest exposure to the influenza virus can be harmful to the fetus. Furthermore, since it is possible to get influenza during the off‐season, women at risk of pregnancy should always be up to date on their influenza vaccination.
Supporting information
APPENDIX A Flowchart illustrating the steps used to created dataset for analysis
APPENDIX B The effects of one additional ILI death per 100,000 on birth outcomes
APPENDIX C Time series graph illustrating the spatial and temporal variation in magnitude of influenza mortality rates between 1988 and 2004 by Health and Human Service region
APPENDIX D This figure illustrates the effect of one additional influenza death per 100,000 during each month of gestation on different health outcomes.
APPENDIX E The effects of one additional ILI death per 100,000 on birth outcomes
Acknowledgements
Financial support was provided by the Robert Wood Johnson Foundation Health & Society Scholars program and from a National Institute of Child Health and Human Development Grant No. R24HD041023, to the Minnesota Population Center at the University of Minnesota. I am grateful to seminar participants at the Robert Wood Johnson Foundation Health & Society Scholars 2014 annual meeting, Minnesota Population Center Friday Workshop, Center for Studies in Demography and Ecology at the University of Washington, and Demography Brown Bag at UC Berkley. I would like to thank Alan Barreca for sharing Stata code related to the NCHS Multiple Cause of Death Files. I would also like to thank Jason Kerwin, Caroline Krafft, Marina Gorsuch, Ragui Assaad, Rob Warren, Evan Roberts, Nicole Basta, Jon Zelner, Jonas Helgertz, and Justene Hill for their helpful comments on earlier versions of this paper. Finally, I would like to thank the three anonymous reviewers and for their critical and thoughtful comments.
References
- Adda, Jérôme . 2016. “Economic Activity and the Spread of Viral Diseases: Evidence from High Frequency Data.” The Quarterly Journal of Economics 131(2): 891–941. [Google Scholar]
- Almond, Douglas . 2006. “Is the 1918 influenza pandemic over? Long‐term effects of in utero influenza exposure in the post‐1940 US population.” Journal of Political Economy 114(4): 672–712. [Google Scholar]
- Almond, Douglas and Mazumder Bhashkar. 2011. “Health Capital and the Prenatal Environment: The Effect of Ramadan Observance during Pregnancy.” American Economic Journal: Applied Economics 3(4): 56–85. [Google Scholar]
- Almond, Douglas and Currie Janet. 2011. “Killing Me Softly: The Fetal Origins Hypothesis.” The Journal of Economic Perspectives 25(3): 153–172. [DOI] [PMC free article] [PubMed] [Google Scholar]
- Area Health Resources Files (AHRF) . 2016–2017. US Department of Health and Human Services, Health Resources and Services Administration, Bureau of Health Workforce, Rockville, MD.
- Barreca, Alan I. and Shimshack Jay P.. 2012. “Absolute Humidity, Temperature, and Influenza Mortality: 30 Years of County‐Level Evidence from the United States.” American Journal of Epidemiology 176(Supplement 7): S114–S122. [DOI] [PubMed] [Google Scholar]
- Bell, Michelle L. , Ebisu Keita, and Belanger Kathleen. 2007. “Ambient Air Pollution and Low Birth Weight in Connecticut and Massachusetts.” Environmental Health Perspectives 115(7): 1118–1124. [DOI] [PMC free article] [PubMed] [Google Scholar]
- Black, Sandra E. , Devereux Paul J., and Salvanes Kjell G.. 2007. “From the cradle to the labor market? The effect of birth weight on adult outcomes.” The Quarterly Journal of Economics 122(1): 409–439. [Google Scholar]
- Bloom‐Feshbach, Kimberly , Simonsen Lone, Viboud C´ecile, Mølbak Kåre, Miller Mark A, Gottfredsson Magnus, and Andreasen Viggo. 2011. “Natality decline and miscarriages associated with the 1918 influenza pandemic: the Scandinavian and United States experiences.” Journal of Infectious Diseases 204(8): 1157–1164. [DOI] [PMC free article] [PubMed] [Google Scholar]
- Buckles, Kasey S. and Hungerman Daniel M.. 2013. “Season of Birth and Later Outcomes: Old Questions, New Answers.” Review of Economics and Statistics 95(3): 711–724. [DOI] [PMC free article] [PubMed] [Google Scholar]
- Bureau of Labor Statistics, Local Area Unemployment Statistics . Data retrieved from https://download.bls.gov/pub/time.series/la/la.data.64.County accessed June 27, 2018.
- Caini, Saverio , Spreeuwenberg Peter, Kusznierz Gabriela F., Manuel Rudi Juan, Owen Rhonda, Pennington Kate, Wangchuk Sonam, et al. 2018. “Distribution of influenza virus types by age using case‐based global surveillance data from twenty‐nine countries, 1999–2014.” BMC infectious diseases 18(1): 269. [DOI] [PMC free article] [PubMed] [Google Scholar]
- Carrat, Fabrice , Vergu Elisabeta, Ferguson Neil M., Lemaitre Magali, Cauchemez Simon, Leach Steve, and Valleron Alain‐Jacques. 2008. “Time Lines of Infection and Disease in Human Influenza: A Review of Volunteer Challenge Studies.” American Journal of Epidemiology 167(7): 775–785. [DOI] [PubMed] [Google Scholar]
- CDC . 2018. “Disease Burden of Influenza.” Accessed August 22, 2018. https://www.cdc.gov/flu/about/disease/burden.htm,
- CDC . 2017. “Overview of Influenza Surveillance in the United States.” Accessed August 22, 2018. http://www.cdc.gov/flu/weekly/overview.htm.
- CDC . 2015. “Table: Self‐reported influenza vaccination coverage trends 1989–2008 among adults by age group, risk group, race/ethnicity, health‐care worker status, and pregnancy status, United States, National Health Interview Survey (NHIS).” Accessed August 28, 2018, https://www.cdc.gov/flu/pdf/professionals/nhis89_08fluvaxtrendtab.pdf.
- Class, Quetzal A. , Lichtenstein Paul, Långström Niklas, and D'onofrio Brian M.. 2011. “Timing of prenatal maternal exposure to severe life events and adverse pregnancy outcomes: a population study of 2.6 million pregnancies.” Psychosomatic Medicine 73(3): 234–241. [DOI] [PMC free article] [PubMed] [Google Scholar]
- Correia, Sergio . 2014. REGHDFE: Stata module to perform linear or instrumental‐variable regression absorbing any number of high‐dimensional fixed effects. Technical report, Boston College Department of Economics.
- Cox, Shanna , Posner Samuel F., McPheeters Melissa, Jamieson Denise J., Kourtis Athena P., and Meikle Susan. 2006. “Hospitalizations With Respiratory Illness Among Pregnant Women During Influenza Season.” Obstetrics & Gynecology 107(6): 1315–1322. [DOI] [PubMed] [Google Scholar]
- Currie, Janet and Schwandt Hannes. 2013. “Within‐mother analysis of seasonal patterns in health at birth.” Proceedings of the National Academy of Sciences 110(30): 12265–12270. [DOI] [PMC free article] [PubMed] [Google Scholar]
- Curtin, Sally C. , Abma Joyce C., Ventura Stephanie J., and Henshaw Stanley K.. 2013. “Pregnancy rates for US women continue to drop.” NCHS Data Brief 136: 1–8. Hyattsville, MD: National Center for Health Statistics. [PubMed] [Google Scholar]
- Denoeud, Lise , Turbelin Clément, Ansart Séverine, Valleron Alain‐Jacques, Flahault Antoine, and Carrat Fabrice. 2007. “Predicting pneumonia and influenza mortality from morbidity data.” PLoS ONE 2(5): e464. [DOI] [PMC free article] [PubMed] [Google Scholar]
- Deschênes, Olivier , Greenstone Michael, and Guryan Jonathan. 2009. “Climate Change and Birth Weight.” The American Economic Review 99(2): 211–217. [DOI] [PubMed] [Google Scholar]
- Doblhammer, Gabriele and Vaupel James W.. 2001. “Lifespan depends on month of birth.” Proceedings of the National Academy of Sciences 98(5): 2934–2939. [DOI] [PMC free article] [PubMed] [Google Scholar]
- Dodds, Linda , McNeil Shelly A., Fell Deshayne B., Allen Victoria M., Coombs Ann, Scott Jeffrey, and MacDonald Noni. 2007. “Impact of influenza exposure on rates of hospital admissions and physician visits because of respiratory illness among pregnant women.” Canadian Medical Association Journal 176(4): 463–468. [DOI] [PMC free article] [PubMed] [Google Scholar]
- Dorélien, Audrey M. 2015. “Effects of Birth Month on Child Health and Survival in Sub‐Saharan Africa.” Biodemography and Social Biology 61(2): 209–230. [DOI] [PMC free article] [PubMed] [Google Scholar]
- Dushoff, Jonathan , Plotkin Joshua B., Viboud Cecile, Earn David J.D., and Simonsen Lone. 2006. “Mortality due to Influenza in the United States—An Annualized Regression Approach Using Multiple‐Cause Mortality Data.” American Journal of Epidemiology 163(2): 181–187. [DOI] [PubMed] [Google Scholar]
- Eastman, Paris R. 1945. “Infant mortality in relation to month of birth.” American Journal of Public Health and the Nation's Health 35(9): 913–922. [DOI] [PMC free article] [PubMed] [Google Scholar]
- Fan, Wen , and Qian Yue. 2015. “Long‐term health and socioeconomic consequences of early‐life exposure to the 1959–1961 Chinese Famine.” Social Science Research 49: 53–69. [DOI] [PubMed] [Google Scholar]
- Fell, Deshayne B. , Savitz David, Kramer Michael S., Gessner Bradford, Katz Mark, Knight Marian, Luteijn Johannes, Marshall Helen, Bhat Niranjan, Gravett Michael, et al. 2017. “Maternal influenza and birth outcomes: systematic review of comparative studies.” BJOG: An International Journal of Obstetrics & Gynaecology 124(1): 48–59. [DOI] [PMC free article] [PubMed] [Google Scholar]
- Fell, Deshayne B. , Buckeridge David L., Platt Robert W., Kaufman Jay S., Basso Olga, and Wilson Kumanan. 2016. “Circulating influenza virus and adverse pregnancy outcomes: a time‐series study.” American Journal of Epidemiology 184(3): 163–175. [DOI] [PMC free article] [PubMed] [Google Scholar]
- Glezen, W. Paul , Payne Ardath A., Snyder Dorothy Nelson, and Downs Tom D.. 1982. “Mortality and influenza.” Journal of Infectious Diseases 146(3): 313–321. [DOI] [PubMed] [Google Scholar]
- Gluckman, Peter D. , Hanson Mark A., Cooper Cyrus, and Thornburg Kent L.. 2008. “Effect of In Utero and Early‐Life Conditions on Adult Health and Disease.” New England Journal of Medicine 359(1): 61–73. [DOI] [PMC free article] [PubMed] [Google Scholar]
- Greene, Sharon K. , Ionides Edward L., and Wilson Mark L.. 2006. “Patterns of Influenza‐associated Mortality among US Elderly by Geographic Region and Virus Subtype, 1968–1998.” American Journal of Epidemiology 163(4): 316–326. [DOI] [PubMed] [Google Scholar]
- Håberg, Siri E. , Trogstad Lill, Gunnes Nina, Wilcox Allen J., Gjessing Håkon K., Samuelsen Sven Ove, Skrondal Anders, et al. 2013. “Risk of Fetal Death after Pandemic Influenza Virus Infection or Vaccination.” New England Journal of Medicine 368(4): 333–340. [DOI] [PMC free article] [PubMed] [Google Scholar]
- Huber, Susanne , Fieder Martin, Wallner Bernard, Moser Gerit, and Arnold Walter. 2004. Brief communication: Birth month influences reproductive performance in contemporary women. Human Reproduction 19 (5): 1081–82. 10.1093/humrep/deh247 [DOI] [PubMed] [Google Scholar]
- Kelly, Elaine . 2011. “The Scourge of Asian Flu In Utero Exposure to Pandemic Influenza and the Development of a Cohort of British Children.” Journal of Human Resources 46(4): 669–694. [Google Scholar]
- Kourtis, Athena P. , Read Jennifer S., and Jamieson Denise J.. 2014. “Pregnancy and Infection.” New England Journal of Medicine 370(23): 2211–2218. [DOI] [PMC free article] [PubMed] [Google Scholar]
- Lam, David A. and Miron Jeffrey A.. 1991. “Seasonality of births in human populations.” Social Biology 38(1–2): 51–78. [DOI] [PubMed] [Google Scholar]
- Legge, Alexandra , Dodds Linda, MacDonald Noni E., Scott Jeffrey, and McNeil Shelly. 2014. “Rates and determinants of seasonal influenza vaccination in pregnancy and association with neonatal outcomes.” Canadian Medical Association Journal 186(4): E157–E164. [DOI] [PMC free article] [PubMed] [Google Scholar]
- Lemaitre, Magali and Carrat Fabrice. 2010. “Comparative age distribution of influenza morbidity and mortality during seasonal influenza epidemics and the 2009 H1N1 pandemic.” BMC Infectious Diseases 10(1): 162. [DOI] [PMC free article] [PubMed] [Google Scholar]
- MacDorman, Marian and Gregory Elizabeth. 2015. “Fetal and perinatal mortality: United States, 2013.” National Vital Statistics Reports from the Centers for Disease Control and Prevention, National Center for Health Statistics, National Vital Statistics System 64(8): 1–24. [PubMed] [Google Scholar]
- Margerison‐Zilko, Claire E. , Li Yu, and Luo Zhehui. 2017. “Economic conditions during pregnancy and adverse birth outcomes among singleton live births in the United States, 1990–2013.” American Journal of Epidemiology 186(10): 1131–1139. [DOI] [PMC free article] [PubMed] [Google Scholar]
- Martin, Joyce A. and Hoyert Donna L.. 2002. “The national fetal death file.” In Seminars in Perinatalogy 26(1): 3–11. [DOI] [PubMed] [Google Scholar]
- Miller, Elizabeth , Cradock‐Watson John E., and Pollock Thomas M.. 1982. Consequences of confirmed maternal rubella at successive stages of pregnancy. Lancet 320(8302): 781–784. 10.1016/S0140-6736(82)92677-0. [DOI] [PubMed] [Google Scholar]
- Moniz, Michelle H. and Beigi Richard H.. 2013. “Influenza infection during pregnancy: virology, pathogenesis and clinical challenges.” Future Virology 8(1): 11–23. [Google Scholar]
- Moore Keith L. and Persaud T. V. N.. 1993. The Developing Human: Clinically Oriented Embryology 5th edition Philadelphia: W.B. Saunders Company. [Google Scholar]
- Moore, Sophie E. , Cole Timothy J., Poskitt Elizabeth M. E., Sonko Bakary J., Whitehead Roger G., McGregor Ian A., and Prentice Andrew M.. 1997. “Season of birth predicts mortality in rural Gambia.” Nature 388(6641): 434–434. 10.1038/41245. [DOI] [PubMed] [Google Scholar]
- Murray, Liam J. , O'Reilly Dermot P.J., Betts Nicholas, Patterson Chris, Davey Smith G., and Evans Alun E.. 2000. “Season and Outdoor Ambient Temperature: Effects on Birth Weight.” Obstetrics & Gynecology 96(5): 689–695. [DOI] [PubMed] [Google Scholar]
- National Cancer Institute . 2013. Surveillance, Epidemiology and End Results. Download US Population Data—1969–2012 . Accessed June 19, 2013. https://seer.cancer.gov/popdata/download.html
- Noble, Nolan James Corry Locke . 2014. “Long‐Run Consequences of Short‐Term Health Shocks.” Doctoral dissertation, University of Notre Dame.
- O'Callaghan, Eadbhard , Sham Pak Chung, Takei Noriyoshi, Glover Gyles, and Murray Robin. 1991. “Schizophrenia After Prenatal Exposure to 1957 A2 Influenza Epidemic.” Lancet 337(8752): 1248–1250. [DOI] [PubMed] [Google Scholar]
- Omer, Saad B. , Goodman David, Steinhoff Mark C., Rochat Roger, Klugman Keith P., Stoll Barbara J., and Ramakrishnan Usha. 2011. “Maternal Influenza Immunization and Reduced Likelihood of Prematurity and Small for Gestational Age Births: A Retrospective Cohort Study.” PLoS Medicine 8(5): e1000441. [DOI] [PMC free article] [PubMed] [Google Scholar]
- Pei, Zhuan , Pischke Jörn‐Steffen, and Schwandt Hannes. 2018. “Poorly measured confounders are more useful on the left than on the right.” Journal of Business & Economic Statistics 1–34. 10.1080/07350015.2018.1462710 [DOI] [Google Scholar]
- Raatikainen, Kaisa , Heiskanen Nonna, and Heinonen Seppo. 2006. “Does unemployment in family affect pregnancy outcome in conditions of high‐quality maternity care?” BMC Public Health 6(1): 46. [DOI] [PMC free article] [PubMed] [Google Scholar]
- Rasmussen, Sonja A. , Jamieson Denise J., and Bresee Joseph S.. 2008. “Pandemic Influenza and Pregnant Women.” Emerging Infectious Diseases 14(1):95–100. [DOI] [PMC free article] [PubMed] [Google Scholar]
- Rasmussen, Sonja A. , Jamieson Denise J., and Uyeki Timothy M.. 2012. “Effects of influenza on pregnant women and infants.” American Journal of Obstetrics and Gynecology 207(3, Supplement): S3–S8. [DOI] [PubMed] [Google Scholar]
- Richards, Jennifer L. , Hansen Craig, Bredfeldt Christine, Bednarczyk Robert A., Steinhoff Mark C., Adjaye‐Gbewonyo Dzifa, Ault Kevin, et al. 2013. “Neonatal Outcomes After Antenatal Influenza Immunization During the 2009 H1N1 Influenza Pandemic: Impact on Preterm Birth, Birth Weight, and Small for Gestational Age Birth.” Clinical Infectious Diseases 56(9): 1216–1222. [DOI] [PMC free article] [PubMed] [Google Scholar]
- Rolfes, Melissa A. , Foppa Ivo M., Garg Shikha, Flannery Brendan, Brammer Lynnette, Singleton James A., Burns Erin, et al. 2018. “Annual estimates of the burden of seasonal influenza in the United States: a tool for strengthening influenza surveillance and preparedness.” Influenza and Other Respiratory Viruses 12(1): 132–137. [DOI] [PMC free article] [PubMed] [Google Scholar]
- Rossen, Lauren M. , and Schoendorf Kenneth C.. 2014. “Trends in racial and ethnic disparities in infant mortality rates in the United States, 1989–2006.” American Journal of Public Health 104(8): 1549–1556. [DOI] [PMC free article] [PubMed] [Google Scholar]
- Ruhm, Christopher J. 2000. “Are Recessions Good for Your Health?” Quarterly Journal of Economics 115: 617–650. [Google Scholar]
- Schwandt, Hannes . 2018. “The lasting legacy of seasonal influenza: In utero exposure and labor market outcomes.” CEPR Discussion Paper 12653
- Selvin, Steve and Janerich Dwight T.. 1971. “Four factors influencing birth weight.” British Journal of Preventive & Social Medicine 25(1): 12. [DOI] [PMC free article] [PubMed] [Google Scholar]
- Shrestha, Sourya , Foxman Betsy, Weinberger Daniel M., Steiner Claudia, Viboud Cécile, and Rohani Pejman. 2013. “Identifying the Interaction Between Influenza and Pneumococcal Pneumonia Using Incidence Data.” Science Translational Medicine 5(191): 191ra84. [DOI] [PMC free article] [PubMed] [Google Scholar]
- Steinhoff, Mark C. 2014. “Epidemiology and Prevention of Influenza” In Infectious Disease Epidemiology: Theory and Practice 3rd Edition, pp. 467–483. Jones & Bartlett Learning. [Google Scholar]
- Steinhoff, Mark C. , Omer Saad B., Roy Eliza, El Arifeen Shams, Raqib Rubhana, Dodd Caitlin, Breiman Robert F., and Zaman K.. 2012. “Neonatal outcomes after influenza immunization during pregnancy: a randomized controlled trial.” Canadian Medical Association Journal 184(6): 645–653. [DOI] [PMC free article] [PubMed] [Google Scholar]
- Strand, Linn Beate , Barnett Adrian G., and Tong Shilu. 2011a. “Methodological challenges when estimating the effects of season and seasonal exposures on birth outcomes.” BMC Medical Research Methodology, 11(1): 49. [DOI] [PMC free article] [PubMed] [Google Scholar]
- Strand, Linn Beate , Barnett Adrian G., and Tong Shilu. 2011b. “The influence of season and ambient temperature on birth outcomes: A review of the epidemiological literature.” Environmental Research, 111(3): 451–462. [DOI] [PubMed] [Google Scholar]
- Torche, Florencia . 2011. “The effect of maternal stress on birth outcomes: exploiting a natural experiment.” Demography 48(4): 1473–1491. [DOI] [PubMed] [Google Scholar]
- Torrey, E. Fuller , Miller Judy, Rawlings Robert, and Yolken Robert. H.. 1997. “Seasonality of births in schizophrenia and bipolar disorder: A review of the literature.” Schizophrenia Research 28(1): 1–38. 10.1016/S0920-9964(97)00092-3. [DOI] [PubMed] [Google Scholar]
- Widdowson, Marc‐Alain , and Monto Arnold S.. 2013. “Epidemiology of Influenza,” in Textbook of Influenza, 2nd edition pp. 250–265. Chichester, UK: John Wiley and Sons. [Google Scholar]
Associated Data
This section collects any data citations, data availability statements, or supplementary materials included in this article.
Supplementary Materials
APPENDIX A Flowchart illustrating the steps used to created dataset for analysis
APPENDIX B The effects of one additional ILI death per 100,000 on birth outcomes
APPENDIX C Time series graph illustrating the spatial and temporal variation in magnitude of influenza mortality rates between 1988 and 2004 by Health and Human Service region
APPENDIX D This figure illustrates the effect of one additional influenza death per 100,000 during each month of gestation on different health outcomes.
APPENDIX E The effects of one additional ILI death per 100,000 on birth outcomes