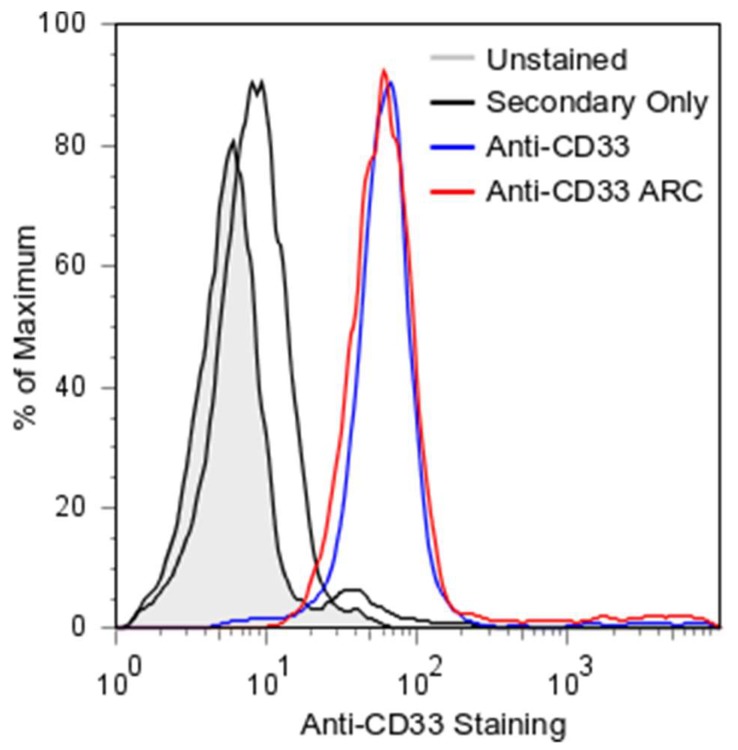
Figure 4.
ARC Binding to THP1 Cells. Flow cytometry of mAb and ARC stained THP1 (CD33-positive) cells. Following SEC purification, mAb/ARC were applied to cells at 25 nM in FACS buffer. Secondary FITC labeled antibody was diluted 1:200 in FACS buffer. Unstained cells are represented in gray. Secondary FITC labeled antibody only is a solid black line. Anti-CD33 mAb is represented by a blue line. Anti-CD33 ARC is represented by a red line. All plots are represented as percent maximum cell count.

