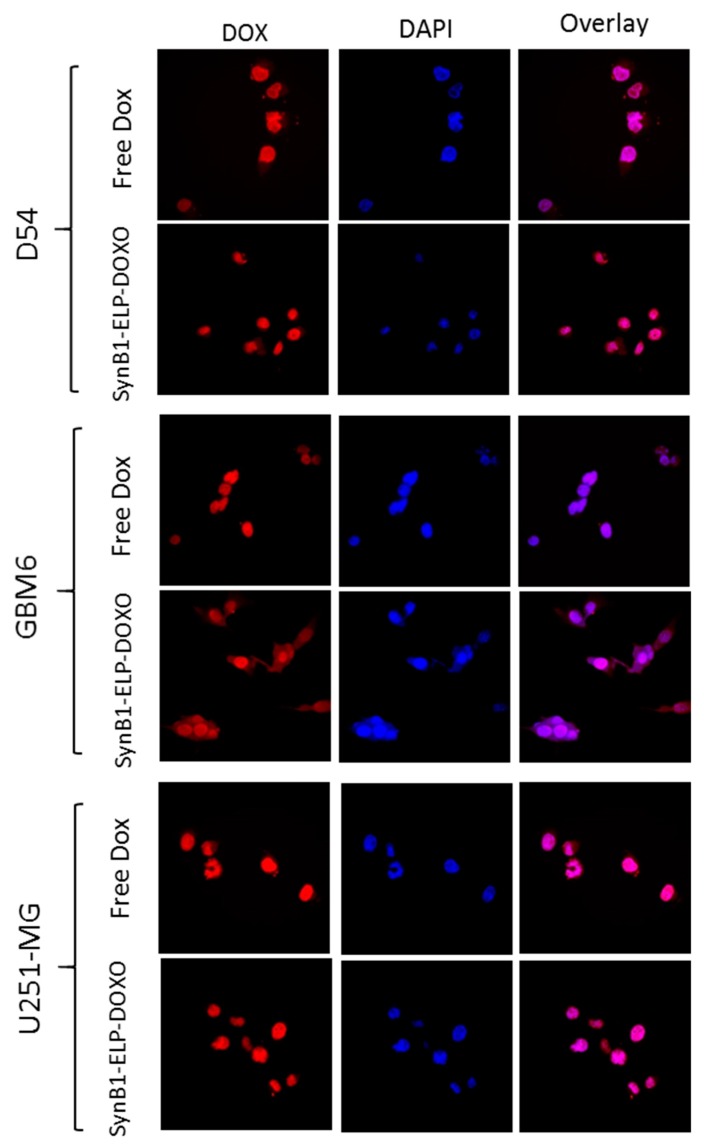
Figure 4.
Comparison of intracellular localization of free Doxorubicin, and SynB1-ELP-DOXO in D54, GBM6, and U251-MG. Representative images of Dox fluorescence (red); nuclei stained with DAPI (blue); the overlay (purple) represents regions where doxorubicin has entered the nucleus. Any difference in image intensity between cells treated with free Dox or SynB1-ELP-DOXO is qualitative only and does not represent the actual difference in Dox concentration in the cells.

