

Abstract
Rapid onset of analgesic action is linked with rapid absorption of analgesics (high maximum concentration [Cmax] and short time to maximum concentration [tmax]). After overnight fasting, ibuprofen lysinate reaches higher peak plasma levels (Cmax) earlier than ibuprofen acid (tmax) with comparable exposure (area under the plasma concentration–time curve [AUC]); however, subjects usually take ibuprofen with or within a short time of a meal. Therefore, pharmacokinetic (PK) studies under fed conditions may better characterize properties under real‐life conditions. We investigated a new fixed‐dose combination (FDC) of ibuprofen acid 400 mg and caffeine 100 mg in 2 single‐dose, randomized, crossover PK studies in healthy subjects (both N = 36). The FDC was compared with ibuprofen 400 mg as acid and as lysinate after an overnight fast in Study 1, and with ibuprofen lysinate after a meal in Study 2. After fasting, results for ibuprofen in the FDC were comparable with those from ibuprofen acid alone. Caffeine did not affect the Cmax, tmax, and AUC. As expected, a higher Cmax and shorter tmax were observed with ibuprofen lysinates vs the FDC. Compared with administration after fasting, Cmax and tmax for ibuprofen lysinate administered postprandially were markedly different, while with FDC, these parameters were less sensitive to food intake. Taken after a meal, ibuprofen in the FDC reached tmax earlier than ibuprofen lysinate (median 1.25 vs 1.63 hours), and Cmax was approximately 13% higher, with comparable AUC, suggesting that the profile of ibuprofen was in favor of the FDC compared with ibuprofen lysinate. Thus, under real‐life conditions, ibuprofen lysinate had no PK advantage over the FDC. All preparations were well tolerated.
Keywords: bioavailability, caffeine, fed, food effect, ibuprofen, lysinate
Acute mild‐to‐moderate pain is usually treated with World Health Organization stage 1 analgesics, such as nonsteroidal anti‐inflammatory drugs (NSAIDs) or paracetamol (also known as acetaminophen in the United States). One of the most widely used NSAIDs is ibuprofen (IBU). For acute pain, IBU is usually taken on demand in single doses of 200 or 400 mg, up to 3 times daily, and is available without prescription in many countries worldwide.1 Due to the favorable efficacy and safety profiles, single doses of up to 800 mg are used to treat chronic inflammatory pain (eg, in osteoarthritis or rheumatoid arthritis).1
It has been shown that subjects suffering from acute pain benefit most from analgesics with a rapid onset of action,2 and there are many analgesics currently available that have been optimized for very fast release of the active ingredients to provide rapid absorption in the gastrointestinal tract. Examples of these are effervescent formulations, oral dissolvable tablets, or certain salt forms of analgesic compounds, including lysinate or arginate. These formulations have been developed to modify the analgesics’ pharmacokinetic (PK) properties with an expectation to improve analgesic efficacy.
Another way to improve the efficacy of an analgesic ingredient is to combine it with an analgesic adjuvant in order to provide a pharmacodynamic advantage, or to combine active ingredients with different modes of action. Caffeine is a well‐proven and widely used analgesic adjuvant,3 and fixed‐dose combination (FDC) products of caffeine with acetylsalicylic acid, paracetamol, or both analgesics are available in many countries. Recently, a clinical study investigating the efficacy, tolerability, and safety of the FDC IBU 400 mg plus caffeine 100 mg compared with its single ingredients and placebo for the treatment of acute pain was reported.4
Ibuprofen is an NSAID with potent analgesic and antipyretic effects. It reduces the production of prostaglandins associated with inflammation and pain by inhibiting the cyclooxygenase‐1 and ‐2 enzymes. Ibuprofen is rapidly absorbed, and peak plasma levels are achieved within 1 to 2 hours of ingestion. Ibuprofen has a relatively short elimination half‐life of about 1.5 to 2 hours, which is prolonged in hepatic and renal diseases. In doses up to 1200 mg taken orally, IBU exhibits approximately linear kinetics. Biotransformation in the liver involves metabolism to well‐characterized phenolic and carboxylic acid derivatives via cytochrome P450 (CYP)2C8, CYP2C9, and possibly CYP2C19 activities, and to conjugates with glucuronic acid and taurine catalyzed by uridine 5′‐diphospho‐gluronyltransferases. Ibuprofen and its metabolites are eliminated through the kidneys, mainly as conjugates. Ibuprofen is extensively bound to plasma proteins.1, 5
The area under the plasma concentration–time curve (AUC) represents total drug exposure over time; thus, assuming linear pharmacodynamics, the AUC should be proportional to the total amount of IBU absorbed by the body. Antacids such as magnesium hydroxide accelerate the rate of absorption of IBU, due to changes in the gastrointestinal pH, without altering the extent of absorption or AUC.6 Potent inhibitors of CYP2C9 (voriconazole, fluconazole) and of CYP2C8 (gemfibrozil) have been reported to influence IBU disposition.7 Ibuprofen may also increase plasma concentration of lithium and digoxin.5
Caffeine is a methylxanthine that has antinociceptive effects, mainly through antagonism of adenosine receptors and inhibition of prostaglandin synthesis. Caffeine is rapidly and completely absorbed and widely distributed into bodily fluids. Metabolism of caffeine occurs almost entirely in the liver via CYP1A2 to its main metabolites, dimethylxanthines, paraxanthine, theobromine, and theophylline, the majority of which are excreted renally. The plasma half‐life of caffeine varies widely among individuals; it is shortened in smokers and prolonged in subjects with impaired hepatic function.8
Potent CYP1A2 inhibitors interfere with the metabolism and elimination of caffeine. Reduced caffeine clearance has been described with the use of antimycotic drugs (fluconazole, ketoconazole), antiarrhythmic drugs (diltiazem, verapamil), antidepressants (fluvoxamine), antipsychotic drugs (clozapine, olanzapine), methylxanthines (theophylline), oral contraceptives, cimetidine, quinolones, and allopurinol. Phenytoin and cigarette smoking increase the hepatic metabolism of caffeine, resulting in increased elimination and decreased plasma caffeine concentrations. Paracetamol, acetylsalicylic acid, and ergotamine absorption and bioavailability may be increased by caffeine. Clearance of theophylline is reduced and caffeine also competitively inhibits clozapine metabolism, which may increase their plasma concentrations.9, 10 Zolpidem plasma concentration is increased by caffeine coadministration.11
Published data on the influence of IBU on caffeine PK in humans and vice versa have not been found.
This article describes 2 clinical studies on the PK properties of IBU 400 mg and caffeine 100 mg in FDC. In the first study, the FDC was compared with an IBU acid analgesic, and with IBU formulated as lysinate, on an empty stomach (after >10 hours fasting). The second study investigated PK properties of the FDC and IBU lysinate under fed conditions. One aspect of these studies was to investigate the impact of feeding state on absorption of different IBU presentations, and to facilitate discussion about how this might affect efficacy and tolerability in a scenario reflecting “everyday life” (ie, without a fasting period of 10 hours before intake).
Methods
Both studies were carried out in compliance with the clinical study protocols and reviewed and approved by the appropriate institutional ethics committees and health authorities (Study 1: Independent Ethics Committee of the Landesärztekammer Rheinland‐Pfalz, Mainz, Germany; Study 2: Independent Ethics Committee of the Faculty of Health, Research Division, Bloemfontein, South Africa). They were conducted in accordance with the Declaration of Helsinki and Good Clinical Practice Guidelines. All subjects provided written informed consent prior to study commencement. Both studies are registered on ClinicalTrials.gov as phase 1 studies with ID numbers NCT01879371 (study under fasted conditions) and NCT02629354 (study under fed conditions).
Study Population
In both studies, healthy male and female subjects 18 to 50 years of age with a body mass index (BMI) of 18.5 to 29.9 kg/m2 and who were able to understand and comply with study requirements, were eligible. Subjects with abnormal medical examination or laboratory findings, including gastrointestinal, hepatic, renal, respiratory, cardiovascular, metabolic, immunologic, or hormonal disorders reflecting any relevant deviation from healthy conditions; those with heavy tobacco or alcohol abuse, drug abuse, or positive drug screen; usage of prescription or over‐the‐counter drugs before investigational medicinal product administration; and those not meeting the eligibility criteria were excluded from the study.
Study Designs
Both studies were phase 1, single‐center, single‐dose, open‐label, randomized, crossover studies in healthy subjects (36 per study). For relative bioavailability (BA) studies, a crossover design is preferred, as the comparison between formulations/treatments is based on a comparison within subjects rather than between subjects. Therefore, this study design removed intersubject variability from the comparison between formulations within each study.12 The open‐label treatment was not expected to bias results because the study end points were derived from the measurement of plasma concentrations of the analytes provided by a bioanalytical laboratory, which was blinded to treatment allocation.
Screening included: subject information, informed consent, physical examination, check of vital signs, electrocardiogram (ECG), laboratory safety screens (including drug and virus screening) and urinalysis, breath alcohol test, pregnancy test for females, demographics (including determination of body height and weight, smoking and alcohol history), relevant medical history, concomitant therapy, and review of inclusion/exclusion criteria.
Study 1 was a 3‐period crossover study and was conducted at the Human Pharmacology Centre of Boehringer Ingelheim Pharma GmbH & Co. KG, Ingelheim/Rhein, Germany, from June 2013 to July 2013.
The primary objective of the study was to investigate the relative BA of IBU acid from the IBU 400 mg + caffeine 100 mg FDC compared with IBU acid 400 mg from a Brufen tablet and IBU lysinate 400 mg from a Nurofen Immedia tablet after oral administration. The secondary objective was the evaluation and comparison of several PK parameters between the treatments. The assessment of safety and tolerability was an additional objective of this study. Moreover, PK parameters of caffeine were measured.
Subjects who met all of the eligibility criteria were randomly allocated to the 6 treatment sequences (FDC‐IBU acid‐IBU lysinate, FDC‐IBU lysinate‐IBU acid, IBU acid‐IBU lysinate‐FDC, IBU acid‐FDC‐IBU lysinate, IBU lysinate‐FDC‐IBU acid, or IBU lysinate‐IBU acid‐FDC). Treatment duration was 1 day (single dose) for each of the 3 treatments, with PK blood samplings for 24 hours. Each treatment was separated by a washout phase of at least 6 days. FDC film‐coated tablets containing 400 mg IBU and 100 mg caffeine were produced by the sponsor, IBU acid (Brufen) and IBU lysinate (Nurofen Immedia) were purchased from pharmacies.
After an overnight fast of at least 10 hours, the medication was administered in a sitting position as a single oral dose with approximately 240 mL of water. Subjects were kept under close medical surveillance until 12 hours after drug administration.
An end‐of‐study examination was conducted 7 to 12 days following the last drug administration, which included physical examination, vital signs, ECG, laboratory safety analysis (including pregnancy test for females) and urinalysis, recording of adverse events (AEs), and concomitant therapy.
Study 2 was a 2‐period crossover study and was conducted at the Bloemfontein Early Phase Clinical Unit, PAREXEL International, South Africa, from November 2015 to January 2016.
The primary objective of this study was to evaluate the relative BA of IBU acid 400 mg from the FDC compared with IBU lysinate (Dolormin Extra film‐coated tablets containing IBU lysinate 684 mg, equivalent to IBU 400 mg), following oral single‐dose administration under fed conditions. For this purpose, the rate and extent of absorption of S‐IBU, R‐IBU and IBU (the sum of the enantiomers) were evaluated. Because the results for the enantiomers (S‐IBU/R‐IBU ratio of AUC0–tz [AUC over the time interval from 0 to the last quantifiable time point/concentration]) were the same for both products, only the values for total IBU will be presented here. Caffeine PK parameters were also determined.
Subjects who met all of the eligibility criteria were randomly assigned to 1 of the 2 treatment sequences. After intake of a standard breakfast, study medication was administered in a standing position according to the randomization schedule. The 2 treatment periods (each of which included a profile period of 24 hours) were separated by a washout period of at least 6 calendar days between consecutive administrations of study drugs.
Within 72 hours of completion of the last period of the study, or after withdrawal, a follow‐up visit was conducted, which included a physical examination at the discretion of the investigator, ECG, laboratory safety analysis (including pregnancy test for females) and clinical chemistry and hematology, and recording of AEs and concomitant therapy.
Pharmacokinetic Analysis
Study 1
Blood samples were drawn at the following time points after administration: 5, 10, 15, 30, and 45 minutes and 1, 1.25, 1.5, 1.75, 2, 2.5, 3, 4, 5, 6, 8, 10, 11, and 12 hours (24 and 34 hours only for FDC). The date and time of drug administration and PK samplings were recorded, and the actual sampling times were used for the determination of PK parameters.
Plasma concentrations of IBU and caffeine were analyzed using fully validated methods at Nuvisan GmbH, Germany. IBU was analyzed using an assay comprising solid‐phase extraction of human plasma with an isotope‐labeled internal standard (IBU‐D3) on an OASIS HLB extraction plate (Waters GmbH, Eschborn, Germany) with acetonitrile elution and subsequent quantification by liquid chromatography–tandem mass spectrometry (LC‐MS/MS). The samples were analyzed on a Perkin Elmer Sciex API 3000 LC‐MS/MS system (AB Sciex Germany GmbH, Darmstadt, Germany) with an electrospray ion source in negative ion mode. Separation was achieved by injection on a Synergi 4μ Hydro‐RP 80 Å, LC column (Phenomenex Ltd., Aschaffenburg, Germany) and gradient elution starting with 70% of 10 mM ammonium formate buffer to 70% acetonitrile with a flow rate of 250 µL/min. Monitored transitions were m/z 205–161 and m/z 208–164 for IBU and the internal standard, respectively. The lower limit of quantification was 100 ng/mL.
Caffeine was analyzed with an assay comprising protein precipitation of human plasma with an isotope‐labeled internal standard (Caffeine‐D9) with a mixture of methanol and acetonitrile (1:1, v/v) and subsequent quantification by LC‐MS/MS. The samples were analyzed on an AB Sciex Triple Quad 5500 (AB Sciex Germany GmbH, Darmstadt, Germany). Measurements were performed in the positive ionization mode. Separation was achieved by injection on a ZORBAX Eclipse XDB‐C18 column (Agilent Technologies Deutschland GmbH, Waldbronn, Germany) and isocratic elution (methanol:acetonitrile:formic acid [60:140:0.05, v/v/v]) with a flow rate of 400 µL/min. Monitored transitions were m/z 195–138 and m/z 204–144 for caffeine and the internal standard, respectively. The lower limit of quantification was 10.0 ng/mL.
Study 2
PK blood samples for IBU, S‐IBU, R‐IBU and caffeine assays were collected at the following time points: within 2 hours before dosing, at 5, 10, 15, 30, and 45 minutes and 1, 1.25, 1.5, 1.75, 2, 2.30, 3, 4, 5, 6, 8, 10, 12, and 24 hours after dosing (total: 20 samples per treatment period).
Actual blood sampling times were recorded and used for the determination of PK parameters. Venous blood samples for the determination of caffeine were collected into labeled tubes containing lithium heparin as an anticoagulant. Plasma samples were stored at approximately –20°C until they were transferred to PAREXEL Bioanalytical Services Division (BASD; Waltham, Masssachusetts) for analysis. Quantification of study samples was carried out using the analytical method that was validated. After extraction from the biological matrix and sample preparation, the analytes and internal standard (R‐ and S‐IBU‐D3, caffeine‐D9) were analyzed using an API 4000 mass spectrometer (Sciex, Framingham, Massachusetts) in positive electrospray ionization mode for caffeine and in negative ion mode for IBU.
IBU analytes and the internal standard were extracted from the biological matrix by liquid–liquid extraction, using a solvent mixture of hexane and ethyl acetate (8:2, v/v) under acid conditions. The extracts were dried under nitrogen and reconstituted in the mobile phase (methanol:water:formic acid [70:30:0.1, v/v/v]). Liquid chromatographic separation was achieved with Daicel Chiralpak IA (Daicel Corporation, CPI Company, Chiral Technologies Europe, Illkirch Cedex, France), 150 × 2.1 mm, 5 µm analytical column and isocratic elution (methanol:water:formic acid [70:30:0.1, v/v/v]) with a flow rate of 150 µL/min. The monitored transitions were m/z 205–161 and m/z 208–164 for R‐ and S‐ibuprofen and the internal standard, respectively. The lower limit of quantification was 58.593 ng/mL.
Caffeine analytes and the internal standard were isolated from the biological matrix by protein precipitation with a solvent mixture of acetonitrile and methanol (1:1, v/v). This was followed by a dilution of the supernatant with 2% acetic acid. Liquid chromatographic separation was achieved with Poroshell 120 EC C18 (Agilent Technologies, Santa Clara, California) 3.0 × 50 mm, 2.7 µm analytical column and isocratic elution (0.1 % aqueous formic acid in water and acetonitrile [4:1, v/v]) with a flow rate of 300 µL/min. The monitored transitions were m/z 195–138 and m/z 204–144 for caffeine and the internal standard, respectively. The lower limit of quantification was 9.766 ng/mL.
The quality control within‐ and between‐day variability for all methods was within ±15% and the precision ≤15% as prescribed for validated methods.
Statistical Methods
In Study 1, 36 subjects were enrolled to compensate for possible dropouts and obtain 30 evaluable subjects to achieve at least 90% power to reject both 1‐sided null hypotheses (representing inequivalence) each at the 5% level of significance. This was based on the estimated geometric coefficient of variation (gCV) of Cmax (maximum plasma drug concentration after single dose administration) IBU, which was estimated to be ∼22%, while for the AUCs, the gCVs were lower.
Relative BA was estimated by the ratios of the geometric means (gMeans) of FDC/IBU acid and FDC/IBU lysinate for the primary and secondary end points, Cmax, AUC0–tz, and AUC from time zero to infinity (AUC0–∞), and two‐sided 90% confidence intervals (CIs) of these ratios were provided. The statistical model was an analysis of variance (ANOVA) on the logarithmic scale. CIs were calculated based on the residual error from ANOVA. Descriptive statistics were calculated for all end points. In Study 1, all subjects who provided at least one observation for at least 1 primary PK end point, with no major protocol deviations considered to impact on the analysis of the PK data, were included in the PK population (PK set) used for statistical analysis of the PK data.
The calculated 2‐sided 90%CIs for Cmax, AUC0–tz, and AUC0–∞ for the ratios of the gMeans of the FDC and IBU acid were compared with the equivalence acceptance interval of 80% to 125% as a secondary analysis whereas the 90%CIs for Cmax for the ratios of the gMeans of the FDC and IBU lysinate were compared with the nonsuperiority acceptance range ≤125% as a secondary analysis.
In Study 2, the results of Study 1 were used to determine the required number of subjects (in Study 1 intraindividual gCVs for AUC0–tz and Cmax regarding IBU were ≤15%). In total, 36 subjects were enrolled to compensate for possible dropouts and to obtain 30 evaluable subjects to achieve 2‐sided 90%CIs for BA ratios meeting the chosen precision of 1.19 with a probability of 95%. For a BA ratio of 110%, precision of 1.19 (ratio of upper to lower confidence interval) corresponds to an interval of 101% to 120%. Relative BA was estimated by the ratios of the gMeans of test and reference products (FDC/IBU lysinate) for the primary and secondary end points, Cmax, AUC0–tz, and AUC0–∞, and 2‐sided 90%CIs of these ratios were provided.
In Study 2, all subjects who completed the PK sampling in both periods with no major protocol deviations considered to impact on the analysis of the PK data were included in the PK population used for statistical analysis of the PK data.
The statistical model was an ANOVA on the logarithmic scale. For each end point, the difference between the expected means for the natural log(FDC)–log(IBU lysinate) was estimated by the difference in the corresponding adjusted means (least squares means). CIs were calculated based on the residual error from the ANOVA. The differences between the test and reference product and the CIs were back‐transformed to the original scale, resulting in point estimates of the FDC/IBU lysinate gMean ratios and 90%CIs.
Safety and Tolerability Evaluations
In both studies, safety was assessed for the end points, AEs, safety laboratory tests, vital signs (blood pressure and pulse rate), 12‐lead ECG (occurrence of clinically relevant findings) and physical examination. All subjects who received at least 1 dose of the investigational medicinal product were included in the safety population applicable to the safety analysis for each study.
Safety analyses were descriptive in nature and the analyses were performed by “treatment at onset”. Measurements such as ECG, vital signs, laboratory parameters, or AEs were assigned to treatments based on the actual treatment at the time of measurement or on the recorded time of AE onset (treatment‐emergent AEs). Therefore, measurements that were planned or AEs that were recorded prior to the first intake of study medication were assigned to “screening”, those between first‐study medication intake until next intake or the end‐of‐study visit were assigned to the preceding treatment, and those after the end‐of‐study examination were assigned to “post study”.
Results
Study Subjects
A total of 72 subjects were included in both studies.
In Study 1 (fasted), 36 subjects were included in Germany. All subjects were Caucasian, 21 (58.3%) were male, and 15 (41.7%) were female. The mean age was 39.0 years (standard deviation [SD], 6.2 years; range, 28–49 years), mean weight was 77.3 kg (SD, 11.1 kg; range, 56–95 kg), and the mean BMI was 24.93 kg/m2 (SD, 2.57 kg/m2; range, 19.2–28.7 kg/m2). No concomitant diagnoses and no relevant concomitant therapies were reported. All subjects received all 3 treatments.
For Study 1, the safety population included all subjects who were dispensed study medication and were documented to have taken at least 1 dose of the study drug (N = 36). The PK set included all subjects from the safety population who provided at least 1 observation for at least 1 primary PK end point without important protocol violations (N = 36).
In Study 2 (fed), 36 subjects were included in South Africa; 17 (47.2%) were black, 17 (47.2%) were Caucasian, and 2 (5.6%) were mixed race. A total of 25 (69.4%) subjects were male, and 11 (30.6%) subjects were female. The mean age was 28.0 years (SD, 7.3 years; range, 20–46 years). The mean weight was 70.4 kg (SD, 10.2 kg; range, 54–90 kg), and the mean BMI was 24.1 kg/m2 (SD, 3.1 kg/m2; range, 19–30 kg/m2).
For Study 2, the study protocol included a restriction of caffeine for 24 hours prior to dosing and until the last PK blood sample is collected per treatment period; however, 10 subjects were identified as having predose caffeine concentrations in the test and/or reference arm that were >10% of the observed Cmax in the test arm. Given the aim of this study, it was agreed at the constituted Data Review Meeting that this was considered a major protocol deviation, resulting in the exclusion of the 10 subjects from the PK analysis; per protocol, the safety population included all subjects who received at least 1 dose of the study medication (N = 36), the PK set included all subjects from the safety population with the exception of the 10 subjects excluded for a major protocol violation relating to increased predose caffeine concentrations (N = 26). In the opinion of the investigator, these protocol deviations did not impact the integrity of the data, as was later confirmed in additional complementary analyses.
Pharmacokinetics
Study 1
After fasting, the PK properties of IBU from the IBU 400 mg + caffeine 100 mg FDC were comparable to those of IBU acid 400 mg. Caffeine did not affect the PK parameters. As expected, the PK parameters were different for IBU lysinate (Table 1). The individual and gMean IBU plasma concentration‐time profiles obtained after single oral administration of IBU from the FDC were similar to the IBU profiles obtained after single oral administration of IBU acid. For the FDC and IBU acid, the IBU plasma concentration peaked at 1.88 hours (median of tmax). For IBU lysinate, Cmax was reached more rapidly, with a median time of 0.50 hours. In all 3 treatment groups, once peak concentrations were achieved, plasma levels declined rapidly in the distribution phase into a slower elimination phase. The terminal disposition phase did not appear substantially different among the 3 treatments.
Table 1.
PK Parameters Including Arithmetic Mean (SD) of Primary and Secondary End Points (Plasma IBU) Under Fasted Conditions (PK Set, Study 1)
| Parameter (Unit) | FDC | IBU Acid | IBU Lysinate | Caffeine as FDC |
|---|---|---|---|---|
| Cmax (µg/mL) | 31.4 (5.22) | 31.8 (6.74) | 44.9 (8.77) | 2.53 (0.72) |
| AUC0–tz (µg · h/mL) | 136 (31.5) | 126 (24.7) | 124 (24.4) | 17.4 (10.2) |
| AUC0–∞ (µg · h/mL) | 138 (31.2)a | 130 (26.4) | 127 (26.4) | 18.7 (13.1) |
| Median tmax (h) | 1.88 | 1.88 | 0.50 | 0.50 |
| Mean t1/2 (h) | 2.54 (0.88) | 2.13 (0.25) | 2.26 (0.37) | 5.64 (3.22) |
AUC0–∞, area under the plasma concentration–time curve from zero to infinity; AUC0–tz, area under the plasma concentration–time curve over the time interval from zero to the last quantifiable time point/concentration; Cmax, maximum plasma drug concentration after single dose administration; FDC, fixed‐dose combination; IBU, ibuprofen; PK, pharmacokinetics; SD, standard deviation; t1/2, half‐life; tmax, time to maximum plasma concentration.
N = 35, all other results N = 36; The AUC0–∞ for 1 subject was not available in 1 period.
Caffeine was rapidly absorbed after a single oral administration of ibuprofen 400 mg + caffeine 100 mg (Table 1). Arithmetic mean plasma concentration‐time profiles of IBU acid and caffeine from FDC and IBU acid alone following a single oral administration under fasted conditions as measured in Study 1 are shown in Figure 1.
Figure 1.
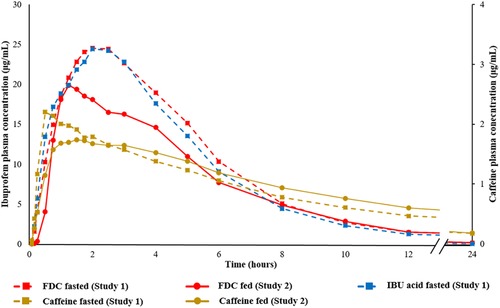
Arithmetic mean plasma concentration‐time profile of IBU from the FDC and caffeine from the FDC under fasted (Study 1) and fed (Study 2) conditions, and from IBU acid under fasted (Study 1) conditions. FDC, fixed‐dose combination; IBU, ibuprofen.
In Table 2, the point estimates of the FDC/IBU acid and FDC/IBU lysinate gMean ratios for the PK parameters Cmax, AUC0–tz, and AUC0–∞ including their 90%CIs are provided for total IBU.
Table 2.
Relative BA of Plasma IBU After Single Oral Administration of FDC, IBU Acid, and IBU Lysinate Under Fasted Conditions (PK Set, Study 1)
| PK Parameter (Unit) | N | % Ratio FDC/IBU Acid | 90%CI of Ratio | Intra CV (%) |
|---|---|---|---|---|
| Cmax (µg/mL) | 36 | 99.65 | 93.87−105.78 | 15.0 |
| AUC0–tz (µg · h/mL) | 36 | 107.85 | 105.33−110.43 | 5.9 |
| AUC0–∞ (µg · h/mL) | 36 | 106.50 | 104.05−109.00 | 5.7 |
| PK Parameter (unit) | N | % Ratio FDC/IBU Lysinate | 90%CI of Ratio | Intra CV (%) |
|---|---|---|---|---|
| Cmax (µg /mL) | 36 | 70.42 | 67.09−73.93 | 12.2 |
| AUC0–tz (µg · h/mL) | 36 | 109.48 | 107.07−111.94 | 5.6 |
| AUC0–∞ (µg · h/mL) | 36 | 108.59 | 106.19−111.05 | 5.5 |
AUC0–∞, area under the plasma concentration–time curve from zero to infinity; AUC0–tz, area under the plasma concentration–time curve over the time interval from zero to the last quantifiable time point/concentration; CI, confidence interval; Cmax, maximum plasma drug concentration after single dose administration; CV, coefficient of variation; FDC, fixed‐dose combination; IBU, ibuprofen; LS, least squares; PK, pharmacokinetics; tmax, time to maximum plasma concentration.
N is the number of subjects included in the analysis of variance (ANOVA).
Statistical analysis: ANOVA (by SAS Proc Mixed) with fixed effects for sequence, period, and product and random effect subject nested within sequence after logarithmic transformation of the data.
For the statistical evaluation of bioequivalence, the comparison of IBU acid from FDC with IBU acid indicated the 90%CIs for the primary and the secondary end points were within the acceptable range of 80% to 125%. When comparing the FDC with IBU lysinate, the 90%CIs for Cmax were within the acceptable range of ≤125%.
Comparison of individual and gMean PK parameters AUC0–tz and Cmax are shown in Figures 1 and 2, respectively. The data in these figures suggested that IBU acid from FDC resulted in similar total systemic exposure (as measured by AUC) compared with IBU acid and IBU lysinate under fasted conditions. The peak exposure (Cmax) between the IBU acid in the FDC and IBU acid alone was comparable; however, for IBU lysinate the peak concentration (Cmax) was higher.
Figure 2.
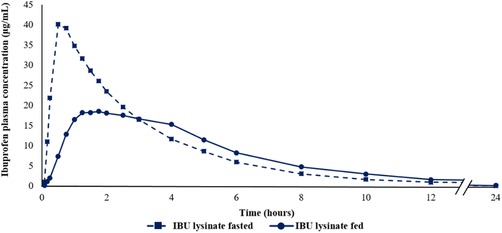
Arithmetic mean plasma concentration‐time profile of IBU lysinate under fasted (Study 1) and fed (Study 2) conditions. IBU, ibuprofen.
Study 2
Arithmetic mean values for AUC0–tz, Cmax, AUC0–∞ as well as median tmax and median half‐life are summarized in Table 3. Taken after a meal, the relative BA evaluation showed that total IBU exposure (AUC0–tz and AUC0–∞) was equivalent for the FDC and IBU lysinate, with test‐versus‐reference ratios close to 1 and corresponding 90%CI within the 80% to 125% limits, corroborating findings observed under fasted conditions in Study 1 compared with both IBU acid and IBU lysinate. Total IBU Cmax was higher for the FDC, with a test‐versus‐reference ratio of approximately 113% and the upper limit of the 90%CIs exceeding the 125% limit. The absolute Cmax values observed in this study following the ingestion of food were lower compared with the fasted study, so the higher Cmax for the FDC compared with IBU lysinate was not considered relevant from safety and tolerability perspectives (Figures 3 and 4). In addition, IBU acid from the FDC reached tmax earlier than IBU lysinate (Table 3).
Table 3.
PK Parameters Including Arithmetic Mean (SD) of Primary and Secondary End Points (Plasma IBU) Under Fed Conditions (PK Set, Study 2)
| Parameter (Unit) | IBU Acid as FDC | IBU Lysinate | Caffeine as FDC |
|---|---|---|---|
| Cmax (µg /mL) | 27.34 (7.10) | 24.71 (7.09) | 2.15 (0.44) |
| AUC0–tz (µg · h/mL) | 106.7 (18.22) | 110.10 (18.94) | 17.94 (5.85) |
| AUC0–∞ (µg · h/mL) | 108.6 (17.96) | 114.2 (16.69)a | 19.87 (7.79) |
| Median tmax (h) | 1.25 | 1.63 | 1.13 |
| Mean t1/2 (h) | 2.16 (0.45) | 2.32 (0.47) | 6.07 (1.96) |
AUC0–∞, area under the plasma concentration–time curve from zero to infinity; AUC0–tz, area under the plasma concentration–time curve over the time interval from zero to the last quantifiable time point/concentration; Cmax, maximum plasma drug concentration after single dose administration; FDC, fixed‐dose combination; IBU, ibuprofen; PK, pharmacokinetic; SD, standard deviation; t1/2, half‐life; tmax, time to maximum plasma concentration.
N= 25, all other results N = 26; 1 subject's AUC0–∞ was not available in 1 period.
Figure 3.
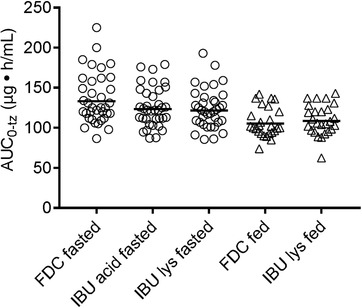
Individual and arithmetic mean AUC0–tz values of IBU after IBU acid 400 mg + caffeine 100 mg from FDC, IBU acid 400 mg, and IBU lysinate under fasted conditions (circles; Study 1) and of IBU acid from FDC and IBU lysinate under fed conditions (triangles; Study 2). AUC0–tz, area under the plasma concentration–time curve over the time interval from zero to the last quantifiable time point/concentration; FDC, fixed‐dose combination; IBU, ibuprofen.
Figure 4.
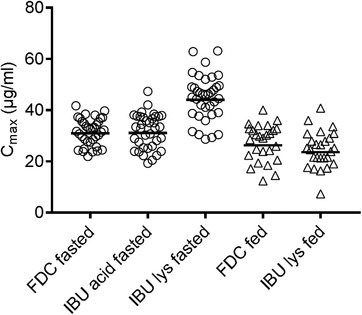
Individual and arithmetic mean Cmax values of IBU after IBU acid 400 mg + caffeine 100 mg from FDC, IBU acid 400 mg, and IBU lysinate under fasted conditions (circles; Study 1) and of IBU acid from FDC and IBU lysinate under fed conditions (triangles; Study 2). Cmax, maximum plasma drug concentration after single‐dose administration; FDC, fixed‐dose combination; IBU, ibuprofen.
In Table 4, the point estimates of the FDC/IBU lysinate gMean ratios for the PK parameters Cmax, AUC0–tz, and AUC0–∞, including their 90%CIs are provided for total IBU. The S‐IBU/R‐IBU ratio of AUC0–tz was the same for both products, estimated by an adjusted gMean of 1.5. Resulting from this, the point estimate of the FDC/IBU lysinate gMean ratio was 99.81% with a 90%CI of 95.17% to 104.68%. Thus, the upper and lower limits of the 90% estimated CIs were within the standard bioequivalence acceptance range. The standard bioequivalence acceptance range (80%–125%) is specified in the European Medicines Agency bioequivalence guideline (2010).
Table 4.
Relative Bioavailability of Plasma IBU After Single Oral Administration of FDC and IBU Lysinate Under Fed Conditions (PK Set, Study 2)
| LS Mean | ||||||
|---|---|---|---|---|---|---|
| PK Parameter (Unit) | N | FDC | IBU Lysinate | % Ratio FDC/IBU Lysinate | 90%CI of Ratio | Intra CV (%) |
| Cmax (µg /mL) | 26 | 26.36 | 23.39 | 112.69 | 98.49−128.94 | 28.9 |
| AUC0–tz (µg · h/mL) | 26 | 105.50 | 108.10 | 97.57 | 94.50−100.73 | 6.7 |
| AUC0–∞ (µg · h/mL) | 26a | 107.50 | 111.00 | 96.83 | 93.75−100.01 | 6.6 |
| S‐IBU/R‐IBU | ||||||
| AUC0–tz | 26 | 1.526 | 1.529 | 99.81 | 95.17−104.68 | 10.0 |
AUC0–∞, area under the plasma concentration–time curve from zero to infinity; AUC0–z, area under the plasma concentration–time curve over the time interval from zero to the last quantifiable time point/concentration; CI, confidence interval; CV, coefficient of variation; FDC, fixed‐dose combination; h, hour; IBU, ibuprofen; LS, least squares; PK, pharmacokinetic.
Statistical analysis: analysis of variance (ANOVA by SAS Proc GLM) with fixed effects for sequence, subject nested within sequence, period and product after logarithmic transformation of the data.
N = 26 in PK set; N = 25 in ANOVA, as 1 subject's AUC0–∞ was available in only 1 period.
The statistical evaluation of IBU PK parameters based on the safety population (ie, including the subjects with relatively high caffeine predose levels) showed very similar findings to the results gathered from the PK population. The AUC comparisons showed almost identical point estimates of the FDC vs IBU lysinate ratios. The difference in Cmax between the FDC and IBU lysinate was slightly more pronounced compared with the PK population (FDC versus IBU lysinate ratio for S‐IBU of 117% based on safety population and 114% based on PK population). As the planned sample size was not reached for the PK population, it was expected that the CI for Cmax was broader than expected from the planned gCV.
After administration of the FDC product, caffeine was rapidly absorbed, with a median tmax of 1.13 hours (range, 0.25–5.00 hours) and a peak (Cmax) exposure of 2.10 µg/mL. The gMean of caffeine for AUC0–tz was 17.09 µg • h/mL. Arithmetic mean plasma concentration‐time profiles of IBU acid and caffeine from FDC after single oral administration under fed conditions as measured in Study 2 are shown in Figure 1 (in addition to the concentration‐time profiles of IBU acid and caffeine from FDC and of IBU acid under fasted conditions obtained in Study 1).
In addition, the plasma concentration–time profiles of IBU lysinate obtained under fasted conditions (Study 1) and under fed conditions (Study 2) are provided in Figure 2.
Figure 5 summarizes the results of relative bioavailability (Cmax and AUC0‐tz) for ibuprofen acid of the FDC compared to the reference treatments.
Figure 5.
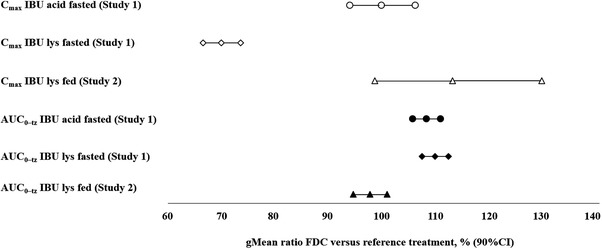
Adjusted by treatment gMeans and relative bioavailability of ibuprofen acid from the FDC compared with the reference treatments IBU acid and IBU lysinate under fasted (Study 1) and fed (Study 2) conditions. AUC0–tz, area under the plasma concentration–time curve over the time interval from zero to the last quantifiable time point/concentration; CI, confidence interval; FDC, fixed‐dose combination; IBU, ibuprofen.
Safety and Tolerability
Overall, single‐dose administration of all IBU interventions (with or without caffeine) was generally well tolerated. No serious treatment‐emergent AEs (TEAEs) were reported and no subjects were discontinued due to TEAEs in either study investigated. No clinically relevant abnormalities in chemistry or hematological laboratory values were reported, and there were no clinically relevant findings with respect to vital signs or ECG recordings.
In Study 1, 10 of 36 (27.8%) subjects experienced at least 1 AE during the treatment period, with no relevant differences observed between the treatment groups. None of the AEs were assessed as drug related by the investigator. Headache was the most frequently reported AE; there were 2 incidences with the FDC, 4 incidences with IBU acid, and 1 incidence with IBU lysinate (N = 36).
In Study 2, 5 TEAEs were reported by 4 of 36 (11.1%) subjects: 3 AEs were reported by 3 separate subjects during treatment with FDC, of which 1 AE (tiredness) was considered to be associated with the study drug. During treatment with IBU lysinate, 2 AEs were reported by 2 individual subjects and both were considered unrelated to study drug. All TEAEs were of mild intensity. No posttreatment TEAEs were reported.
Discussion
Caffeine has been used for decades as an analgesic adjuvant, and its efficacy has been shown in large meta‐analyses.3, 13 Study 1 clearly ruled out that caffeine affects ibuprofen PK; Cmax, tmax, and AUC of ibuprofen acid from the FDC and the reference product were comparable. In line with published results,14 properties of ibuprofen lysinate were different (with higher Cmax, shorter tmax, but comparable AUC).
In a meta‐analysis on analgesic efficacy of different ibuprofen formulations (in postoperative pain), Moore et al2 have shown that rapid absorption of ibuprofen is linked to rapid onset of analgesic action, as well as superior overall analgesia compared with ibuprofen acid.2 In the head‐to‐head studies discussed therein comparing 400 mg of rapid‐releasing ibuprofen (as arginate, effervescent, sodium salt liquigel, or soluble formulation) with ibuprofen acid, meaningful pain relief was reached between approximately 4 minutes and 24 minutes earlier. Although ibuprofen lysinate is used widely for the treatment of acute pain, no head‐to‐head efficacy studies vs ibuprofen acid are available.
Subjects undergoing elective surgery usually fast for several hours before the intervention, and PK under fasted conditions can be assumed to be directly linked to the onset of analgesic action. Other acute pain entities, like tension‐type headache or migraine, usually begin in the course of the day, and most likely subjects have had a meal up to only a few hours before the pain event (and the intake of medication). Moreover, it is often recommended not to take analgesics on an empty stomach.14 Thus, PK data obtained in subjects who have had a standard meal before intake of the test medication should be much more relevant for on‐demand (over‐the‐counter) analgesic use.
In the present study under fed conditions, ibuprofen lysinate reaches tmax later, and Cmax is lower, compared with fasted conditions. This has previously been shown by Klüglich and colleagues,15 where no effect of caffeine on ibuprofen PK was observed. Caffeine did not have any influence on the S‐IBU/R‐IBU ratio. However, it must be noted that stereoselective interaction of active substances with ibuprofen have previously been reported.7 When taken postprandially, the advantages of IBU lysinate with respect to their PK properties (higher Cmax and earlier tmax) were not seen, with similar results observed for both ibuprofen formulations. The differences observed between the plasma concentration–time profiles of IBU lysinate under fasted and fed conditions appear to be attributable to the influence of food rather than to the application of different IBU lysinate products (both were administered as tablet formulations) in the 2 studies.
In a meta‐analysis, Moore et al2 showed that under fasted conditions, PK profiles of standard ibuprofen (acid) products can vary considerably (with tmax values in the range of 31–168 minutes, and Cmax values [per 100 mg dose] between 3–11 mg/L). For ibuprofen formulated as lysinate, the ranges were much smaller (tmax, 25–45 minutes; Cmax, 7.8–12 mg/L). Therefore, it can be concluded that PK parameters are not relevantly affected by the actual ibuprofen lysinate product (ie, Nurofen Immedia and Dolormin Extra).
Comparable results with regards to key PK parameters reflecting faster absorption of ibuprofen salts including ibuprofen sodium and ibuprofen lysinate under fasted conditions were published by Legg and colleagues.16 As with the data presented here, the higher Cmax for the salts that are absorbed fastest (ibuprofen sodium and lysinate) compared with the standard formulation (ibuprofen acid) observed under fasted conditions disappeared if the study medication was administered within 20 minutes of a standardized high‐fat breakfast. Also, the pronounced difference between faster‐absorbed salts and standard, with regard to median tmax in minutes, diminished considerably under fed conditions.16
This finding could explain why rapid‐release ibuprofen formulations up to now failed to show advantages over ibuprofen acid in clinical studies investigating headache17 and makes it worth comparing the onset of action of the FDC with ibuprofen lysinate. Ibuprofen lysinate has not been investigated in headache, which hampers further assumptions on the PK/pharmacodynamics relationship.
The reported studies not only confirmed the effect of food on the PK of ibuprofen lysinate but also demonstrated that important PK parameters of ibuprofen from FDC, such as Cmax, appear less sensitive to food intake compared with ibuprofen lysinate, which may have considerable practical consequences for over‐the‐counter use in daily life. To conclusively determine whether a lower influence of food on key PK parameters constitutes a benefit in efficacy and tolerability parameters deserves further study. In our studies, all ibuprofen preparations were well tolerated.
In a recent clinical study, ibuprofen 400 mg plus caffeine 100 mg showed improved analgesic efficacy compared with 400 mg ibuprofen alone in subjects experiencing dental pain after their third molar extraction, whereby meaningful pain relief was reached 39 minutes earlier with the FDC.4 In headache, ibuprofen combined with caffeine has been shown to be more efficacious compared with ibuprofen alone.18 Thus, the improved PK properties of the FDC presented here can be assumed to add to the favorable pharmacodynamic properties of caffeine‐containing analgesic preparations in different conditions of acute pain.
Conclusions
Caffeine as part of an FDC of ibuprofen acid 400 mg and caffeine 100 mg does not affect PK parameters Cmax, tmax, and AUC of total ibuprofen when compared with ibuprofen acid when taken on an empty stomach. Taken after a meal, ibuprofen from the FDC showed higher Cmax and earlier tmax when compared with ibuprofen lysinate, with comparable AUC. Thus, real‐life conditions encompassing any gastric state between fasted and fed results in less predictable BA of ibuprofen lysinate, reflecting a potential disadvantage in PK profile compared to ibuprofen acid from the FDC.
Declaration of Conflicting Interests
T.W., R.L., and T.M. are employees of Sanofi‐Aventis Deutschland GmbH. C.S. is an employee of Boehringer Ingelheim Pharma GmbH & Co. KG. The consumer health care business was transferred to Sanofi effective on January 1, 2017.
Acknowledgments
The authors thank B. Fladung for editorial support. Additionally, the authors would like to thank H.B. Theron for editorial support and F. Hiten (both employees of FARMOVS, a clinical research organization performing clinical pharmacology studies) for their excellent contribution in developing and performing the bioanalytical methods. The authors acknowledge Alexandra Webster, of iMed Comms, Macclesfield, UK, an Ashfield Company, part of UDG Healthcare plc for editing support only, which was funded by the current marketing authorization holder Sanofi‐Aventis Groupe, Gentilly, France, in accordance with Good Publications Practice (GPP3) guidelines (http://www.ismpp.org/gpp3).
Financial Disclosure
This study was sponsored by Boehringer Ingelheim Pharma GmbH & Co. KG.
Author Contributions
T.W., R.L., C.S., and T.M. substantially contributed to study concept, design, and results interpretation. The manuscript was drafted by T.W., R.L., C.S., and T.M. All authors critically revised the manuscript for important intellectual content and approved it.
Data Sharing Statement
Qualified researchers may request access to patient‐level data and related study documents including the clinical study report, study protocol with any amendments, blank case report form, statistical analysis plan, and data set specifications. Patient‐level data will be anonymized, and study documents will be redacted to protect the privacy of trial participants. Further details on Sanofi's data‐sharing criteria, eligible studies, and process for requesting access can be found at https://www.clinicalstudydatarequest.com.
References
- 1. Rainsford KD. Ibuprofen: pharmacology, efficacy and safety. Inflammopharmacology. 2009;17:275‐342. [DOI] [PubMed] [Google Scholar]
- 2. Moore RA, Derry S, Straube S, Ireson‐Paine J, Wiffen PJ. Faster, higher, stronger? Evidence for formulation and efficacy for ibuprofen in acute pain. Pain. 2014;155:14‐21. [DOI] [PubMed] [Google Scholar]
- 3. Derry CJ, Derry S, Moore RA. Caffeine as an analgesic adjuvant for acute pain in adults (review). Cochrane Database Syst Rev. 2012;14:CD009281. [DOI] [PubMed] [Google Scholar]
- 4. Weiser T, Richter E, Hegewisch A, Muse DD, Lange R. Efficacy and safety of a fixed‐dose combination of ibuprofen and caffeine in the management of moderate to severe dental pain after third molar extraction. Eur J Pain. 2018;22:28‐38. [DOI] [PMC free article] [PubMed] [Google Scholar]
- 5. Davies NM. Clinical pharmacokinetics of ibuprofen: the first 30 years. Clin Pharmacokinet. 1998;34:101‐154. [DOI] [PubMed] [Google Scholar]
- 6. Potthast H, Dressman JB, Junginger HE, et al. Biowaiver monograph for immediate release solid oral dosage forms: ibuprofen. J Pharm Sci. 2005;94:2121‐2131. [DOI] [PubMed] [Google Scholar]
- 7. Hynninen VV, Olkkola KT, Leino K, et al. Effects of the antifungals voriconazole and fluconazole on the pharmacokinetics of S‐(+)‐ and R‐(–)‐ibuprofen. Antimicrob Agents Chemother. 2006;50:1967‐1972. [DOI] [PMC free article] [PubMed] [Google Scholar]
- 8. Tantcheva‐Poór I1, Zaigler M, Rietbrock S, Fuhr U. Estimation of cytochrome P‐450 CYP1A2 activity in 863 healthy Caucasians using a saliva‐based caffeine test. Pharmacogenetics. 1999;9(2):131‐144. [PubMed] [Google Scholar]
- 9. Higdon JV, Frei B. Coffee and health: a review of recent human research. Crit Rev Food Sci Nutr. 2006;46:101‐123. [DOI] [PubMed] [Google Scholar]
- 10. Carrillo JA, Benitez J. Clinically significant pharmacokinetic interactions between dietary caffeine and medications. Clin Pharmacokinet. 2000;39:127‐153. [DOI] [PubMed] [Google Scholar]
- 11. Cysneiros RM, Farkas D, Harmatz JS, von Moltke LL, Greenblatt DJ. Pharmacokinetic and pharmacodynamic interactions between zolpidem and caffeine. Clin Pharmacol Ther. 2007;82:54‐62. [DOI] [PubMed] [Google Scholar]
- 12. Chow SC, Liu JP. Design and Analysis of Bioavailability and Bioequivalence Studies. New York: Marcel Dekker Inc; 1992. [Google Scholar]
- 13. Derry S, Wiffen PJ, Moore RA. Single dose oral ibuprofen plus caffeine for acute postoperative pain in adults (review). Cochrane Database Syst Rev. 2015;14:CD011509. [DOI] [PMC free article] [PubMed] [Google Scholar]
- 14. Moore RA, Derry S, Wiffen PJ, Straube S. Effects of food on pharmacokinetics of immediate release oral formulations of aspirin, dipyrone, paracetamol and NSAIDs—a systematic review. Br J Clin Pharmacol. 2015;80:381‐388. [DOI] [PMC free article] [PubMed] [Google Scholar]
- 15. Klueglich M, Ring A, Scheuerer S, et al. Ibuprofen extrudate, a novel, rapidly dissolving ibuprofen formulation: relative bioavailability compared to ibuprofen lysinate and regular ibuprofen, and food effect on all formulations. J Clin Pharmacol. 2015;45:1055‐1061. [DOI] [PubMed] [Google Scholar]
- 16. Legg TJ, Laurent AL, Leyva R, Kellstein D. Ibuprofen sodium is absorbed faster than standard ibuprofen tablets: results of two open‐label, randomized, crossover pharmacokinetic studies. Drugs R D. 2014;14(4):283‐290. [DOI] [PMC free article] [PubMed] [Google Scholar]
- 17. Heintze K, Fuchs W. Effects of food on pharmacokinetics of immediate release oral formulations. Br J Clin Pharmacol. 2015;80:1239. [DOI] [PMC free article] [PubMed] [Google Scholar]
- 18. Lipton RB, Diener H, Robbins MS, Garas SY. Caffeine in the management of patients with headache. J Headache Pain. 2017;18:107. [DOI] [PMC free article] [PubMed] [Google Scholar]