

Abstract
Objectives
To compare the effectiveness of peripheral nerve stimulation utilizing a subcutaneous lead implant technique—subcutaneous nerve stimulation (SQS) plus optimized medical management (SQS + OMM arm) vs. optimized medical management alone (OMM arm) in patients with back pain due to failed back surgery syndrome.
Patients and Methods
Patients were recruited from 21 centers, in Europe, Israel, and Australia. Eligible patients were randomized (1:1) to SQS + OMM or OMM arms. Those in the SQS arm were implanted with a neurostimulator and up to two subcutaneous percutaneous cylindrical leads in the area of pain. Patients were evaluated pre‐randomization and at one, three, six, and nine months post‐randomization. The primary endpoint was the proportion of subjects with a ≥50% reduction in back pain intensity (“responder”) from baseline to nine months. Secondary outcomes included proportion of responders with a ≥50% reduction in back pain intensity at six months and ≥30% reduction at nine months, and the mean change from baseline in back pain intensity at six and nine months between the two arms.
Results
Due to the slow rate of recruitment, the study was terminated early with 116 subjects randomized. A total of 33.9% (19/56, missing: n = 20 [36%]) of subjects in the SQS + OMM arm and 1.7% (1/60, missing: n = 24 [40%]) in the OMM arm were responders at Month 9 (p < 0.0001). Secondary objectives showed a significant difference in favor of SQS + OMM arm.
Conclusion
The results indicate that the addition of SQS to OMM is more effective than OMM alone in relieving low back pain at up to nine months.
Keywords: Back pain, failed back surgery syndrome, peripheral nerve field stimulation, randomized controlled trial, subcutaneous stimulation
Introduction
Failed back surgery syndrome (FBSS) is defined as persistent low back and/or leg pain after technically and anatomically successful lumbar spine surgery 1. Most patients with FBSS suffer from mixed back and leg pain, which is often of a combined neuropathic and nociceptive nature. Some patients suffer with a predominant leg or back pain component. Back pain following lumbar surgery is more likely to have a neuropathic component than back pain without preceding surgery 2.
Regardless of the cause, chronic back pain can be debilitating and difficult to treat. It can interfere with emotional, physical, and social components of life, including mood, quality of life, daily activities, sleep, and the ability to work 3. Patients suffering from chronic pain of neuropathic origin following FBSS often fail to obtain adequate relief with conventional therapies (e.g., medication, nondrug therapies) and suffer greater pain and lower health‐related quality of life compared to patients with other chronic pain conditions 4.
Treatment for chronic pain may include pharmacologic and nonpharmacologic treatments (e.g., physical therapy, cognitive‐behavioral therapy, nerve block) 5, 6. More invasive treatments vary dependent on the underlying cause of the chronic pain. Reoperation may be indicated for some patients 7. Patients with intractable pain who cannot be managed with medications and/or other conservative treatments alone may be considered for an implant of neurostimulation therapy or intrathecal drug delivery pump. Traditional spinal cord stimulation (SCS) has demonstrated success in the treatment of patients with FBSS presenting with predominant leg pain 8, 9; however, the evidence for its efficacy in patients with predominant or pure low back pain remains inconclusive 6.
One small randomized controlled trial (RCT) and a number of longitudinal studies reported success in the treatment of low back pain in FBSS using what has now become known as peripheral nerve field stimulation (PNFS) using subcutaneously placed leads in the area of the pain 10, 11, 12, 13, 14, 15, 16. The SubQStim Study is a RCT designed to compare the effectiveness of PNFS, referred to as subcutaneous nerve stimulation (SQS) plus optimized medical management (OMM) vs. OMM alone in patients suffering from back pain due to FBSS. This is the first RCT comparing SQS to OMM and the largest RCT of SQS published to date. We present here the primary safety and effectiveness outcome results of the SubQStim study.
Patients and Methods
Study Design
The SubQStim study was a pragmatic, prospective, multicenter, randomized, parallel‐arm study (ClinicalTrials.gov Identifier NCT01711619). Patients were randomized (1:1 ratio) to either the SQS + OMM arm or the OMM alone arm using random, permuted blocks methods stratified by groups of two sites. Blinding was not possible given that SQS therapy was based on the subject receiving the perception of paresthesia and the nature of the comparative effectiveness study design. As such, the study was an unblinded, open‐label design. The study was conducted in 25 sites across Europe, Israel, and Australia, and in accordance with ISO 14155 and under the approval of each sites' ethics committee. The study protocol was published elsewhere 17.
In its entirety, the study was conceived to include two periods, first a nine‐month two parallel arm randomization phase and an open‐label long‐term follow‐up period to 36 months as described previously 17. After nine months, qualifying subjects could cross‐over arms if they wished and returned for visits at 12, 18, 24, 30, and 36 months. This paper reports on the effectiveness outcomes of the randomization phase (9 months) and safety throughout the study period (36 months).
Patients
Key inclusion criteria at screening included adults (age 18 or older) diagnosed with FBSS (i.e., persistent pain for six months following most recent back surgery, no further therapeutic surgical options, intractable back pain), who are willing and able to comply with the study requirements and are an appropriate implant candidate for the SQS system. Subjects meeting the screening eligibility criteria completed a baseline diary questionnaire for five to ten days. To qualify for the study by demonstrating predominant back pain, the individual must have additionally reported an average back pain score ≥50 mm, average leg pain score ≤30 mm on a 0–100 mm visual analog scale (VAS), and completed the diary for at least five days.
Key exclusion criteria included patients currently or previously treated with implantable neurostimulation or intrathecal drug delivery system; evidence of an active disruptive psychiatric disorder; any pain condition unrelated to FBSS severe enough to overshadow the FBSS pain; spinal fusion at more than three vertebral levels; enrollment in concurrent study; known allergy or hypersensitivity to device materials; history of coagulation disorder or lupus erythematous; or involved in current litigation regarding their back pain.
Treatments
Subjects randomized to both arms had their medical management optimized during the study period, beginning at randomization. OMM for each subject was defined by the investigator, but specifically excluded additional back surgery or the implantation of medical devices (e.g., other neurostimulation or intrathecal drug delivery therapies). OMM treatments could vary by subject, such as by type, frequency, duration, or dose.
Subjects randomized to SQS + OMM first underwent a trial period with placement of the subcutaneous leads in the area of pain powered by an external neurostimulator. A maximum of two leads (1 × 8 Standard or Pisces® Quad Plus, Medtronic, Minneapolis, MN, USA) could be implanted. Investigators could choose how many and what type of leads to use in order to provide the best paresthesia coverage of the painful area. A comfortable paresthesia within the area of back pain was deemed necessary, but a minimum percentage of coverage was not required by the protocol in order to proceed with implant.
A successful trial was defined as back pain reduction of >30% as measured by VAS OR subject had some reduction in pain as measured by VAS, along with improved function or quality of life, or a reduction in pain medications as assessed by the investigator. In addition, subjects must also describe paresthesia as comfortable and agree to proceed to final implant.
The subcutaneous electrodes and stimulators were implanted using the standard technique described in the product manuals. Subjects who met trialing success criteria proceeded to permanent implant of a rechargeable or nonrechargeable neurostimulator. Subjects could adjust settings and therapy delivery to receive as much (i.e., 24 hours per day) or as little stimulation as necessary to obtain pain relief.
Outcomes
The primary objective was to demonstrate that compared to OMM alone, a higher proportion of subjects with SQS + OMM were responders (defined as ≥50% reduction in back pain intensity from baseline to nine‐month follow‐up). Secondary objectives were to demonstrate a greater average decrease in back pain intensity with SQS + OMM than OMM alone from baseline to the six‐ and nine‐month follow‐up visits, and assess the proportion of subjects (responders) with ≥50% reduction in back pain intensity at the six‐month follow‐up visit and ≥30% reduction in back pain intensity at the nine‐month visit.
The VAS was utilized as the endpoint measurement for the primary and secondary objectives. Both back and leg pain VAS measurements were collected three times per day on a diary for seven days prior to the three‐, six‐, and nine‐month follow‐up visits. The average pain intensity for each visit was calculated as the average VAS available during that period. Decrease in pain intensity from baseline was calculated as △ v=(100*(VAS0 − VASv))/VAS0 where VAS0 is the VAS assessment associated to the baseline and VASv is the VAS assessment associated to visit V.
Additional outcome measures assessed the difference between arms and/or change from baseline for leg pain, functional disability using the oswestry disability index (ODI) 18, European quality of life five dimensions (EQ‐5D‐5L) 19, quality of life short form‐36 questions (SF‐36) 20, patient global impression of change (PGIC) 21, subject satisfaction, healthcare utilization, and pain medications. Safety included a characterization of all adverse events and device deficiencies (as defined in ISO 14155) collected throughout the study period.
Statistical Analysis
The approach to sample size calculation has been previously described 17. The original plan was to enroll up to 400 subjects to obtain 314 evaluable subjects (taking into account screen or baseline failures and post‐randomization attrition). Two interim analyses were planed after, respectively, 140 and 220 subjects had evaluable nine‐month assessments complete. The software package SAS (version 9.3, SAS Institute, Cary, NC, USA) was used for all data analyses and figures were created using R software (version 3.3.3, Auckland, New Zealand).
The primary analysis followed the intent‐to‐treat (ITT) principle for the primary and secondary objectives, i.e., comparison of arms according to randomized allocation in subjects. Additionally, per‐treatment (PT) and modified ITT analyses were also performed. The PT dataset consists of the ITT patient set for whom no major protocol deviation was reported. If no major deviation was reported, patients were analyzed according to the last treatment they received before the actual assessment. The modified ITT included the ITT patients to whom the following modifications were applied: 1 subjects randomized to the SQS + OMM arm but not definitively implanted were considered as “failures” at six and nine months if the visit is reached; 2 subjects who have passed six‐ or nine‐month follow‐up visits with missing data for six‐ or nine‐month visits were considered as “failures” if randomized to the SQS + OMM arm and as “success” if randomized to the OMM arm. No imputation of data was undertaken if the visit was not reached.
One interim analysis was performed after the decision of early termination, but prior to communication of the decision to study centers. To preserve an overall alpha error risk of 5%, the final analysis was run at a nominal alpha of 4% and the interim analysis at 1%.
Results are reported as means and standard deviations or 95% confidence intervals. Difference in responder rates were tested through Fisher's exact test. Differences between absolute change from baseline were tested using linear mixed model including values at baseline, treatment and visit information, and treatment visit interaction. If not otherwise mentioned, p‐values presented in the text correspond to the overall treatment effect being different from zero.
Results
In February 2016, due to prolonged recruitment challenges, the study sponsor chose to terminate the study prior to completing enrollment. The decision was endorsed by the Trial Steering Committee prior to performing any interim data analyses. The decision was not based on any concerns about patient safety or product reliability. Prior to termination, 162 subjects were enrolled (consented), between January 2013 and January 2016 in 21 sites, of which 116 were randomized: 56 in the SQS + OMM arm and 60 in the OMM arm. Due to early study termination, subjects were not provided an opportunity to complete the study and attend all visits, thus subjects were discontinued at various time points in the study with 74 completing the nine‐month primary endpoint visit (Fig. 1). Enrollment by site is provided in Supporting Information Table S1.
Figure 1.
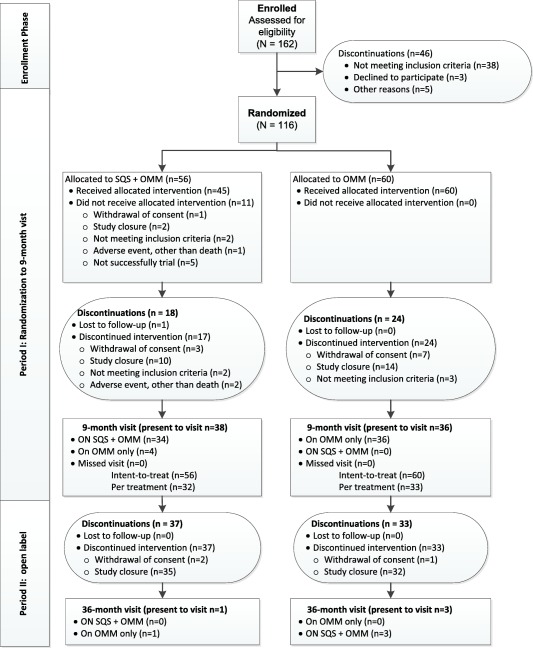
CONSORT diagram of patient flow.
Demographic Characteristics
At baseline both arms were similar for demographic data (Table 1). Pain was likely neuropathic (Douleur Neuropathique 4 score ≥4) in 48.2% of subjects. Subjects reported relatively low health‐related quality of life (EQ‐5D‐5L UK index: 0.41 ± 0.23; EQ‐5D‐5L‐VAS: 43.6 mm ± 21.2) and severe disability (mean ODI: 49.4 ± 12.7).
Table 1.
Demographics.
| Variable | SQS + OMM | OMM | All |
|---|---|---|---|
| n = 56 | n = 60 | N = 116 | |
| Age at inclusion (years; mean ± SD) | 50.9 ± 10.9 | 52.2 ± 11.4 | 51.6 ± 11.1 |
| Gender male (N, %) | 24 (42.9%) | 26 (43.3%) | 50 (43.1%) |
| Time since onset of back pain (years; median [minimum; maximum]) | 9.0 [1;48] | 9.5 [2;40] | 9.0 [1;48] |
| Time since onset of back pain (years; mean ± SD) | 13.5 ± 11.0 | 13.1 ± 9.9 | 13.3 ± 10.4 |
| Back pain intensity at baseline (VAS 0–100 mm; mean ± SD) | 68.8 ± 13.4 | 70.1 ± 14.0 | 69.5 ± 13.7 |
| Leg pain intensity at baseline (VAS 0–100 mm; mean ± SD) | 8.9 ± 10.8 | 6.8 ± 11.5 | 7.8 ± 11.2 |
| Time since last spinal surgery (years; mean ± SD) | 5.1 ± 5.1 | 6.3 ± 6.8 | 5.7 ± 6.1 |
| Previous lumbar or lower thoracic spinal surgeries by subject (mean ± SD) | 2.6 ± 1.6 | 2.5 ± 1.5 | 2.5 ± 1.5 |
| Number of previous back pain drug categories of treatments tried (mean ± SD) | 5.5 ± 2.4 | 5.0 ± 2.6 | 5.2 ± 2.6 |
| Number of nonsurgical, nonpharmaceutical back pain categories of treatments tried (mean ± SD) | 4.1 ± 2.3 | 3.6 ± 2.2 | 3.8 ± 2.3 |
SD, standard deviation.
Of the 56 subjects randomized to SQS + OMM, 52 underwent the test stimulation procedure. Mean test stimulation duration was 16.0 ± 8.7 days (range 4–36). The longer duration is in part due to legal Belgian requirements for a 28‐day trial period. Excluding subjects from Belgian sites, the mean duration moderately reduces to 13.5 ± 7.0 days (range 4–34). One individual did not start the testing period due to early study termination and three others were discontinued prematurely for other reasons. Of the 52 implanted, 51 completed the test stimulation phase (one individual did not complete the test stimulation phase due to early termination of the study). Of the 51 subjects completing the test stimulation phase, 46 (90.2%) had a successful trial and agreed to proceed to permanent implant. As a reason to not proceed to implant, five (9.8%) had no significant pain reduction. Only one subject found the feeling of paresthesia uncomfortable.
Of the 46 subjects that agreed to proceed to permanent implant, 45 were successfully implanted. One individual who had a successful trial discontinued the study due to an adverse event unrelated to the therapy.
For those subjects permanently implanted (n = 45), 32 (71.1%) had the test stimulation leads remain in place (i.e., buried or definitive lead trial), whereas 13 (28.9%) had the test stimulation lead(s) removed and replaced with new leads. Nearly all subjects (n = 44; 97.8%) had two leads implanted. Lead type used was fairly split between wide‐spaced four‐contact (n = 47; 52.8%) and wide‐spaced eight‐contact leads (n = 40; 44.9%). The first lead was placed vertically in 25 subjects (55.6%), horizontally in 17 (37.8%) subjects, and diagonally for 3 (6.7%) subjects; results were similar for the second lead. The first lead was placed in the center or within of the area of pain in 31 subjects (68.9%), bracketing in 6 (13.3%) subjects, lateral in 6 (13.3%) subjects, and medial for 2 (4.4%) subjects; results were similar for the second lead. Most subjects (n = 34; 75.6%) were implanted with a nonrechargeable neurostimulator (Model 37702 or 97702 PrimeAdvanced®, Medtronic, Minneapolis MN, USA). Percent of paresthesia coverage was not directly collected within the study; however, an exploratory analysis can be made by overlapping the pain map and paresthesia maps. Considering those subjects who underwent permanent implant, had both pain map and paresthesia map data available, and were receiving stimulation and indicated feeling paresthesia at implant (n = 24), nine (37.5%) had 100% overlap of pain map boxed areas ticked and paresthesia map boxed areas ticked, two (8.3%) subjects had 70–79% overlap, seven (29.2%) had 50–59% overlap, five (20.8%) had 1–50% overlap, and one (4.2%) had no overlap. It should be noted that maps were used to indicate pain or paresthesia somewhere within the numbered boxed area. Conclusions cannot be drawn regarding the quality or intensity of the pain, nor how much of the boxed area had pain or paresthesia.
Programing parameters were left open to the study investigator, with the exception that rate must not exceed 300 Hz. The goal of programing was to obtain a comfortable paresthesia feeling over the painful area. Programing at trial and implant were similar. For those subjects permanently implanted, most subjects (n = 34; 75.6%) had Group A set with one to two programs. Mean frequencies were set between 54.2 ± 26.3 Hz and 55.5 ± 25.3 Hz. Program 1 was set with a mean pulse width of 307.6 µsec ± 97.8 and mean amplitude of 2.1 volts ± 1.6. Program 2 was set with a mean pulse width of 289.2 µsec ± 98.3 and mean amplitude of 2.1 volts ± 1.9. In most subjects (85.3%), cycling was programed off and a soft start (ramp up) was set at 4 sec. At last reported visit in the 45 permanently implanted, most subjects (n = 40; 88.9%) continued to have Group A set with one to two programs. Mean frequencies were set between 51.3 Hz and 65.3 Hz. Program 1 was set with a mean pulse width of 335.3 µsec ± 87.9 and mean amplitude of 2.3 volts ± 2.3. Program 2 was set with a mean pulse width of 320.4 µsec ± 86.4 and mean amplitude of 2.9 volts ± 2.4.
Primary Endpoint—Responder Rate at Nine Months
For the primary outcome, the responder rate (≥50% reduction in back pain intensity) in the SQS + OMM arm was 33.9% (n = 19; 95% confidence interval [21.5–46.3%]) compared to 1.7% (n = 1; 95% confidence interval [0.0–4.9%]) in the OMM arm in the ITT analysis (Fig. 2, Table 2). The difference between arms in the ITT analysis is statistically significant (Fisher's exact test—p < 0.0001). When removing missing data due to early study termination, the responder rate in the SQS + OMM arm is 52.8% (95% confidence interval [36.5–69.1%]) compared to 2.8% (95% confidence interval [0.0–8.1%]). In the PT analysis, the difference in responder rates was also statistically significant with 56.7% (95% confidence interval [38.9–74.4%]) and 2.9% (95% confidence interval [0.0–8.4%]) in the SQS + OMM and OMM arms, respectively (Fisher's exact test—p < 0.0001) (Fig. 3). Results were similar in the worst case modified ITT analysis with responder rate in the SQS + OMM arm of 33.9% (95% confidence interval [21.5–46.3%]) compared to 1.7% (95% confidence interval [0.0–4.9%]) (Fisher's exact test—p < 0.0001).
Figure 2.
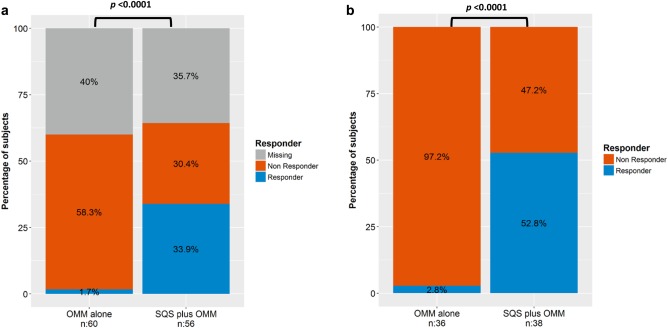
a. Primary endpoint responder rate by treatment groups: ITT (n = 116). b. ITT—considering only patients who had the chance to reach Month 9 visit.
Table 2.
Primary Outcome of Responder Rate (≥50% Pain Relief at Nine Months).
| Analysis of back pain | SQS + OMM | OMM | Between‐group difference p‐value | ||||
|---|---|---|---|---|---|---|---|
| Total (N) | Missing (N, %) | Responder (N, %) | Total (N) | Missing (N, %) | Responder (N, %) | ||
| ITT | 56 | 20 (35.7%) | 19 (33.9%) | 60 | 24 (40.0%) | 1 (1.7%) | <0.0001 |
| Per‐treatment | 30 | 0 (0%) | 17 (56.7%) | 35 | 0 (0%) | 1 (2.9%) | <0.0001 |
| Modified ITT | 56 | 10 (17.9%) | 19 (33.9%) | 60 | 24 (40.0%) | 1 (1.7%) | <0.0001 |
Figure 3.
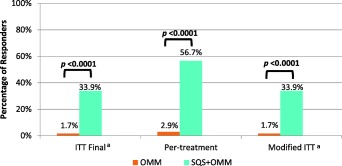
Analyses of primary endpoint. Fisher's exact test two‐tailed. aPercentage (%) considers missing value, responder, and nonresponder.
Secondary Endpoints—Pain Intensity and Responder Rates at Six and Nine Months
The mean baseline VAS scores were similar in both arms, 68.8 mm (SD = 13.4; n = 56) and 70.2 mm (SD = 14.0; n = 60) in SQS + OMM and OMM arms, respectively. In the SQS + OMM arm, the mean back pain score was reduced to 38.4 mm (SD = 24.5; n = 40) at six months and 36.9 mm (SD = 24.0; n = 36) at nine months, whereas in the OMM arm, scores remained stable at 69.8 mm (SD = 18.2; n = 40) at six months and 67.5 mm (SD = 18.1; n = 36) at nine months (Fig. 4). The mean absolute change from baseline to nine months observed in the SQS + OMM arm was −33.3 mm (SD = 24.5) compared to −2.7 mm (SD = 16.0) in the OMM arm (Linear model adjusted for pain intensity at baseline—p < 0.0001). The percent reduction in absolute back pain intensity from baseline to nine months observed in the SQS + OMM arm was 47.0% (SD = 32.3) compared to 2.5% (SD = 22.9) in the OMM arm (Table 3).
Figure 4.
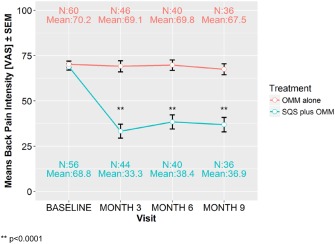
Mean back pain intensity over time by treatment groups: ITT (n = 116), means ± SEM. ** p < 0.0001.
Table 3.
Secondary Outcomes.
| Analysis | Arm: | p‐value | |
|---|---|---|---|
| SQS + OMM | OMM | ||
| Mean reduction in back pain intensity between baseline and follow‐up: ITT; relative difference [%] | |||
| At nine months (n = 72) | 47.0% ± 32.3 | 2.5% ± 22.9 | <0.0001 |
| At six months (n = 80) | 45.6% ± 32.1 | 0.3% ± 21.1 | <0.0001 |
| At three month ad hoc (n = 90) | 52.4% ± 35.2 | 2.5% ± 23.3 | <0.0001 |
| Responder rate (≥50% reduction) (N, %) | |||
| At six months (n = 116), ITT | 15 (26.8%) | 1 (1.7%) | 0.0002 |
| At six months (n = 65), PT | 12 (40.0%) | 1 (2.9%) | 0.0003 |
| Responder rate (≥30% reduction) (N, %) | |||
| At nine months (n = 116), ITT | 25 (44.6%) | 3 (5.0%) | <0.0001 |
| At nine months (n = 65), PT | 21 (70.0%) | 4 (11.4%) | <0.0001 |
At the six‐month visit, the responder rate of ≥50% reduction in back pain intensity was 26.8% (15/56) in the SQS + OMM arm compared to 1.7% (1/60) in the OMM arm in the ITT analysis (Fisher's exact test—p = 0.0002) (Table 3). In the PT analysis, the responder rate in the SQS + OMM arm was 40.0% compared to 2.9% in the OMM arm (Fisher's exact test—p = 0.0003). The responder rate of ≥30% reduction in back pain intensity at the nine‐month visit, was 44.6% (25/56) with SQS + OMM compared to 5.0% (3/60) with OMM (Fisher's exact test—p < 0.0001) in the ITT analysis. In the PT analysis, the responder rate is 70.0% with SQS + OMM compared to 11.4% with OMM alone (Fisher's exact test—p < 0.0001).
Additional Measures
A statistically significant treatment effect favoring SQS + OMM was found for disability (ODI index, p < 0.0001), the quality of life index (EQ‐5D‐5L index, p = 0.0003), and PGIC (Fisher's exact test—p < 0.0001) when compared to OMM alone (Table 4). Subjects in both arms would recommend their treatment to patients suffering from similar pain and based on their experience, would agree to their treatment again; however, no difference between arms was observed at nine months (Fisher's exact test—p = 0.547 and p = 0.644, respectively). The quality of life evaluated with the SF‐36 showed a greater improvement in the SQS + OMM arm in the mental component score (p = 0.0062), but not in the physical component score (p = 0.293) compared to OMM alone. There was no difference between arms in the mean change in leg pain intensity (p = 0.543).
Table 4.
Additional Outcomes.
| Additional measure | SQS + OMM | OMM alone |
Between group p‐value * |
||||
|---|---|---|---|---|---|---|---|
| Baseline | Nine months | Absolute change from baseline [%, SD] | Baseline | Nine months | Absolute change from baseline [%, SD] | ||
| Oswestry disability index mean (SD) † | |||||||
| ITT | 51.9 ± 13.2 | 42.1 ± 18.0 | −12.4 ± 16.5 | 47.1 ± 11.8 | 46.6 ± 11.6 | −0.1 ± 8.3 | <0.0001 |
| PT | 52.8 ± 12.1 | 40.7 ± 15.2 | −12.1 ± 16.3 | 47.0 ± 11.5 | 46.7 ± 12.3 | −0.3 ± 8.1 | <0.0001 |
| SF‐36 physical component score mean (SD) ‡ | |||||||
| ITT | 28.5 ± 6.3 | 30.4 ± 6.3 | 2.1 ± 6.4 | 30.2 ± 5.2 | 30.4 ± 5.6 | 1.0 ± 5.2 | 0.293 |
| PT | 29.0 ± 5.9 | 30.3 ± 6.4 | 1.2 ± 5.7 | 29.2 ± 5.7 | 30.3 ± 5.6 | 1.1 ± 5.3 | 0.335 |
| SF‐36 mental component score mean (SD) ‡ | |||||||
| ITT | 42.0 ± 10.9 | 44.8 ± 11.5 | 3.8 ± 11.3 | 45.2 ± 11.1 | 45.4 ± 11.1 | −1.6 ± 8.4 | 0.0062 |
| PT | 41.2 ± 10.1 | 45.6 ± 10.5 | 4.4 ± 10.9 | 47.0 ± 9.9 | 46.0 ± 11.5 | −1.0 ± 7.8 | 0.0359 |
| Leg Pain VAS (SD) † | |||||||
| ITT | 8.9 ± 10.8 | 12.3 ± 17.8 | 5.2 ± 14.9 | 6.8 ± 11.5 | 5.9 ± 11.4 | 1.0 ± 5.2 | 0.543 |
| PT | 7.2 ± 8.2 | 8.4 ± 11.8 | 1.1 ± 8.4 | 4.6 ± 7.7 | 8.1 ± 17.6 | 3.5 ± 12.9 | 0.045 |
| EQ‐5D‐5L utility score with a UK value set; mean (SD) ‡ | |||||||
| ITT | 0.40 ± 0.22 | 0.56 ± 0.29 | 0.19 ± 0.25 | 0.43 ± 0.23 | 0.45 ± 0.22 | −0.01 ± 0.15 | 0.0003 |
| PT | 0.39 ± 0.20 | 0.59 ± 0.27 | 0.20 ± 0.24 | 0.45 ± 0.22 | 0.45 ± 0.22 | −0.00 ± 0.16 | <0.0001 |
| Patient global impression of change categories of very much improved and much improved (N, %) | |||||||
| ITT | N/A | 20 (33.3%) | N/A | N/A | 1 (1.7%) | N/A | <0.0001 |
| PT | N/A | 18 (60%) | N/A | N/A | 1 (2.9%) | N/A | <0.0001 |
| Would recommend their treatment to patients suffering similar pain (Yes: N, %) | |||||||
| ITT | N/A | 33 (58.9%) | N/A | N/A | 29 (48.3%) | N/A | 0.547 |
| PT | N/A | 27 (90.0%) | N/A | N/A | 27 (77.1%) | N/A | 0.2012 |
| Based on experience, would agree to their treatment again (Yes: N, %) | |||||||
| ITT | N/A | 29 (48.3%) | N/A | N/A | 32 (57.1%) | N/A | 0.644 |
| PT | N/A | 27 (90.0%) | N/A | N/A | 27 (77.1%) | N/A | 0.2012 |
*Between group p‐value of treatment effect in linear regression model.
†A negative change indicates an improvement in between baseline and follow‐up visits.
‡A positive change indicates an improvement in between baseline and follow‐up visits.
ITT, intent‐to‐treat; N/A, not applicable; PT, per‐treatment; SD, standard deviation; VAS, visual analog scale.
Safety
The safety patient set consisted of all subjects of the ITT analysis set who started any of the study procedures, independent of the treatment to which they had been randomized (n = 115). One individual stopped the study directly after randomization due to inclusion/exclusion criteria not met. The 51 subjects who were randomized to SQS + OMM and received the permanent implant were exposed to the SQS device for a total of 24,508 days, or a mean of 480.5 ± 297.8 days. A further 28 subjects who were randomized to OMM and later crossed over (post‐nine‐month visit) and received the permanent implant, were exposed to the SQS device for a total of 8433 days, or a mean of 301.2 ± 265.3 days.
There were 193 events reported throughout the study period up to the 36‐month visit, 103 in the SQS + OMM arm and 90 in the OMM arm. Of the 193 total events, 178 were adverse events and 7 were judged to be device deficiencies only. Eight additional device deficiencies were associated with an adverse event. Forty‐nine subjects experience at least one adverse event: 29 (52.7%) in the SQS + OMM arm and 20 (33.3%) in the OMM arm. The majority of events (67.2%) were categorized as “other” etiology (i.e., not etiology of biological, hardware, therapy, human factors, or medication) (Fig. 5). The second most frequent etiology was medication (18.3%), followed by biological‐related (7.5%), hardware‐related (2.7%), and therapy‐related (2.2%). The most common adverse events occurring in at least 5% of subjects were back pain (7.0%) and pain in extremity (5.2%). Across all 80 implanted subjects (SQS + OMM and OMM alone who later crossed over), a total of four (5.0%) device or implant related‐infections occurred, three (3.8%) lead fractures (two noted during the implant procedure and one lead damage postimplant), and two (2.5%) lead dislocation/migrations. There were no cases of lead erosion or subject death.
Figure 5.
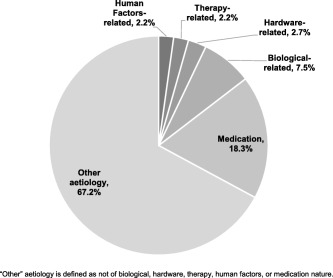
Adverse event etiology.
Discussion
This is the first RCT comparing the addition of SQS to OMM alone and the largest RCT of SQS for the treatment of the low back pain of FBSS.
Although the study was terminated early with 116 subjects randomized (original target sample size ≤314), the primary and secondary objectives of the study were met. Compared to OMM alone, the SQS + OMM arm has a statistically significant greater proportion of subjects with a ≥50 and ≥30% reduction in back pain intensity from baseline to the six‐ and nine‐month follow‐up visits. Furthermore, the SQS + OMM arm showed a greater mean decrease in back pain intensity from baseline to the six‐ and nine‐month follow‐up visits than compared to OMM alone. As chance to complete six‐ and nine‐month follow‐up visits was not given to all subjects, we show a lower responder rate in the ITT analysis due to missing data for more than a third of subjects. Despite the large number of adverse events reported, the vast majority were unrelated to the device or therapy. Events with an etiology of pain medications were more frequently reported than those associated with the implant procedure, device or therapy.
Our study adds to the limited literature on PNFS or SQS in patients with predominant to pure back pain. The only other RCT of PNFS alone was published by McRoberts et al. in 2013 12 where 32 subjects were randomized to various programing settings applied during the trial phase. Long‐term follow‐up was observational in nature. At one‐year follow‐up, significant differences in VAS scores were observed between baseline and all follow‐up visits. While a statistically significant improvement in SF‐36 PCS was observed, the study failed to demonstrate significant improvement in SF‐36 MCS. A number of case series reported positive outcomes of PNFS 10, 11, 13, 14, 15, 16. Sator‐Katzenschlager et al. (2010) described a retrospective case series of 111 implanted, chronic pain patients. Pain intensity was reduced in 92% of patients at three‐month follow‐up 14. Kloimstein et al. (2014) reported a 118 patient prospective series examining the effectiveness of PNFS alone or in combination with SCS to treat chronic back pain 11. Of the 40 implanted with PNFS alone, 28 completed the six‐month visit and showed a statistically significant improvement in back pain intensity compared to baseline. Finally, Verrills et al. (2011) reported the outcomes of 100 consecutive private practice patients receiving PNFS for the treatment of chronic pain of various etiologies 15. The authors demonstrated an average pain reduction of 4.2 ± 2.5 pain scale points on an 11‐point scale following PNFS (preimplant pain score of 7.4 ± 1.7) over a follow‐up period of 8.1 ± 4.7 months (range 1–23 months). Of the 100 cases, 44 were reported to be suffering from lumbosacral pain.
These studies show relatively similar results for improvement in pain intensity in PNFS patients, reducing from a baseline range between 7.4 and 8.0 (on 0–10 scale), to between 3.2 and 4.7 at follow‐up visits 11, 12, 14, 15. For our study, mean pain scores in the SQS + OMM arm started slightly lower (baseline 68.8 mm on 100 mm VAS), but reduced to 33.3, 38.4, and 36.9 mm at three‐, six‐, and nine‐month visits, respectively. The ODI improvement ranged from 11.2 to 12.5 points, depending on the follow‐up visit (Month 3, 6, or 9; ITT set), whereas the Kloimstein et al. trial showed a smaller reduction from 38.2 at baseline to 34.6 at six months. For quality of life SF‐36, our study fell short of the improvements seen in the literature for the PCS; however, surpassed literature in the MCS. Overall, our treatment arm results align well with these published studies.
Compared to SCS, the responder rate to PNFS therapy is limited, for example the PROCESS study randomized 100 FBSS patients to receive SCS and Conventional Medical Management (SCS Group) or conventional medical management alone (CMM Group) reported an ITT responder rate of 48% at six months, higher than our responder rate of 34% reported at nine months 8. Caution should be taken in direct comparisons of the ITT responder rate of this study to other trials as ours is restricted by the limited number of subjects having the opportunity to complete the nine‐month follow‐up. An important comparison is the simplicity of the implant technique as well as enhanced safety profile compared to SCS. In our study across 80 implanted patients, there were four (5%) infections, three (3.8%) lead fractures (two of these occurred during the implant procedure), and only two (2.5%) lead migrations compared to 4/42 infections (10%) and 6/42 lead migrations (14%) and 3/42 lead fractures (7%) in the PROCESS study at 24 months 22. While the low adverse event figures partially reflect hardware improvement, they also in our opinion reflect the simplicity of the technique. Furthermore, the absence of epidural space access will provide an attractive option for a subgroup of patients with concerns about spinal cord damage or those with existing epidural scarring.
The improvement in the disability index, the quality of life and the global impression of change observed in the SQS + OMM arm is in contrast with the fact that patients of both arms would similarly recommend their treatment to patients suffering from similar pain or would agree to the same treatment again. This finding is not uncommon and might be due to a “study effect” whereby patients express their satisfaction as a result of being managed, regardless of the actual efficacy of the treatment, as was observed before 23.
Both SCS and SQS are believed to provide pain relief by activation of non‐nociceptive Aß fibers, while the activation of Aδ fibers will produce pain. Morch et al. have proposed a mathematical model of SQS based on the anatomy of the skin and subcutaneous tissue 24. The model predicts an optimal implantation depth of 10–15 mm below the skin surface to achieve activation of the greatest area of Aß fibers and the smallest area of A∂ fibers. Using a similar computational model, Frahm et al. have found the lowest threshold of Aß fibers when nerve and electrode were in parallel, with currents within therapeutic range (<10 V) of PNFS 25.
Vera‐Portocarrero et al. (2013) used rodent models of inflammatory and neuropathic pain to investigate subcutaneous electrical stimulation (SQS) vs. transcutaneous electrical nerve stimulation (TENS) 26. The rodent model of subcutaneous stimulation was compared to a rodent TENS model, since an argument could be made that SQS is just “TENS under the skin.” When comparing both models, there were differences in the effects of each therapy modality on rodent models of neuropathic pain and inflammatory pain. SQS was effective in the neuropathic pain and had cumulative effects on hyper sensitivity of both inflammatory and neuropathic pains with reduction mechanical hypersensitivity observed on Days 3 and 4, thermal hyperalgesia in first four days and reductions in cold allodynia observed only in the first day of stimulation. In contrast TENS was effective in the inflammatory model only and tolerance to its antihypersensitivity effects developed with time. These results indicated that SQS and TENS act through difference mechanism of action.
Further characterization was done with the SQS model. The importance of the location of the lead implant was demonstrated by determining that implantation of the subcutaneous lead in the primary area of injury was necessary to have effectiveness 27. Additionally, the length of stimulation and the amplitude of stimulation influence the amount of effectiveness that SQS has in a rodent model of neuropathic pain 28, 29. Mainly the longer the stimulation and the higher the amplitude, the greater the effectiveness.
These results demonstrate that SQS produces anti‐nociceptive effects in rats with nerve injury. Parameter optimization becomes clearly important since in the rodent model, location, length, and amplitude are critical parameters for the effectiveness of SQS. Results point to different mechanism being involved for the effects of SQS and TENS. This novel model of SQS as a therapy for pain can be used for further translational mechanistic studies.
Study Strengths and Limitations
This study was designed to be a pragmatic trial to demonstrate the real‐world effectiveness of SQS therapy in addition to OMM in FBSS patients with chronic back pain and little to no radicular leg pain. The multicenter participation across Europe, Israel, and Australia, support the generalizability of the results.
The study had a number of potential limitations. First, blinding was not feasible in a comparative study vs. nonsurgical intervention. To minimize the placebo effect of receiving SQS therapy, the primary endpoint was assessed at nine months, rather than the more commonly used three‐ or six‐month time points.
Second, subjects enrolled in the study could be considered to have already failed OMM upon enrollment and by definition of FBSS and study criteria, subjects have previously tried at least three treatments for their back pain. Thus a significant improvement in the OMM alone arm may not be expected. To guard against treatment bias, investigators were instructed to optimize medical management for all study subjects. Third, the decision to terminate early resulted in a smaller number of patients contributing to the final ITT analysis, which potentially limits the conclusions that can be reached from the study. However, the overall alpha error risk for study was maintained at 5%.
Finally, the study is not able to inform on the long‐term effectiveness of SQS. While the study initially planned to follow all patients for 36 months, only four reached that follow‐up point.
Conclusions
This is the largest multicenter RCT comparing OMM to SQS + OMM in patients with back pain due to FBSS. Despite early termination due to recruitment difficulties, the results indicate that the addition of SQS to OMM is clinically and statistically more effective than OMM alone in relieving low back pain at up to nine months. These findings support the results of a number of earlier uncontrolled case series.
Authorship Statements
Profs. Eldabe, Taylor, and Green contributed to the design and oversight of the trial and served as members of the Trial Steering Committee. Profs. Eldabe and Buchser, and Drs. Goossens, Bouche, and Gültuna conducted the study, including patient recruitment and data collection. Mrs. Tinsley provided sponsor‐level trial management and Mr. Luyet performed data analyses. Profs. Eldabe and Buchser drafted the manuscript and all authors contributed to and approved the final manuscript. Medtronic provided funding for the study and performed the statistical analyses with review of the final clinical study report by the Trial Steering Committee.
COMMENTS
This is a well‐designed and pragmatic article on the widely used but poorly explored method of neuromodulation ‐ subcutaneous nerve stimulation (SQS). The authors showed beyond any doubt that it is a valid option in treatment of LBP in patients with failed back surgery. The jury is still out if it is more or less effective than other options, i.e. Burst or HF10. One of the subjects that was not touched in the discussion was the results of the studies that showed superiority of SCS/SQS combination over SQS alone.
Eugene Mironer, MD
Asheville, NC, USA
***
This is an interesting, well designed and comprehensively conducted multicenter study. To coordinate research centers across three Continents was an impressive venture. Congratulations to Prof. Eldabe and his colleagues. PNFS/SQS is a relatively simple technique which can be offered as a useful alternative to more invasive neurostimulation epidural options. It has been shown in this study that an addition of SQS to OMM is more effective in relieving low back pain than OMM alone in failed back surgery syndrome. The role of frequency in PNS (including PNFS) has not been fully determined and not sufficiently investigated. In this study the frequency applied was set around 55 Hz. However, the low frequency (1‐10 Hz), as has been shown in multiple animal studies, has a profound effect on a peripheral nerve conduction. In my personal PNS experience, the low frequency (2‐10 Hz) was nearly always a preferred patient's option. Therefore, I believe that if the low frequency stimulation was employed in this study, the positive results would be even more prominent.
Teodor Goroszeniuk, MD
London, United Kingdom
***
Sub Q therapy for LBP has been looked at before. This larger study, prospective in nature, allows a closer look. At 9 months there appears to be modest improvement in numerous areas. More importantly, data at 18 or 24 months would be more valuable as we have seen in the past that efficacy can wane after a year or two.
Richard Paicius, MD
Newport Beach, CA, USA
Comments not included in the Early View version of this paper.
Supporting information
Table S1: Enrolment by Site
Acknowledgments
Thank you to the patients who participated in this trial and to the Study Investigators and their team who contributed to enrollment, data collection, and data quality: Prof. Sam Eldabe, Dr. Stefan Goossens, Prof. Eric Buchser, Dr. Bénédicte Bouche, Dr. Ismail Gültuna, Dr. Ann Ver Donck, Prof. Patrick Mertens, Dr. Sylvain Fowo, Dr. Herbert Rooijakkers, Dr. Vincent Hoffmann, Dr. James O'Callaghan, Prof. Astrid Chiari, Dr. Rupert Reichart, Dr. Renate Munnikes, Dr. Charles Brooker, Dr. Silviu Brill, Prof. Rudolph Likar, Dr. Olivier De Coster, Dr. Wolfgang Welke, Dr. Enrique Ortega, and Dr. Bruce Mitchell.
For more information on author guidelines, an explanation of our peer review process, and conflict of interest informed consent policies, please go to http://www.wiley.com/WileyCDA/Section/id-301854.html
Source(s) of financial supports: Medtronic, Inc.
Conflict of Interest: S. Eldabe has acted as consultant for Medtronic in relation to this study and has received payments for time spent on Trial Steering Committee meetings and other study related activities. His institution received payments for enrollment of patients for this study. He attended Advisory boards and received consulting fees from Medtronic, Boston Scientific, Saluda Medical, and Mainstay Medical. R. Taylor and C. Green have acted as consultants for Medtronic in relation to this study and have received payments for time spent on Trial Steering Committee meetings and other study related activities. R. Taylor has also attended Advisory boards and provided consultancy, receiving consulting fees from Medtronic, Nevro, and Mainstay Medical. S. Eldabe, R. Taylor, and C. Green contributed to the design of the trial as members of the Trial Steering Committee. S. Goossens has attended Advisory boards and received consulting fees from Medtronic and Abbott. His institution received payments for enrollment of patients for this study. B. Bouche and her institution have received payments for enrollment of patients for this study. I. Gultuna's institution has received payments for enrollment of patients for this study. J. Tinsley and P. P. Luyet are employees of Medtronic. J. Tinsley acted as global clinical study manager and P. P. Luyet performed all statistical analyses. E. Buchser is a consultant for Medtronic and his institution received payments for enrollment of patients for this study. He has also attended Advisory boards of Medtronic and received consulting fees.
References
- 1. Taylor RS, Buyten J‐P, Buchser E. Spinal cord stimulation for complex regional pain syndrome: a systematic review of the clinical and cost‐effectiveness literature and assessment of prognostic factors. Eur J Pain 2006;10:91–101. doi: 10.1016/j.ejpain.2005.02.004. [DOI] [PubMed] [Google Scholar]
- 2. Förster M, Mahn F, Gockel U et al. Axial low back pain: one painful area–many perceptions and mechanisms. PLoS One 2013;8:e68273. doi: 10.1371/journal.pone.0068273. [DOI] [PMC free article] [PubMed] [Google Scholar]
- 3. Dubois MY, Gallagher RM, Lippe PM. Pain medicine position paper. Pain Med 2009;10:972–1000. doi: 10.1111/j.1526-4637.2009.00696.x. [DOI] [PubMed] [Google Scholar]
- 4. McDermott AM, Toelle TR, Rowbotham DJ, Schaefer CP, Dukes EM. The burden of neuropathic pain: results from a cross‐sectional survey. Eur J Pain 2006;10:127–135. doi: 10.1016/j.ejpain.2005.01.014. [DOI] [PubMed] [Google Scholar]
- 5. Chan C, Peng P. Failed back surgery syndrome. Pain Med 2011;12:577–606. doi: 10.1111/j.1526-4637.2011.01089.x. [DOI] [PubMed] [Google Scholar]
- 6. Cho JH, Lee JH, Song KS et al. Treatment outcomes for patients with failed back surgery. Pain Physician 2017;20:E29–E43. https://libcontent.medtronic.com:2908/pubmed/28072795. [PubMed] [Google Scholar]
- 7. Dagenais S, Tricco AC, Haldeman S. Synthesis of recommendations for the assessment and management of low back pain from recent clinical practice guidelines. Spine J 2010;10:514–529. doi: 10.1016/j.spinee.2010.03.032. [DOI] [PubMed] [Google Scholar]
- 8. Kumar K, Taylor RS, Jacques L et al. Spinal cord stimulation versus conventional medical management for neuropathic pain: a multicentre randomised controlled trial in patients with failed back surgery syndrome. Pain 2007;132:179–188. doi: 10.1016/j.pain.2007.07.028. [DOI] [PubMed] [Google Scholar]
- 9. North RB, Kidd DH, Farrokhi F, Piantadosi SA. Spinal cord stimulation versus repeated lumbosacral spine surgery for chronic pain: a randomized, controlled trial. Neurosurgery 2005;56:98–107. https://libcontent.medtronic.com:2908/pubmed/15617591. [DOI] [PubMed] [Google Scholar]
- 10. Burgher AH, Huntoon MA, Turley TW, Doust MW, Stearns LJ. Subcutaneous peripheral nerve stimulation with inter‐lead stimulation for axial neck and low back pain: case series and review of the literature. Neuromodulation 2012;15:100–107. doi: 10.1111/j.1525-1403.2011.00388.x. [DOI] [PubMed] [Google Scholar]
- 11. Kloimstein H, Likar R, Kern M et al. Peripheral nerve field stimulation (PNFS) in chronic low back pain: a prospective multicenter study. Neuromodulation 2014;17:180–187. doi: 10.1111/ner.12139. [DOI] [PubMed] [Google Scholar]
- 12. McRoberts WP, Wolkowitz R, Meyer DJ et al. Peripheral nerve field stimulation for the management of localized chronic intractable back pain: results from a randomized controlled study. Neuromodulation 2013;16:565–575. doi: 10.1111/ner.12055. [DOI] [PubMed] [Google Scholar]
- 13. Paicius RM, Bernstein CA, Lempert‐Cohen C. Peripheral nerve field stimulation for the treatment of chronic low back pain: preliminary results of long‐term follow‐up – a case series. Neuromodulation 2007;10:279–290. doi: 10.1111/j.1525-1403.2007.00116.x. [DOI] [PubMed] [Google Scholar]
- 14. Sator‐Katzenschlager S, Fiala K, Kress HG et al. Subcutaneous target stimulation (STS) in chronic noncancer pain: a nationwide retrospective study. Pain Pract 2010;10:279–286. doi: 10.1111/j.1533-2500.2009.00351.x. [DOI] [PubMed] [Google Scholar]
- 15. Verrills P, Vivian D, Mitchell B, Barnard A. Peripheral nerve field stimulation for chronic pain: 100 cases and review of the literature. Pain Med 2011;12:1395–1405. doi: 10.1111/j.1526-4637.2011.01201.x. [DOI] [PubMed] [Google Scholar]
- 16. Yakovlev AE, Resch BE, Yakovleva VE. Peripheral nerve field stimulation in the treatment of postlaminectomy syndrome after multilevel spinal surgeries. Neuromodulation 2011;14:534–538; discussion 538. doi: 10.1111/j.1525-1403.2011.00387.x. [DOI] [PubMed] [Google Scholar]
- 17. Eldabe S, Kern M, Peul W, Green C, Winterfeldt K, Taylor RS. Assessing the effectiveness and cost effectiveness of subcutaneous nerve stimulation in patients with predominant back pain due to failed back surgery syndrome (SubQStim study): study protocol for a multicenter randomized controlled trial. Trials 2013;14:189. doi: 10.1186/1745-6215-14-189. [DOI] [PMC free article] [PubMed] [Google Scholar]
- 18. Fairbank JC, Pynsent PB. The oswestry disability index. Spine (Phila Pa 1976) 2000;25:2940–2952; discussion 2952. https://libcontent.medtronic.com:2908/pubmed/11074683. [DOI] [PubMed] [Google Scholar]
- 19. Herdman M, Gudex C, Lloyd A et al. Development and preliminary testing of the new five‐level version of EQ‐5D (EQ‐5D‐5L). Qual Life Res 2011;20:1727–1736. doi: 10.1007/s11136-011-9903-x. [DOI] [PMC free article] [PubMed] [Google Scholar]
- 20. McHorney CA, Ware JE Jr., Raczek AE. The MOS 36‐item short‐form health survey (SF‐36): II. Psychometric and clinical tests of validity in measuring physical and mental health constructs. Med Care 1993;31:247–263. https://libcontent.medtronic.com:2908/pubmed/8450681. [DOI] [PubMed] [Google Scholar]
- 21. Farrar JT, Young JP Jr., LaMoreaux L, Werth JL, Poole RM. Clinical importance of changes in chronic pain intensity measured on an 11‐point numerical pain rating scale. Pain 2001;94:149–158. https://libcontent.medtronic.com:2908/pubmed/11690728. [DOI] [PubMed] [Google Scholar]
- 22. Kumar K, Taylor RS, Jacques L et al. The effects of spinal cord stimulation in neuropathic pain are sustained: a 24‐month follow‐up of the prospective randomized controlled multicenter trial of the effectiveness of spinal cord stimulation. Neurosurgery 2008;63:762–770, discussion 770. doi: 10.1227/01.NEU.0000325731.46702.D9. [DOI] [PubMed] [Google Scholar]
- 23. Cottingham B, Phillips PD, Davies GK, Getty CJ. The effect of subcutaneous nerve stimulation (SCNS) on pain associated with osteoarthritis of the hip. Pain 1985;22:243–248. https://libcontent.medtronic.com:2908/pubmed/3875827. [DOI] [PubMed] [Google Scholar]
- 24. Morch CD, Nguyen GP, Wacnik PW, Andersen OK. Mathematical model of nerve fiber activation during low back peripheral nerve field stimulation: analysis of electrode implant depth. Neuromodulation 2014;17:218–225; discussion 225. doi: 10.1111/ner.12163. [DOI] [PubMed] [Google Scholar]
- 25. Frahm KS, Hennings K, Vera‐Portocarrero L, Wacnik PW, Morch CD. Nerve fiber activation during peripheral nerve field stimulation: importance of electrode orientation and estimation of area of paresthesia. Neuromodulation 2016;19:311–318. doi: 10.1111/ner.12371. [DOI] [PubMed] [Google Scholar]
- 26. Vera‐Portocarrero LP, Cordero T, Billstrom T, Swearingen K, Wacnik PW, Johanek LM. Differential effects of subcutaneous electrical stimulation (SQS) and transcutaneous electrical nerve stimulation (TENS) in rodent models of chronic neuropathic or inflammatory pain. Neuromodulation 2013;16:328–335; discussion 335. doi: 10.1111/ner.12037. [DOI] [PubMed] [Google Scholar]
- 27. Vera‐Portocarrero LP, Cordero TL, Swearingen KM, Billstrom T, Johanek LM. Lead location plays a crucial role in the anti‐nociceptive effects of subcutaneous electrical stimulation in a rodent model of neuropathic pain 15th World Congress on Pain, IASP, Buenos Aires, Argentina, 2014. [Google Scholar]
- 28. Vera‐Portocarrero L, Cordero T, Billstrom T, Swearingen K, Wacnik P, Johanek L. Different lengths of stimulation produce different lengths of carry‐over effect in a rodent model of subcutaneous electrical stimulation. Neuromodulation 2013;16:e50. doi: 10.1111/ner.12104. [DOI] [PubMed] [Google Scholar]
- 29. Vera‐Portocarrero LP, Cordero TL, Billstrom T, Swearingen K, Johanek LM. Amplitude‐dependent effects of subcutaneous stimulation in a rodent model of neuropathic pain North American neuromodulation society meeting, Las Vegas, 2014. [Google Scholar]
Associated Data
This section collects any data citations, data availability statements, or supplementary materials included in this article.
Supplementary Materials
Table S1: Enrolment by Site