Abstract
Background
Adipose tissue (AT) can be classified into white and brown/beige subtypes. Chemical shift encoding‐based water–fat MRI‐techniques allowing simultaneous mapping of proton density fat fraction (PDFF) and T2* result in a lower PDFF and a shorter T2* in brown compared with white AT. However, AT T2* values vary widely in the literature and are primarily based on 6‐echo data. Increasing the number of echoes in a multiecho gradient‐echo acquisition is expected to increase the precision of AT T2* mapping.
Purpose
1) To mitigate issues of current T2*‐measurement techniques through experimental design, and 2) to investigate gluteal and supraclavicular AT T2* and PDFF and their relationship using a 20‐echo gradient‐echo acquisition.
Study Type
Prospective.
Subjects
Twenty‐one healthy subjects.
Field Strength/Sequence Assessment
First, a ground truth signal evolution was simulated from a single‐T2* water–fat model. Second, a time‐interleaved 20‐echo gradient‐echo sequence with monopolar gradients of neck and abdomen/pelvis at 3 T was performed in vivo to determine supraclavicular and gluteal PDFF and T2*. Complex‐based water–fat separation was performed for the first 6 echoes and the full 20 echoes. AT depots were segmented.
Statistical Tests
Mann‐Whitney test, Wilcoxon signed‐rank test and simple linear regression analysis.
Results
Both PDFF and T2* differed significantly between supraclavicular and gluteal AT with 6 and 20 echoes (PDFF: P < 0.0001 each, T2*: P = 0.03 / P < 0.0001 for 6/20 echoes). 6‐echo T2* demonstrated higher standard deviations and broader ranges than 20‐echo T2*. Regression analyses revealed a strong relationship between PDFF and T2* values per AT compartment (R2 = 0.63 supraclavicular, R2 = 0.86 gluteal, P < 0.0001 each).
Data Conclusion
The present findings suggest that an increase in the number of sampled echoes beyond 6 does not affect AT PDFF quantification, whereas AT T2* is considerably affected. Thus, a 20‐echo gradient‐echo acquisition enables a multiparametric analysis of both AT PDFF and T2* and may therefore improve MR‐based differentiation between white and brown fat.
Level of Evidence: 2
Technical Efficacy: Stage 2
J. Magn. Reson. Imaging 2019;50:424–434.
Keywords: magnetic resonance imaging, MRI, T2* mapping, PDFF mapping, brown fat, white fat, fat spectrum
BROWN ADIPOSE TISSUE (BAT) is capable of thermogenesis through dissipation of chemical energy as heat via uncoupling protein 1 (UCP‐1), which uncouples oxidative phosphorylation from adenosine triphosphate‐production.1 BAT differs from white adipose tissue (WAT) by having smaller adipocytes, an abundance of mitochondria, a centrally located nucleus, multiple small triglyceride droplets, and more intracellular water.2, 3 A richer vasculature in BAT causes a higher blood perfusion and oxygenation compared with WAT.4 In adults, BAT can be mostly found in the supraclavicular and cervical region.5 Of note, recent studies have brought forth evidence for two types of BAT in humans: "classical" BAT and "beige" or "brown‐in‐white/BRITE" fat.6, 7, 8, 9 BAT has gained interest in obesity research, as activation of BAT has been shown to increase energy expenditure, and an inverse correlation between body mass index (BMI) and the presence of metabolically active BAT has been repeatedly shown.5, 10, 11, 12, 13, 14 Based on these findings, several studies have investigated BAT recruitment and activation as a therapeutic approach for obesity, elevated triglyceride concentrations, and diabetes.15, 16, 17
In recent years, magnetic resonance imaging (MRI) chemical shift encoding‐based fat quantification techniques have gained attention as a novel noninvasive imaging method for detecting and characterizing BAT, being independent from metabolic activity, free of ionizing radiation, and without the need of intravenous contrast,18, 19, 20, 21 as compared with the commonly used [18F]‐2‐fluoro‐2‐deoxyglucose‐positron emission tomography (FDG‐PET) and computed tomography (CT). These MRI techniques can be used for differentiating the compositional difference between WAT and BAT based on simultaneous mapping of the proton density fat fraction (PDFF) and T2* relaxation time.22 Specifically, there have been multiple studies showing that PDFF is lower in the BAT‐containing supraclavicular region compared with WAT depots, presumably due to the lower lipid content and higher water content of BAT compared with WAT.23, 24, 25, 26 T2* relaxation times also have been reported to be shorter in supraclavicular fat compared with WAT, accounting for the increased microscopic magnetic field inhomogeneity due to the increased water content, the presence of mitochondria, and the different perfusion and oxygenation of the supraclavicular fat. However, the range of adipose tissue T2* values reported in the literature for either supraclavicular adipose tissue or WAT is relatively wide, varying over dozens of milliseconds, and is primarily based on 6‐echo data.18, 27, 28, 29
To estimate T2* and PDFF simultaneously, a complex‐based water–fat separation technique is typically performed on complex data from a multigradient‐echo sequence.30 This technique uses an a priori fixed fat spectrum model as additional input and is extensively and primarily studied in terms of the accuracy and precision in the PDFF estimate, as T2* is often treated as a nuisance parameter to account for the otherwise confounding effect of signal relaxation on the water–fat estimation. Echo times are mainly optimized for the estimation of PDFF, which is also shown to be very robust with respect to different a priori fat spectrum models.30, 31, 32 The quantitative T2* estimation has higher signal‐to‐noise ratio (SNR) requirements compared with PDFF. Increasing the number of echoes in a multiecho gradient echo acquisition with a constant echo time step is expected to at least enhance the precision of adipose tissue T2* mapping by increasing both the maximum echo time and the number of sampled echoes.
Thus, the purpose of this study was to mitigate T2*‐measurement errors through experimental design and to investigate in vivo the gluteal and supraclavicular adipose tissue PDFF and T2* relaxation times and their relationship using a 20‐multiecho gradient echo acquisition in comparison with a 6‐echo dataset.
Materials and Methods
The effect of the underlying fat spectrum on the chemical shift encoding‐based water–fat separation results was addressed in simulations and in vivo measurements for different numbers of sampled echoes by varying the number of fat peaks and their peak locations in a physiologically meaningful range.
Simulations
The structure of triglycerides can be characterized using different variables: the number of ‐CH = CH‐ double bonds per molecule (ndb), number of double bonds separated by a single CH2 (nmidb, number of methylene‐interrupted double bonds), and the fatty acid chain length (CL). With a fixed CL of 17.5, following the assumptions of Ref. 33, fat spectra were parametrized in ndb and nmidb and varied in the range [2.83–0.2, 2.83 + 0.2] for ndb and in the range [0.74–0.2, 0.74 + 0.2] for nmidb with either 6 or 10 fat peaks. A ground truth signal evolution was simulated from a single‐T2* water–fat model with the following parameters: fat fraction = 95%, CL = 17.5, ndb = 2.83, nmidb = 0.74, field map = 10 Hz, T2* = 45 msec, number of fat peaks = 10, with peak locations from Ref. 34 (see also Table 1), based on the fatty acid composition parameters previously reported in superficial subcutaneous fat.33 Signals with physiological variation of the fat spectrum were simulated without noise and sampled starting from TE1 = 1.22 msec with different numbers of echoes equally spaced by ΔTE = 1 msec. Parameter estimation for a complex‐based water–fat separation accounting for a single T2* determined the bias as the difference of the estimated T2* from the assumed input T2*.30 Based on the study by Pineda et al.,32 theoretical Cramér–Rao lower bounds (CRLB) for the variance of the T2* estimates were computed in order to analyze the noise performance.
Table 1.
Peak Locations of the Fat Spectra Used in Figure 1
| Parameter name | Peak name | Chemical shift [ppm] | Chemical shift [ppm] | Chemical shift [ppm] | Chemical shift [ppm] |
|---|---|---|---|---|---|
| A | Terminal Methyl | 0.9 | 0.9 | 0.75 | 0.9 |
| B | (Bulk) Methylene | 1.3 | 1.3 | 1.16 | 1.3 |
| C | beta‐Carboxyl | 1.59 | 1.6 | 1.47 | 0 |
| D | Allytic Methylene | 2.03 | 2.02 | 1.88 | 2.1 |
| E | alpha‐Carboxyl | 2.25 | 2.24 | 2.1 | 0 |
| F | Diacyllic Methylene | 2.77 | 2.75 | 2.61 | 2.75 |
| G | Glycerol Methylene | 4.1 | 4.2 | 4.06 | 4.2 |
| H | Glycerol Methylene | 4.3 | 0 | 0 | 0 |
| I | Glycerol Methine | 5.21 | 5.19 | 5.17 | 0 |
| J | Olefinic Methine | 5.31 | 5.29 | 0 | 5.3 |
| Reference | 46 | 34 | 47 | 34 | |
| Comment | Combined peaks GH | Combined peaks IJ and GH | Combined peaks IJ, GH, DE, BC |
In Vivo Measurements
Subjects
Subjects were recruited at the Institute for Nutritional Medicine, Klinikum rechts der Isar, Technical University of Munich, in a study initially designed to investigate the basal metabolic rate.35 The study protocol was approved by the ethical committee of the Faculty of Medicine of the Technical University of Munich, Germany. Written informed consent was obtained from all subjects prior to scanning. Exclusion criteria for MRI measurements were pregnancy and standard contraindications for MRI examinations. The study design as well as the results regarding associations between MR and clinical parameters have been previously described in detail.23, 35 For this analysis, we focused on a subset of subjects where a 20‐multiecho gradient echo acquisition of the supraclavicular and pelvic region had been performed.
MRI Measurements
Subjects underwent an MRI of the neck and the abdomen/pelvis on a 3 T Ingenia scanner (Philips Healthcare, Best, Netherlands) using a head‐neck coil and a combination of anterior and posterior coil arrays, respectively. Scans were performed in an air‐conditioning‐controlled scanner room (21°C) after some acclimatization time.
Supraclavicular and Pelvic PDFF Mapping
In order to determine the supraclavicular PDFF, MRI localizer sequences were acquired to identify the location of supraclavicular fat pockets. Based on the localizer sequences, a T1‐weighted coronal turbo‐spin‐echo sequence was acquired for detailed anatomic imaging of the neck (repetition time [TR] = 605 msec, echo time [TE] = 12 msec, flip angle = 90°, bandwidth = 237 Hz/pixel, acquisition matrix size = 688 × 554 × 20, field of view [FOV] = 380 × 280 × 100 mm, reconstructed voxel size = 0.36 × 0.36 × 5.0 mm3, scan time 3 min 36 sec). For determination of supraclavicular and gluteal PDFF, a time‐interleaved multigradient echo sequence with monopolar gradients was used36: two interleaves, 10 echoes per interleaf, TR = 24 msec, TE1 = 1.5 msec, ΔTE = 1.0 msec, flip angle = 5°, bandwidth = 961.5 Hz/pixel, 200 × 148 × 70 acquisition matrix size, FOV = 400 × 300 × 140 mm3, 2.0 mm isotropic voxel size, SENSE with R = 2.5 and scan time of 3 min 8 sec. A small flip angle was used to minimize T1 bias effects.37, 38 PDFF maps were generated offline using a complex‐based water–fat signal model, accounting for known confounding factors including the presence of multiple fat peaks based on the previously determined subcutaneous fat spectrum33 and a single T2* decay.30 The separation was performed offline using a generalized formulation for parameter estimation in MR signals of multiple chemical species,39 based on routines written in MatLab (MathWorks, Natick, MA). The water–fat separation was performed assuming fat spectrum models slightly varying in ndb (ndb1 = 2.83, ndb2 = 2.74) once on the first 6 echoes and once on the full 20 echoes.
Imaging Data Analysis
PDFF and T2* Map Segmentation
For the segmentation of the supraclavicular fat depot, an in‐house semiautomatic segmentation tool implemented in MatLab was used, as previously described in detail.23 Average PDFF‐values (in %) as well as T2* times of each resulting volume of interest were recorded. A similar procedure was performed in the gluteal fat pad posterior of the iliac bone bilaterally, delineating the subcutaneous fat deep to the Scarpa's fascial layer, excluding gluteal muscles, cutis, and vessels. A schematic example of the segmentations is shown in Supporting Fig. S1. Segmentations were performed by a radiologist with 6 years of experience in the field of whole‐body imaging. To assure reproducibility, segmentations were performed independently by a second reader, a medical student trained in supraclavicular and gluteal adipose tissue depot segmentations, in ~20% of the subjects (n = 4), and the interreader agreement for the resulting T2* and PDFF values was calculated. T2* maps were not filtered to lie in a given range for the entire analysis.
Statistical Analysis
The Shapiro–Wilk test indicated that the vast majority of the values were not normally distributed. Data are expressed as mean; median (standard deviation [SD]; range), unless stated otherwise. Interreader agreement of the PDFF and T2* values resulting from the segmentations was evaluated using the intraclass correlation coefficient (ICC).40 Agreement was classified as poor (ICC = 0.00–0.20), fair to good (ICC = 0.40–0.75), or excellent (ICC > 0.75).41 Mann–Whitney test was used for comparison of PDFF and T2* values between the two adipose tissue compartments. Wilcoxon signed‐rank test was used to compare the 6‐echo vs. 20‐echo data regarding PDFF and T2* in the supraclavicular and gluteal adipose tissue. Simple linear regression analysis was used to study the relationship between T2* and PDFF per adipose tissue compartment. T2* values used in the regression analysis between PDFF and T2* were based on T2* maps filtered to lie in the range between 0 msec and 100 msec (by setting T2* values higher than 100 msec to 100 msec and by setting T2* values lower than 0 msec to 0 msec) to prevent outliers from affecting the investigated relationship between PDFF and T2*. Statistical analysis was performed using MedCalc Statistical Software (v. 16.4.3; MedCalc Software, Ostend, Belgium; https://www.medcalc.org; 2016). A two‐sided P‐value <0.05 was considered statistically significant.
Results
Simulations
As shown in Fig. 1, signal magnitude evolution curves of physiologically varying underlying fat spectra with different peak locations (Table 1) and amplitudes differed noticeably at certain sampled echoes, especially around 6 sampled echoes. This indicates difficulties in T2* estimation when assuming an inaccurate underlying fat spectrum. Figure 2 shows R2*/T2* bias maps for the simulated ndb and nmidb ranges when using only the first 6 echoes. The worst‐case bias of the bias maps when repeated for 6–20 echoes is plotted in Fig. 3. While the bias was very high with 6 echoes, increasing the number of echoes strongly decreased the worst‐case bias, ie, increased the accuracy. The observed increased accuracy for 20‐echo estimations was also accompanied by an increase in precision, which is depicted as the decreasing noise variance or the increasing number of signals averaged (NSA) over the number of echoes in Fig. 3 resulting from the CRLB analysis.
Figure 1.
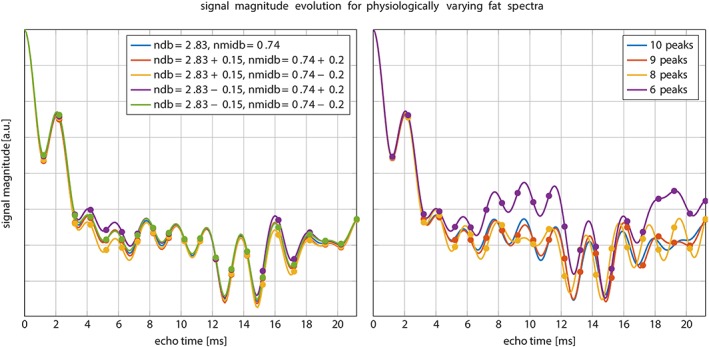
Simulated signal magnitude evolution for different fat spectra. Left: variations of the peak amplitudes parameterized by ndb and nmidb. Especially around the first 6 sampled echoes the magnitude differs noticeably. Right: variation of number of fat peaks for fixed ndb = 2.83, nmidb = 0.74. ndb: number of double bonds; nmidb: number of methylene‐interrupted double bounds.
Figure 2.
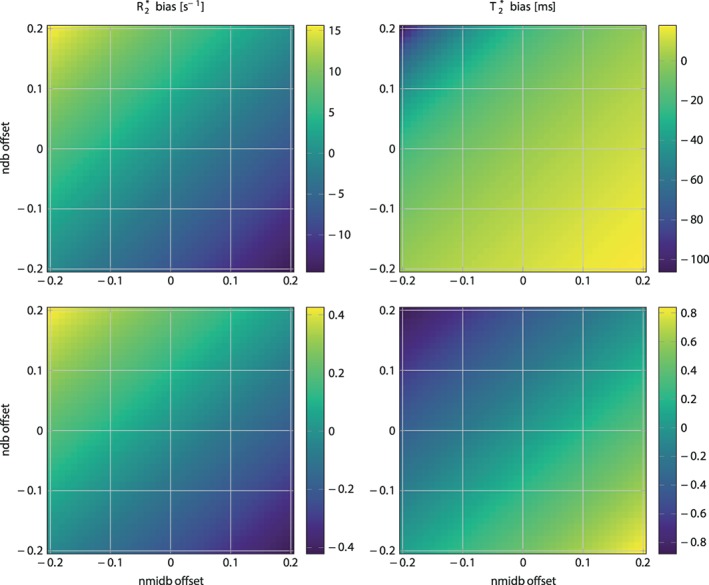
R2* (left) / T2* (right) bias in simulated 6 echo (top) and 20 echo (bottom) data depending on variations of ndb and nmidb offset around ground values of ndb = 2.83, nmidb = 0.74 for a fixed chain length (CL) = 17.5. Note how the bias range reduces drastically when comparing the top to bottom row. ndb: number of double bonds; nmidb: number of methylene‐interrupted double bounds.
Figure 3.
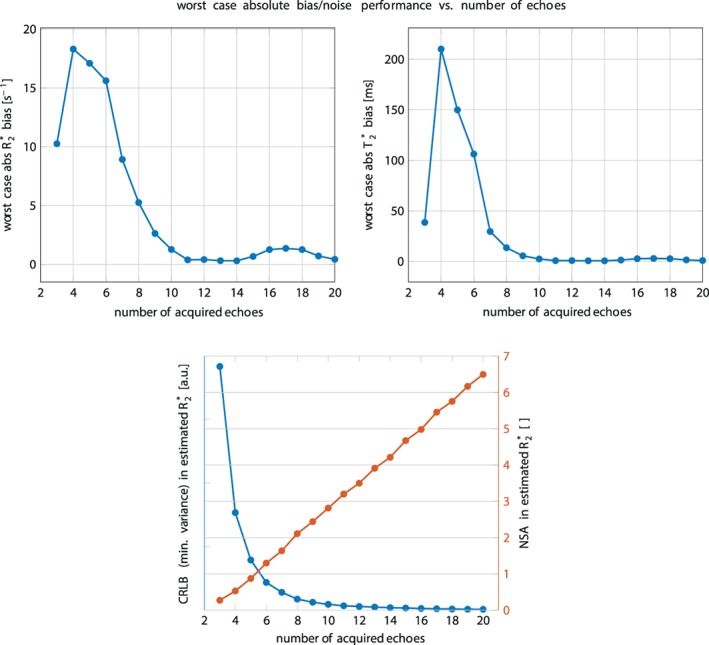
Top: Worst‐case absolute R2* (left) / T2* (right) bias vs. number of sampled echo times. While with typically acquired 6 echoes the bias is still very high, a higher number of echoes increases the accuracy. Bottom: Noise performance for the R2*‐estimate vs. number of sampled echo times. On the left blue axis the Cramér–Rao lower bound (CRLB) of the general variance is depicted. On the right red axis the number of signal averages computed by NSA = number of echoes × CRLBmin/CRLB is plotted.
In Vivo Measurements
In total, 21 subjects (14 women and 7 men) were included in the analysis. BMI ranged from 17.2–43.1 kg/m2. Median age was 35.2 years (range, 22.5–63.1 years). Interreader agreement of the PDFF and T2* values resulting from the segmentations was excellent, with an ICC of 0.85 (confidence interval 0.71–0.92).
First, the dependence of the gluteal fat T2* values on the employed fat spectrum was investigated. Figure 4 shows T2*‐maps from an example gluteal dataset reconstructed with a different number of echoes (6 versus 20) and two different fat spectra only slightly varying in ndb (ndb1 = 2.83, ndb2 = 2.74). The quality of T2*‐maps was highly variable when only 6 echoes were used and noticeably more homogeneous for 20 echoes. T2*‐maps showed the highest spatial homogeneity in the 20‐echo data independent of the employed fat spectrum (see Fig. 4). Estimated T2* voxel values appeared dependent on the employed fat spectrum when only 6 echoes were used, while they were not affected by the fat spectrum when all 20 echoes were used. With 6 echoes, mean T2* ± SD was –47.5 ± 550.9 msec for ndb1 = 2.83 and 49.6 ± 82.7 msec for ndb2 = 2.84 in gluteal adipose tissue, resulting in a mean paired difference of 97.03 msec. Mean gluteal adipose tissue T2* with 20 echoes was 37.4 ± 8.3 msec for ndb1 = 2.83 and 37.0 ± 7.8 msec for ndb2 = 2.74, resulting in a mean paired difference of –0.12 msec. Negative voxel values of T2* in the 6‐echo data, resulting in the negative mean T2* in gluteal adipose tissue, could be found in the adipose tissue, but not in the nonadipose skeletal muscle, as the high noise and the large extent of artifacts (see Figs. 4 and 5) was confined to adipose tissue.
Figure 4.
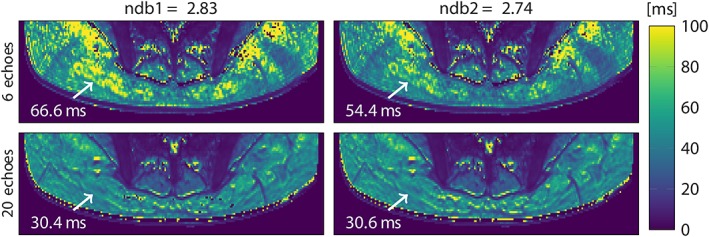
T2* maps in the gluteal region of a representative healthy subject, reconstructed from 6 (top) and 20 echoes (bottom) with 9‐peak fat spectra of only slightly varying peak amplitudes (ndb1 and ndb2). Arrow annotations show the estimated T2* voxel values. ndb: number of double bonds.
Figure 5.
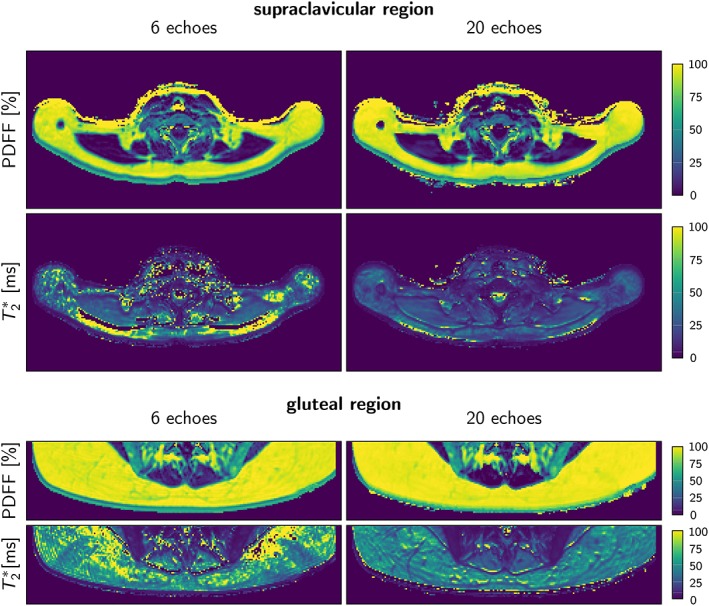
Representative PDFF and T2* maps using 6 echoes and 20 echoes in the supraclavicular and gluteal regions of one subject. Note the higher noise and the extent of artifacts in the T2*‐map with 6 compared with 20 echoes. PDFF: proton density fat fraction.
Next, the dependence of the supraclavicular and gluteal fat PDFF and T2* values on the number of echoes was investigated. Examples of in vivo T2* and PDFF maps are shown in Fig. 5, and Table 2 summarizes the most important group statistics.
Table 2.
Mean and Standard Deviation Values
| 6‐echo | 20‐echo |
P‐value (6‐ vs. 20‐echo) |
|
|---|---|---|---|
| PDFF | |||
| Supraclavicular fat PDFF (%) | 79.3 ± 6.0 (64.8–87.3) | 82.5 ± 5.3 (68.8–89.4) | <0.0001 |
| Gluteal fat PDFF (%) | 90.8 ± 4.5 (81.4–96.2) | 93.7 ± 3.4 (86.4–97.4) | <0.0001 |
| P‐value (supraclavicular vs. gluteal) | <0.0001 | <0.0001 | |
| T2* | |||
| Supraclavicular fat T2* (msec) | 14.9 ± 360.2 (–1908.3–1118.9) | 22.2 ± 19.5 (–47.8–90.9) | 0.16 |
| Gluteal fat T2* (msec) | –47.5 ± 550.9 (–3134.9–302.7) | 37.4 ± 8.3 (23.8–61.6) | 0.03 |
| P‐value (supraclavicular vs. gluteal) | 0.03 | <0.0001 |
Range in parentheses for the supraclavicular and gluteal fat PDFF and T2* using the 6‐echo and the 20‐echo datasets. PDFF: proton density fat fraction.
When employing 6 echoes, supraclavicular adipose tissue showed a mean PDFF of 79.3% and a median of 79.2% (SD, 6.0%; range, 64.8%–87.3%), while gluteal adipose tissue PDFF showed a mean of 90.8% and a median of 92.3% (SD, 4.5%; range, 81.4%–96.2%). The 20‐echo‐data in the supraclavicular adipose tissue showed a mean PDFF of 82.5% and a median of 82.3% (SD 5.3%; range, 68.8%–89.4%), while gluteal PDFF resulted in a mean of 93.7% and a median of 95.1% (SD, 3.4%; range, 86.4%–97.4%) (Fig. 6 and Table 2).
Figure 6.
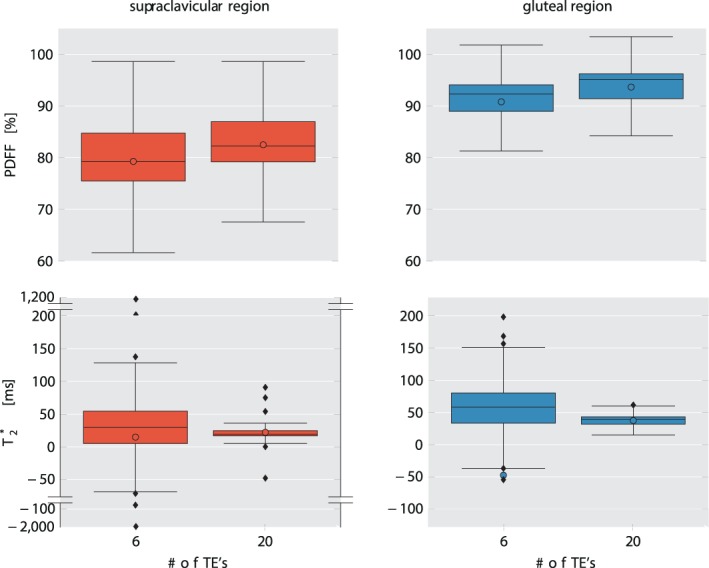
Comparison of PDFF (top row) and T2* (bottom row) values in supraclavicular fat (left column) and gluteal fat (right column) from 6‐echo and 20‐echo‐data. Mean values are shown as colored circles, median values are represented by the vertical line within the boxes. Outliers are shown using a "broken" y‐axis for supraclavicular T2* values. Note the increased range of the T2* values in both supraclavicular and gluteal fat when using the 6‐echo data. PDFF: proton density fat fraction.
The 6‐echo analysis resulted in a mean supraclavicular T2* of 14.9 msec; median 29.6 msec (SD, 360.2 msec; range, –1908.3 msec –1118.9 msec), while in gluteal adipose tissue, mean T2* was –47.5 msec, median 58.3 msec (SD 550.9 msec; range –3134.9 msec –302.7 msec). With 20 echoes, T2* values showed smaller standard deviation and narrower ranges with mean supraclavicular T2* of 22.2 msec; median 19.4 msec (SD, 19.5 msec; range, –47.8 msec –90.9 msec) and a mean gluteal T2* of 37.4 msec; median 39.0 msec (SD, 8.3 msec; 23.8 msec –61.6 msec) (Fig. 6). Therefore, the T2* values showed overall a broad range with 6 echoes and a narrower range with 20 echoes, and the SD for T2* were markedly higher with 6 echoes compared with 20 echoes.
The Mann–Whitney test indicated a significant difference between supraclavicular and gluteal PDFF when employing both 6 echoes and 20 echoes (P < 0.0001 each, Table 2). Comparison of T2* values also revealed strong differences between supraclavicular and gluteal adipose tissue for both 6‐ and 20‐echo data, with P = 0.03 for 6 echoes and P < 0.0001 for 20 echoes (Fig. 6, Table 2).
When comparing the 6‐echo PDFF to the 20‐echo PDFF, a significant difference became visible with higher median 20‐echo‐PDFF in both supraclavicular and gluteal adipose tissue compared with the 6‐echo‐PDFF (P < 0.0001) (Fig. 6, Table 2). When comparing the 6‐echo T2* to the 20‐echo T2*, a significant difference was only visible for the gluteal T2*, with a shorter T2* in the 20‐echo data compared with the 6‐echo data (P = 0.03). (Table 2 and Fig. 6).
The relationship between PDFF and T2* was investigated last using the filtered T2* values. Simple linear regression analyses resulted in a strong relationship between T2* and PDFF values in both supraclavicular (R2 = 0.633, P < 0.0001) and gluteal (R2 = 0.862, P < 0.0001) adipose tissue for the 20‐echo‐data (Fig. 7). The slope was stronger in the gluteal fat than in the supraclavicular fat (2.01 vs. 0.58).
Figure 7.
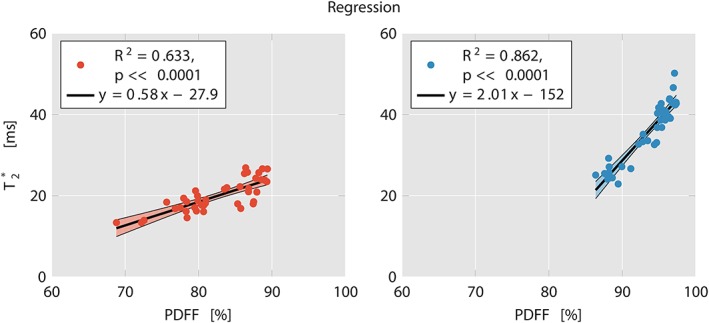
Linear regression plots of T2* and PDFF in supraclavicular (left) and gluteal fat (right) with 20 echoes. R2 was 0.633 (P < 0.0001) for supraclavicular fat and 0.862 (P < 0.0001) for gluteal fat. Notice the clustering of supraclavicular vs. gluteal data points. Also note the stronger slope in gluteal fat compared with supraclavicular fat. PDFF: proton density fat fraction.
Discussion
The present analysis shows a markedly decreased range and standard deviation in T2* relaxation times in supraclavicular and gluteal adipose tissue using a 20‐multiecho gradient echo acquisition in comparison to a 6‐echo dataset. Regression analyses showed a strong relationship between PDFF and T2* in both supraclavicular and gluteal fat with 20 echoes. Both PDFF and T2* differed significantly between supraclavicular and gluteal fat with both 6 and 20 echoes. In addition, supraclavicular and gluteal PDFF as well as gluteal T2* differed significantly between the 20‐ and the 6‐echo‐dataset.
With the discovery of active BAT in adults, methods to detect BAT started to be intensively investigated in order to learn more about the presence and function of BAT, as studies have suggested a clinically relevant role of BAT in metabolic health.12, 14 Identification and characterization of BAT with MRI are mostly based on fat‐signal fractions and T2* relaxation times.25, 27 However, there is a relatively wide range of adipose tissue T2* values reported in the literature for both supraclavicular and white adipose tissue, and published data are primarily based on six echoes.18, 27, 28 An increase in the number of echoes in a multiecho gradient echo acquisition is expected to improve the precision in T2* estimation and to reduce the noise in T2* mapping. In addition, the effect of the underlying fat spectrum on the estimation of T2* using a chemical shift encoding‐based water–fat separation is still unknown.
It is a common practice in most previous works performing a T2* correction in water–fat separation to filter the T2* values so that they lie within a predefined range.42 The present work did not perform any filtering or clipping of the T2* values when comparing T2* values from 6‐echo and 20‐echo datasets to especially show the challenges in estimating T2* values in adipose tissue. That is the reason why reported T2* values were negative in part of the reported 6‐echo data. It is worth noting that negative or very large T2* values were observed when using the 6‐echo data in the adipose tissue regions, but not within the skeletal muscle. T2* values from the 20‐echo acquisition were only filtered in the regression analysis between PDFF and T2*.
The present findings relate the effects of different sources of errors on T2* estimation of adipose tissue. First, simulations and in vivo results clearly showed that, in contrast to PDFF, the T2* estimates in adipose tissue obtained from a standard complex‐based water–fat separation technique heavily depend on the assumed a priori fat spectrum and a mismatch leads to high inaccuracies of up to a bias of ~100 msec. Second, simulations showed an enhanced precision of T2* with the number of echoes of the multiecho gradient echo acquisition. Third, motion artifacts would be in general expected to result in different spatial patterns across echoes and therefore to affect less the T2* estimation as the number of sampled echoes increases.
The results of the present in vivo analysis show a significantly broader range of T2* relaxation times in the 6‐echo dataset compared with the 20‐echo dataset. This result is in line with the literature, also reporting on a wide variety of T2* values.18, 27, 29 There are multiple potential effects explaining the large spread of T2* values when using 6 echoes, including the effect of the assumed underlying fat spectrum on the estimation of T2*, the poor noise performance, and the effect of motion artifacts. In the 20‐echo dataset, the T2* estimation presumably became independent of the assumed underlying fat spectrum, had improved precision in T2* estimation, and was less affected by motion artifacts. However, the number of sampled echoes did not affect the variability of the PDFF values. This leads to the assumption that PDFF is a robust biomarker for BAT, which can already be determined based on a relatively small number of sampled echoes (6), while T2* values are more sensitive to the number of sampled echoes.
The significant difference between the PDFF in different fat regions for both 6‐ and 20‐echo data detected in the present analysis is in accordance with results from other studies where the MRI fat fraction differed between supraclavicular and subcutaneous adipose tissue, presumably due to differences in adipose tissue composition and the presence of BAT in the supraclavicular, but not in the subcutaneous adipose tissue.23, 24, 26 The assumption of a difference in T2* relaxation times in BAT compared with WAT is based on the knowledge about differences in tissue composition, with BAT having more mitochondria and thus a higher iron content as well as denser vasculature. The finding that T2* relaxation times were significantly different between fat depots both in both the 20‐echo and the 6‐echo‐dataset despite the broad range and the high standard deviation of the 6‐echo data compared with the 20‐echo data is presumably based on the use of ranks for the comparison analyses, leading to a lower sensitivity regarding the wide variability of values.
The analysis presented here also resulted in an association between PDFF and T2* relaxation times in both gluteal and supraclavicular fat. The dependence of the T2* relaxation time on PDFF in tissues containing lipid droplets has been previously related in part to the magnetic susceptibility difference between water and fat.43 Such a contribution of the magnetic susceptibility difference between water and fat on tissue T2* would be expected to be higher in gluteal fat and lower in supraclavicular fat, where more other sources of T2* shortening are present (eg, mitochondria, vasculature). A stronger contribution of the magnetic susceptibility difference between water and fat on tissue T2* in gluteal fat compared with supraclavicular fat might also in part explain the higher R2 between PDFF and T2* relaxation time in the gluteal fat as compared with the supraclavicular fat, as well as the stronger slope of the dependence of T2* relaxation time on PDFF in the gluteal fat than in the supraclavicular fat.
The focus of the present analysis lies entirely on static T2* measurements of supraclavicular fat. The shown decreased range and standard deviation in supraclavicular T2* relaxation times would be necessary in studies aiming at tracking the activation status of BAT using T2* measurements of supraclavicular adipose tissue based on the blood oxygenation level‐dependent (BOLD) effect.27, 44, 45
The present study has some limitations. First, histology was not used as the gold standard diagnostic tool for identifying BAT. Without adipose tissue biopsy samples, it is not possible to ultimately substantiate the presence of BAT as well as the cellular characteristics of the depots under investigation. Second, the present analysis used a water–fat signal model with a single T2* decay, assuming a common T2* relaxation time for water and all fat peaks. Although a difference in T2* between water and fat cannot be excluded, a dual T2* decay water–fat signal model was not adopted because of the poor noise performance of a dual T2* decay water–fat signal model, especially for the present regime of fat fractions typically above 70%. Third, the present work did not perform any formal analysis on the minimal number of echo time samples needed to robustly measure adipose tissue T2*. The employed number of 20 echoes was chosen to provide a reasonable balance for the current experimental settings (echo time step and SNR) between achieving homogeneous adipose tissue T2* mapping and not extensively increasing the total scan time. However, the selection of the number of echo times for robust adipose tissue T2* mapping would in general depend on the employed echo time step and the underlying SNR. Fourth, when performing PDFF and T2* measurements with MRI, partial volume effects have to be taken into account, as these parameters cannot differentiate between intracellular water content and nonlipid tissue portions (eg, from vessels) within a voxel. The isotropic voxel size in our study measured 2 mm in each dimension; thus, partial volume effects from very small vessels, nerves, and adjacent muscles cannot be excluded.
In conclusion, the present findings suggest that adipose tissue PDFF quantification is not affected by the number of sampled echoes, whereas adipose tissue T2* is more significantly affected by the number of sampled echoes when increasing the number of sampled echoes beyond 6. A 20‐echo multiecho gradient‐echo acquisition thus enables a multiparametric analysis of both adipose tissue PDFF and T2* and may improve the MR‐based differentiation between white and brown fat.
Conflict of Interest
Holger Eggers is an employee of Philips Healthcare. Dimitrios Karampinos receives grant support from Philips Healthcare.
Supporting information
Figure S1 Axial PDFF maps of the supraclavicular (upper image) and the gluteal adipose tissue (lower image). Red labels delineate the fat depots segmented. Segmentations resulted in one volume of interest per fat depot. PDFF: proton density fat fraction
Acknowledgment
The authors thank all persons participating in the study.
Contract grant sponsor: European Research Council; Contract grant number: 677661, ProFatMRI; Contract grant sponsor: German Research Foundation; Contract grant number: DFG‐SFB824/A9; Contract grant sponsor: Philips Healthcare; Contract grant sponsor: Else Kroener‐Fresenius‐Foundation, Bad Homburg, Germany; Contract grant sponsor: Helmholtz cross‐program topic "Metabolic Dysfunction." This work reflects only the authors' views and the EU is not responsible for any use that may be made of the information it contains.
References
- 1. Saito M, Okamatsu‐Ogura Y, Matsushita M, et al. High incidence of metabolically active brown adipose tissue in healthy adult humans: Effects of cold exposure and adiposity. Diabetes 2009;58:1526–1531. [DOI] [PMC free article] [PubMed] [Google Scholar]
- 2. Cinti S. The role of brown adipose tissue in human obesity. Nutr Metab Cardiovasc Dis 2006;16:569–574. [DOI] [PubMed] [Google Scholar]
- 3. Hu HH, Nayak KS. Change in the proton T(1) of fat and water in mixture. Magn Reson Med 2010;63:494–501. [DOI] [PMC free article] [PubMed] [Google Scholar]
- 4. Muzik O, Mangner TJ, Leonard WR, Kumar A, Janisse J, Granneman JG. 15O PET measurement of blood flow and oxygen consumption in cold‐activated human brown fat. J Nucl Med 2013;54:523–531. [DOI] [PMC free article] [PubMed] [Google Scholar]
- 5. Enerback S. Human brown adipose tissue. Cell Metab 2010;11:248–252. [DOI] [PubMed] [Google Scholar]
- 6. Harms M, Seale P. Brown and beige fat: Development, function and therapeutic potential. Nat Med 2013;19:1252–1263. [DOI] [PubMed] [Google Scholar]
- 7. Lidell ME, Betz MJ, Dahlqvist Leinhard O, et al. Evidence for two types of brown adipose tissue in humans. Nat Med 2013;19:631–634. [DOI] [PubMed] [Google Scholar]
- 8. Himms‐Hagen J, Melnyk A, Zingaretti MC, Ceresi E, Barbatelli G, Cinti S. Multilocular fat cells in WAT of CL‐316243‐treated rats derive directly from white adipocytes. Am J Physiol Cell Physiol 2000;279:C670–681. [DOI] [PubMed] [Google Scholar]
- 9. Wu J, Bostrom P, Sparks LM, et al. Beige adipocytes are a distinct type of thermogenic fat cell in mouse and human. Cell 2012;150:366–376. [DOI] [PMC free article] [PubMed] [Google Scholar]
- 10. Cypess AM, Lehman S, Williams G, et al. Identification and importance of brown adipose tissue in adult humans. N Engl J Med 2009;360:1509–1517. [DOI] [PMC free article] [PubMed] [Google Scholar]
- 11. van Marken Lichtenbelt WD, Vanhommerig JW, Smulders NM, et al. Cold‐activated brown adipose tissue in healthy men. N Engl J Med 2009;360:1500–1508. [DOI] [PubMed] [Google Scholar]
- 12. Matsushita M, Yoneshiro T, Aita S, Kameya T, Sugie H, Saito M. Impact of brown adipose tissue on body fatness and glucose metabolism in healthy humans. Int J Obes 2014;38:812–817. [DOI] [PubMed] [Google Scholar]
- 13. Yoneshiro T, Aita S, Matsushita M, et al. Brown adipose tissue, whole‐body energy expenditure, and thermogenesis in healthy adult men. Obesity 2011;19:13–16. [DOI] [PubMed] [Google Scholar]
- 14. Bartelt A, Heeren J. Adipose tissue browning and metabolic health. Nat Rev Endocrinol 2014;10:24–36. [DOI] [PubMed] [Google Scholar]
- 15. Gunawardana SC, Piston DW. Insulin‐independent reversal of type 1 diabetes in nonobese diabetic mice with brown adipose tissue transplant. Am J Physiol Endocrinol Metab 2015;308:E1043–1055. [DOI] [PMC free article] [PubMed] [Google Scholar]
- 16. Bartelt A, Bruns OT, Reimer R, et al. Brown adipose tissue activity controls triglyceride clearance. Nat Med 2011;17:200–205. [DOI] [PubMed] [Google Scholar]
- 17. Yoneshiro T, Saito M. Activation and recruitment of brown adipose tissue as anti‐obesity regimens in humans. Ann Med 2015;47:133–141. [DOI] [PubMed] [Google Scholar]
- 18. Hu HH, Yin L, Aggabao PC, Perkins TG, Chia JM, Gilsanz V. Comparison of brown and white adipose tissues in infants and children with chemical‐shift‐encoded water‐fat MRI. J Magn Reson Imaging 2013;38:885–896. [DOI] [PMC free article] [PubMed] [Google Scholar]
- 19. Rasmussen JM, Entringer S, Nguyen A, et al. Brown adipose tissue quantification in human neonates using water‐fat separated MRI. PLoS One 2013;8:e77907. [DOI] [PMC free article] [PubMed] [Google Scholar]
- 20. Karampinos DC, Ruschke S, Dieckmeyer M, et al. Quantitative MRI and spectroscopy of bone marrow. J Magn Reson Imaging 2018;47:332–353. [DOI] [PMC free article] [PubMed] [Google Scholar]
- 21. Hu HH. Magnetic resonance of brown adipose tissue: A review of current techniques. Crit Rev Biomed Eng 2015;43:161–181. [DOI] [PubMed] [Google Scholar]
- 22. Hu HH, Kan HE. Quantitative proton MR techniques for measuring fat. NMR Biomed 2013;26:1609–1629. [DOI] [PMC free article] [PubMed] [Google Scholar]
- 23. Franz D, Weidlich D, Freitag F, et al. Association of proton density fat fraction in adipose tissue with imaging‐based and anthropometric obesity markers in adults. Int J Obes 2018;42:175–182. [DOI] [PMC free article] [PubMed] [Google Scholar]
- 24. Franssens BT, Hoogduin H, Leiner T, van der Graaf Y, Visseren FLJ. Relation between brown adipose tissue and measures of obesity and metabolic dysfunction in patients with cardiovascular disease. J Magn Reson Imaging 2017;46:497–504. [DOI] [PubMed] [Google Scholar]
- 25. Hu HH, Perkins TG, Chia JM, Gilsanz V. Characterization of human brown adipose tissue by chemical‐shift water‐fat MRI. AJR Am J Roentgenol 2013;200:177–183. [DOI] [PMC free article] [PubMed] [Google Scholar]
- 26. Jones TA, Wayte SC, Reddy NL, et al. Identification of an optimal threshold for detecting human brown adipose tissue using receiver operating characteristic analysis of IDEAL MRI fat fraction maps. Magn Reson Imaging 2018;51:61–68. [DOI] [PubMed] [Google Scholar]
- 27. Gifford A, Towse TF, Walker RC, Avison MJ, Welch EB. Characterizing active and inactive brown adipose tissue in adult humans using PET‐CT and MR imaging. Am J Physiol Endocrinol Metab 2016;311:E95–E104. [DOI] [PMC free article] [PubMed] [Google Scholar]
- 28. McCallister A, Zhang L, Burant A, Katz L, Branca RT. A pilot study on the correlation between fat fraction values and glucose uptake values in supraclavicular fat by simultaneous PET/MRI. Magn Reson Med 2017;78:1922–1932. [DOI] [PMC free article] [PubMed] [Google Scholar]
- 29. Hui SCN, Ko JKL, Zhang T, et al. Quantification of brown and white adipose tissue based on Gaussian mixture model using water‐fat and T2* MRI in adolescents. J Magn Reson Imaging 2017;46:758–768. [DOI] [PubMed] [Google Scholar]
- 30. Yu H, Shimakawa A, McKenzie CA, Brodsky E, Brittain JH, Reeder SB. Multiecho water‐fat separation and simultaneous R2* estimation with multifrequency fat spectrum modeling. Magn Reson Med 2008;60:1122–1134. [DOI] [PMC free article] [PubMed] [Google Scholar]
- 31. Wang X, Hernando D, Reeder SB. Sensitivity of chemical shift‐encoded fat quantification to calibration of fat MR spectrum. Magn Reson Med 2016;75:845–851. [DOI] [PMC free article] [PubMed] [Google Scholar]
- 32. Pineda AR, Reeder SB, Wen Z, Pelc NJ. Cramer‐Rao bounds for three‐point decomposition of water and fat. Magn Reson Med 2005;54:625–635. [DOI] [PubMed] [Google Scholar]
- 33. Hamilton G, Schlein AN, Middleton MS, et al. In vivo triglyceride composition of abdominal adipose tissue measured by (1) H MRS at 3T. J Magn Reson Imaging 2017;45:1455–1463. [DOI] [PMC free article] [PubMed] [Google Scholar]
- 34. Hamilton G, Yokoo T, Bydder M, et al. In vivo characterization of the liver fat (1)H MR spectrum. NMR Biomed 2011;24:784–790. [DOI] [PMC free article] [PubMed] [Google Scholar]
- 35. Drabsch T, Holzapfel C, Stecher L, Petzold J, Skurk T, Hauner H. Associations between C‐reactive protein, insulin sensitivity, and resting metabolic rate in adults: A mediator analysis. Front Endocrinol 2018;9:556. [DOI] [PMC free article] [PubMed] [Google Scholar]
- 36. Ruschke S, Eggers H, Kooijman H, et al. Correction of phase errors in quantitative water‐fat imaging using a monopolar time‐interleaved multi‐echo gradient echo sequence. Magn Reson Med 2017;78:984–996. [DOI] [PubMed] [Google Scholar]
- 37. Karampinos DC, Yu H, Shimakawa A, Link TM, Majumdar S. T (1)‐corrected fat quantification using chemical shift‐based water/fat separation: Application to skeletal muscle. Magn Reson Med 2011;66:1312–1326. [DOI] [PMC free article] [PubMed] [Google Scholar]
- 38. Liu CY, McKenzie CA, Yu H, Brittain JH, Reeder SB. Fat quantification with IDEAL gradient echo imaging: Correction of bias from T(1) and noise. Magn Reson Med 2007;58:354–364. [DOI] [PubMed] [Google Scholar]
- 39. Diefenbach MN, Ruschke S, Karampinos DC. A generalized formulation for parameter estimation in MR signals of multiple chemical species In: Proc 25th Annual Meeting ISMRM, Honolulu; 2017. p 5181. [Google Scholar]
- 40. Shrout PE, Fleiss JL. Intraclass correlations: Uses in assessing rater reliability. Psychol Bull 1979;86:420–428. [DOI] [PubMed] [Google Scholar]
- 41. Fleiss JL. Reliability of measurement. The design and analysis of clinical experiments. Wiley Classics Library ed. New York: Wiley; 1999. p 1–32. [Google Scholar]
- 42. Chebrolu VV, Hines CD, Yu H, et al. Independent estimation of T*2 for water and fat for improved accuracy of fat quantification. Magn Reson Med 2010;63:849–857. [DOI] [PMC free article] [PubMed] [Google Scholar]
- 43. Bydder M, Hamilton G, de Rochefort L, et al. Sources of systematic error in proton density fat fraction (PDFF) quantification in the liver evaluated from magnitude images with different numbers of echoes. NMR Biomed 2018;31(1). [DOI] [PMC free article] [PubMed] [Google Scholar]
- 44. Chen YC, Cypess AM, Chen YC, et al. Measurement of human brown adipose tissue volume and activity using anatomic MR imaging and functional MR imaging. J Nucl Med 2013;54:1584–1587. [DOI] [PMC free article] [PubMed] [Google Scholar]
- 45. van Rooijen BD, van der Lans AA, Brans B, et al. Imaging cold‐activated brown adipose tissue using dynamic T2*‐weighted magnetic resonance imaging and 2‐deoxy‐2‐[18F]fluoro‐D‐glucose positron emission tomography. Invest Radiol 2013;48:708–714. [DOI] [PubMed] [Google Scholar]
- 46. Berglund J, Ahlstrom H, Kullberg J. Model‐based mapping of fat unsaturation and chain length by chemical shift imaging—phantom validation and in vivo feasibility. Magn Reson Med 2012;68:1815–1827. [DOI] [PubMed] [Google Scholar]
- 47. Peterson P, Mansson S. Simultaneous quantification of fat content and fatty acid composition using MR imaging. Magn Reson Med 2013;69:688–697. [DOI] [PubMed] [Google Scholar]
Associated Data
This section collects any data citations, data availability statements, or supplementary materials included in this article.
Supplementary Materials
Figure S1 Axial PDFF maps of the supraclavicular (upper image) and the gluteal adipose tissue (lower image). Red labels delineate the fat depots segmented. Segmentations resulted in one volume of interest per fat depot. PDFF: proton density fat fraction


