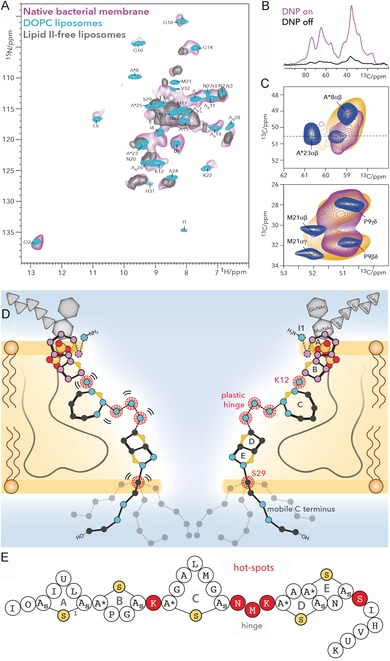
Figure 6.

A) Comparison of 1H‐detected 2D NH spectra of nisin bound to lipid II in cellular M. flavus membranes (magenta) and in DOPC (cyan). The gray spectrum shows nisin nonspecifically bound to liposomes in the absence of lipid II. B) 13C spectra of nisin bound to lipid II in M. flavus membranes with (magenta) and without (black) DNP enhancement. C) The hinge domain is plastic and broadens out under DNP conditions with a 100 K sample temperature (orange). This is even more pronounced in cellular membranes (magenta). Upper panel: zoom into residue A*23, adjacent to the hinge. Lower panel: zoom into M21 of the hinge. D) Membrane arrangement of the nisin⋅lipid II topology from ssNMR. Plastic residues are highlighted with red circles. Residues that showed 1H/2H exchange are colored in blue and align the pore lumen. The C terminus is dynamically disordered. The A and B rings (in magenta) interact with the pyrophosphate group. E) Linker residues (in red) are pharmaceutical hotspots that enable improvement of nisin's activity upon mutation. These residues were all identified as important for nisin's cellular adaptability by cellular ssNMR.30 Figure reproduced from ref. 30. Copyright: 2018, the authors.
