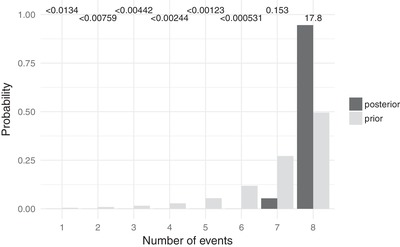
Figure 2.

Approximate prior (light bars) and posterior (dark bars) probabilities of numbers of divergence events across pairs of Cyrtodactylus populations. Bayes factors for each number of divergence times is given above the corresponding bars. Each Bayes factor compares the corresponding number of events to all other possible numbers of divergence events. Figure generated with ggplot2 Version 2.2.1 (Wickham 2009).
