

To the Editor:
1.
In the general population, it has been shown that higher body‐mass index (BMI) is associated with increased von willebrand factor (VWF) and factor VIII (FVIII) levels.1 A higher BMI is also associated with other procoagulant hemostatic changes, and may therefore protect against bleeding.1 The association between BMI, VWF and FVIII levels, and bleeding phenotype is unknown in von Willebrand disease (VWD) patients. We hypothesize that higher BMI increases VWF and FVIII levels in patients with VWD, and thereby may ameliorate the bleeding phenotype. Therefore, we investigated the association between BMI, VWF and FVIII levels, and the bleeding phenotype in a large cohort of type 1 and type 2 VWD patients.
We included patients from a nationwide cross‐sectional study in VWD patients in the Netherlands, known as the “Willebrand in the Netherlands Study” (WiN study).2, 3 The inclusion criteria were hemorrhagic symptoms or a family history of VWD, and historically lowest VWF:Ag and/or VWF:RCo ≤0.30 IU/mL and/or FVIII levels (FVIII:C) ≤0.40 IU/mL (for type 2N VWD). For this study, we excluded patients with type 3 VWD (VWF levels and VWF propeptide [VWFpp] <0.05 IU/mL), because these patients have by definition undetectable VWF levels. We categorize type 1 and type 2 VWD based on a VWF:Ab/VWF:Ag ratio of above and below 0.60.4
Furthermore, we excluded patients younger than 16 years old, because BMI reference ranges are different in children of a young age compared to adults. Blood samples were obtained at study inclusion. All patients signed informed consent. The assessment methods, blood sampling procedure, and laboratory measurements have been described in detail previously.2, 3 Briefly, patients filled in a questionnaire on comorbidities, a self‐administered version of the condensed Tosetto bleeding score and bleeding episodes that required hemostatic treatment in the year prior to inclusion. BMI was calculated with the formula weight (kg)/height (m) × height (m). BMI was categorized in four groups of underweight (BMI: <18.5 kg/m2), normal weight (18.5‐25 kg/m2), overweight (25‐30 kg/m2), and obesity (≥30 kg/m2).
We compared continuous variables between two groups using an independent t test, and categorical variables with a chi‐square test. The association between BMI categories and occurrence of bleeding in the year prior to inclusion in the study was adjusted for confounders using logistic regression analysis. Outcomes of logistic regression analysis are reported as odds ratio and 95% confidence interval (CI). Multiple regression analyses were used to analyze the association between BMI and VWF and FVIII levels and total bleeding score. We report linear regression outcomes as unstandardized β coefficient (difference) and 95%CI. In the logistic and multiple regression analysis, confounders were selected based on previous literature (age, sex, blood group [O vs non‐O], and presence of relevant comorbidities [cancer, hypertension, diabetes, and thyroid gland dysfunction]).3 Statistical analyses were performed with SPSS Statistics version 24 (IBM Corp., Armonk, New York).
From the total WiN study population aging 16 years and older (n = 688), 94 patients without centrally measured VWF and FVIII levels, 14 patients with type 3 VWD and 35 patients with missing data on length or weight were excluded. We included 545 VWD patients of whom 349 patients had type 1 and 196 patients had type 2 VWD. Table 1 shows the patient characteristics. The mean BMI was 25.4 ± 4.3 kg/m2. The mean age was 46 ± 15 years. There was no difference in BMI between patients with type 1 and type 2 VWD (25.5 ± 4.4 vs 25.2 ± 4.3, P = .550, Table 1).
Table 1.
Patient characteristics
| Type 1 VWD n = 349 |
Type 2 VWD n = 196 |
Total patients n = 545 |
|
|---|---|---|---|
| Age, mean ± SD | 46 ± 15 | 46 ± 16 | 46 ± 15 |
| Female, n (%) | 244 (70%)* | 109 (56%)* | 353 (65%) |
| Blood group O, n (%) | 241 (69%)* | 97* (50%)* | 338 (62%) |
| BMI, mean ± SD | 25.5 ± 4.4 | 25.2 ± 4.3 | 25.4 ± 4.3 |
| VWF:Ag | 0.37 [0.23‐0.53]* | 0.26 [0.17‐0.36]* | 0.31 [0.19‐0.47] |
| VWF:CB | 0.42 [0.23‐0.66]* | 0.08 [0.06‐0.14]* | 0.26 [0.09‐0.54] |
| VWF:Ab | 0.45 [0.23‐0.70]* | 0.08 [0.03‐0.17]* | 0.25 [0.11‐0.56] |
| FVIII:C | 0.66 [0.49‐0.87]* | 0.38 [0.28‐0.49]* | 0.54 [0.36‐0.77] |
| Bleeding score | 9 [5‐15]* | 12 [8‐17]* | 11 [6‐16] |
| Number of patients with bleeding in the year prior to inclusion per BMI category | |||
| <18.5 kg/m2 | 4/9 (44%) | 1/4 (25%) | 5/13 (39%) |
| 18.5‐25 kg/m2 | 28/170 (17%) | 41/106 (39%) | 69/276 (25%) |
| 25‐30 kg/m2 | 30/116 (26%) | 23/59 (39%) | 53/175 (30%) |
| ≥30 kg/m2 | 16/54 (30%)** | 15/27 (56%) | 31/81 (38%)** |
Note: Data are presented as median [interquartile ranges], unless otherwise specified.
Abbreviations: BMI, body‐mass index (kg/m2); SD, standard deviation; VWD, von Willebrand disease.
* P value below 0.05 between patients with type 1 and type 2 VWD.
** P value below 0.05 compared to BMI category 18.5‐25 kg/m2.
Among patients with type 1 VWD, higher BMI was associated with higher VWF:Ag, VWF:CB, VWF:Ab and FVIII:C, respectively 0.07 IU/mL (0.02‐0.13), 0.07 IU/mL (0.00‐0.14), 0.09 IU/mL (0.01‐0.17), and 0.13 IU/mL (0.05‐0.21) per 10 kg/m2 increase in BMI (adjusted for age, sex, blood group, and presence of relevant comorbidities). In type 2 VWD, VWF:Ag and FVIII:C were associated with higher BMI, respectively 0.04 IU/mL (−0.02‐0.10) and 0.09 IU/mL (0.00‐0.17) per 10 kg/m2 increase in BMI (adjusted for age, sex, blood group, and presence of relevant comorbidities). Similarly, in type 1 VWD, a linear association was observed between BMI categories (underweight, normal weight, overweight, and obesity) and VWF levels (Figure 1A), whereas in type 2 VWD, there was a linear association between BMI categories and VWF:Ag and FVIII:C (Figure 1B).
Figure 1.
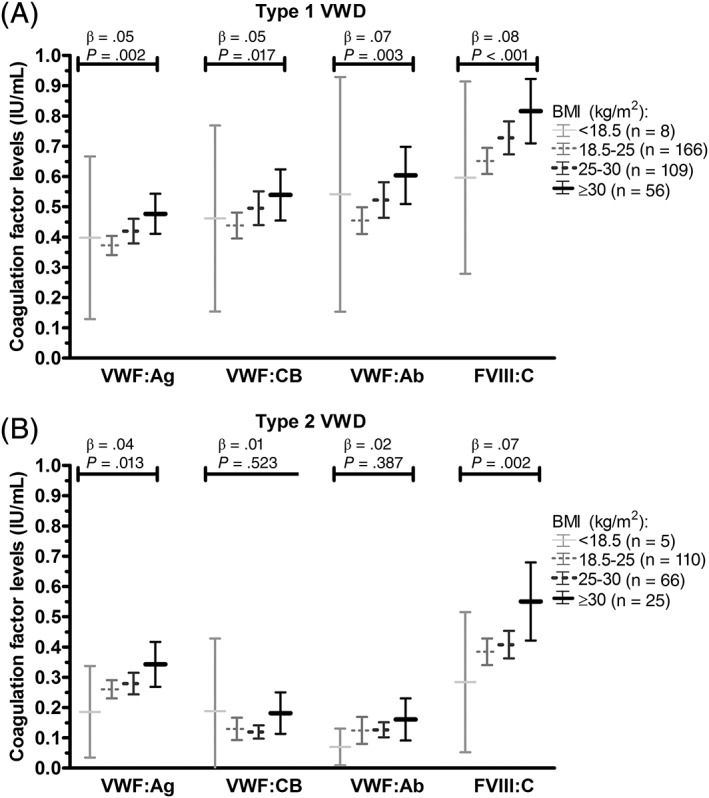
Association between BMI categories and VWF levels in type 1 and type 2 VWD. Data presented as mean and 95% confidence intervals. β outcomes of linear regression analysis. BMI, body‐mass index
In the total VWD population, patients with normal weight had fewer bleeding episodes requiring hemostatic treatment in the year prior to inclusion in the study than patients with overweight and obesity, respectively 25% (69/276) vs 30% (53/175) and 38% (31/81) (P = .018, Table 1). In type 1 VWD, the proportion of patients with bleeding was almost two times higher in patients with obesity compared to patients with normal weight (relative risk 1.8, 30% (16/54) vs 17% (28/170), P = .034, Table 1). After adjustment for age, sex, blood group, and presence of relevant comorbidities, the odds ratio was 1.91 (0.89‐4.11). In type 2 VWD, a higher proportion of patients with obesity tended to have a bleeding episode requiring hemostatic treatment in the year prior to inclusion than patients with normal weight (relative risk 1.4, 56% (15/27) vs 39% (41/106), P = .113, Table 1). In type 1 and type 2 VWD patients there was no clear association between BMI and the total (life time) bleeding score, respectively 0.54 (−1.16‐2.25) and 1.35 (−0.94‐3.63) per 10 kg/m2 increase in BMI.
In this study we demonstrate that BMI is an important determinant of VWF and FVIII levels in patients with VWD. Although in the general population an association between BMI and VWF and FVIII levels was observed previously, this association is demonstrated in this study for the first time in patients with VWD. In accordance, it has previously been suggested that most VWF expression is seen in adipose‐subcutaneous tissue, and therefore individuals with more adipose‐subcutaneous tissue (ie, higher BMI) have higher VWF expression, leading to higher VWF and FVIII levels.5
Despite an association with higher VWF and FVIII levels, BMI does not seem to protect against bleeding. VWD patients with obesity and overweight experienced even more bleeding symptoms in the year prior to the study than VWD patients with normal weight. This suggests that overweight and obese VWD patients, who have slightly higher VWF levels compared to VWD patients with a normal weight, are not protected against bleeding and still need to receive prophylactic treatment during interventions. Furthermore, our results indicate that the increase in VWF and FVIII levels in overweight and obese patients is insufficient to prevent bleeding, and that other determinants than VWF and FVIII levels influence the bleeding tendency of these patients6 more frequent surgical treatment, because overweight and obese patients may need more often surgery due to BMI associated comorbidities, such as orthopedic problems, and therefore have a higher risk of bleeding. Additionally, factors outside the hemostatic system, such as vascular damage, more frequent falls and poor wound healing could potentially have a role in the bleeding tendency of these patients.6 This is supported by several large studies in the past that found that obesity, despite causing procoagulant hemostatic changes, does not protect against bleeding.6
This is the first study to demonstrate an important association between BMI, VWF and FVIII levels, and bleeding phenotype in VWD patients. The main limitation of this study is that we did not have longitudinal VWF measurements in patients over time. However, BMI remains quite constant with aging, and therefore intra‐individual analysis would probably be less informative than inter‐individual analysis, which was performed in this study.
To conclude, higher BMI is associated with higher VWF and FVIII levels in patients with type 1 and type 2 VWD. However, higher BMI does not seem to protect against bleeding. Despite higher VWF and FVIII levels, VWD patients with overweight and obesity had more bleeding symptoms in the year prior to inclusion than patients with normal weight.
CONFLICT OF INTEREST
F. Atiq received the professor Heimburger Award 2018. F.W.G. Leebeek received research support from CSL Behring and Shire/Takeda for performing the Willebrand in the Netherlands (WiN) study, and is consultant for uniQure, Novo Nordisk and Shire/Takeda, of which the fees go to the institution. J. Eikenboom received research support from CSL Behring and he has been a teacher on educational activities of Roche. K. P. M. van Galen received unrestricted research support from CSL Behring and Bayer. E.P. Mauser‐Bunschoten received unrestricted research/ educational support from CSL Behring, Bayer, Baxter, Grifols, Novo Nordisk, Pfizer, Biotest, Roche and Sanquin. J.G. van der Bom has been a teacher on educational activities of Bayer. M.H. Cnossen has received unrestricted research/educational and travel funding from the following companies: Pfizer, Baxter, Bayer Schering Pharma, CSL Behring, Novo Nordisk and Novartis, and serves as a member on steering boards of Roche and Bayer of which fees go to the institution. K. Fijnvandraat is a member of the European Hemophilia Treatment and Standardization Board sponsored by Baxter, has received unrestricted research grants from CSL Behring and Bayer, and has given lectures at educational symposiums organized by Pfizer, Bayer and Baxter. K. Meijer received research support from Bayer, Sanquin and Pfizer; speaker fees from Bayer, Sanquin, Boehringer Ingelheim, BMS and Aspen; consulting fees from Uniqure, of which all fees go to the institution. B. Laros‐van Gorkom has received unrestricted educational grants from Baxter and CSL Behring. M. Coppens has received research support, lecturing and consulting fees from Bayer, CSL Behring, UniQure, Sanquin and Sanofi. All fees were received by his institution. None of the other authors has a conflict of interest to declare.
AUTHOR CONTRIBUTIONS
F.A. designed the study, performed statistical analysis, interpreted data, and wrote the manuscript. E.M.‐B., J.E., K.G., K.M., J.M., M.C., M.C., B.L.G., J.B., and K.F. designed the study, interpreted data and critically revised the manuscript. F.L. conceived of and designed the study, interpreted data, and critically revised the manuscript. All authors gave their consent to the final version of the manuscript.
ACKNOWLEDGMENTS
This study was supported (in part) by research funding from the Dutch Hemophilia Foundation (Stichting Hemophilia) and CSL Behring (unrestricted grant).
REFERENCES
- 1. Mertens I, Van Gaal LF. Obesity, haemostasis and the fibrinolytic system. Obes Rev. 2002;3:85‐101. [DOI] [PubMed] [Google Scholar]
- 2. de Wee EM, Mauser‐Bunschoten EP, Van Der Bom JG, et al. Health‐related quality of life among adult patients with moderate and severe von Willebrand disease. J Thromb Haemost. 2010;8:1492‐1499. [DOI] [PubMed] [Google Scholar]
- 3. Atiq F, Meijer K, Eikenboom J, et al. Comorbidities associated with higher von Willebrand factor (VWF) levels may explain the age‐related increase of VWF in von Willebrand disease. Br J Haematol. 2018;182:93‐105. [DOI] [PMC free article] [PubMed] [Google Scholar]
- 4. Leebeek FW, Eikenboom JC. Von Willebrand's disease. N Engl J Med. 2016;375:2067‐2080. [DOI] [PubMed] [Google Scholar]
- 5. Consortium GTE. The genotype‐tissue expression (GTEx) project. Nat Genet. 2013;45:580‐585. [DOI] [PMC free article] [PubMed] [Google Scholar]
- 6. Braekkan SK, van der Graaf Y, Visseren FL, et al. Obesity and risk of bleeding: the SMART study. J Thromb Haemost. 2016;14:65‐72. [DOI] [PubMed] [Google Scholar]