

Abstract
Multimodality treatment has advanced the outcome of esophageal adenocarcinoma (EAC), but overall survival remains poor. Therapeutic pressure activates effective resistance mechanisms and we characterized these mechanisms in response to the currently used neoadjuvant treatment against EAC: carboplatin, paclitaxel and radiotherapy. We developed an in vitro approximation of this regimen and applied it to primary patient‐derived cultures. We observed a heterogeneous epithelial‐to‐mesenchymal (EMT) response to the high therapeutic pressure exerted by chemoradiation. We found EMT to be initiated by the autocrine production and response to transforming growth factor beta (TGF‐β) of EAC cells. Inhibition of TGF‐β ligands effectively abolished chemoradiation‐induced EMT. Assessment of TGF‐β serum levels in EAC patients revealed that high levels after neoadjuvant treatment predicted the presence of fluorodeoxyglucose uptake in lymph nodes on the post‐chemoradiation positron emission tomography‐scan. Our study shows that chemoradiation contributes to resistant metastatic disease in EAC patients by inducing EMT via autocrine TGF‐β production. Monitoring TGF‐β serum levels during treatment could identify those patients at risk of developing metastatic disease, and who would likely benefit from TGF‐β targeting therapy.
Keywords: TGF‐β, esophageal adenocarcinoma, chemoradiation, biomarker, epithelial‐to‐mesenchymal transition
Short abstract
What's new?
Therapeutic resistance and disease recurrence are major setbacks affecting the survival of patients with esophageal adenocarcinoma (EAC). Resistance mechanisms in EAC, however, await elucidation. Here, epithelial‐to‐mesenchymal transition (EMT), a hallmark of invasive tumor phenotype, was investigated as a possible mechanism driving chemoradiation resistance in EAC. In EAC cells, chemoradiation was found to induce EMT, a process mediated via autocrine TGF‐β production. Inhibition of TGF‐β counteracted this process. In patients, elevated circulating TGF‐β levels post‐chemoradiation were associated with progressive disease. Together, these data suggest that TGF‐β is a useful marker for identifying patients who might benefit from TGF‐β inhibition during chemoradiation.
Abbreviations
- CDH1
E‐cadherin
- CDH2
N‐cadherin
- EAC
esophageal adenocarcinoma
- EMT
epithelial‐to‐mesenchymal transition
- FDG
fluorodeoxyglucose
- PET
positron emission tomography
- PFS
progression‐free survival
- SNAI2
slug
- TGF‐β/TGFB1
transforming growth factor beta
Introduction
Resistance to anticancer treatments remains a major health care problem. The mechanisms that drive therapy resistance differ considerably between cancer types and the therapeutic regimen applied.1 Esophageal adenocarcinoma (EAC) is no exception. In the CROSS trial neoadjuvant chemoradiation (carboplatin, paclitaxel and concurrent radiotherapy [41.4 Gy]) followed by surgery was found to increase overall survival from 24 to 49 months, and it has become standard of care for the treatment of resectable EAC in several countries.2, 3 Nevertheless, despite this improvement in overall survival, more than one third of patients will experience disease recurrence and the vast majority of these patients suffer from distant metastases,4 urging the identification of mechanisms that contribute to therapy resistance and aggressive tumor behavior.
Reports on resistance mechanisms against cytotoxic agents and ionizing therapy in EAC are limited. These reports have typically described the dysregulation of microRNAs (miRNAs) to yield a cell population with enhanced stem cell‐like properties.5, 6, 7, 8 Resistance mechanisms have so far all been identified using single cytotoxic drug or radiation‐only regimens. Importantly, none were targetable by currently available agents. Recently, we identified epithelial‐to‐mesenchymal transition (EMT) as a mechanism of resistance in EAC in response to growth factor inhibition.9 EMT has been linked to aberrant expression of miRNAs and concomitant upregulation of stemness.10, 11 In addition, this transition endows cancer cells with the migratory capacity thought to be required for metastatic dissemination.12 To improve survival in EAC patients, it is vital to identify a clinically applicable strategy to thwart resistance against a triple treatment modality based on the CROSS regimen.
In our study, we employed an in vitro approximation of the CROSS regimen on primary and previously established EAC cultures and observed induction of EMT after chemoradiation. This transition was mediated by tumor cell‐secreted transforming growth factor beta (TGF‐β), and neutralization of this ligand reversed the mesenchymal phenotype and concomitant migratory capacity. Potential clinical implications of these findings came from the assessment of TGF‐β serum levels in EAC patients where high TGF‐β serum level prior to treatment could identify patients with shorter progression‐free survival (PFS). Patients with fluorodeoxyglucose (FDG) uptake in structures other than the primary tumor (i.e., mainly lymph nodes) on positron emission tomography (PET)‐CT after completing the CROSS regimen maintained significantly higher TGF‐β serum levels as compared to FDG uptake‐negative patients. Monitoring TGF‐β serum level could thus identify patients at risk for developing metastatic disease. Given the availability of FDA‐approved TGF‐β pathway inhibitors, this could be a promising strategy to overcome therapy resistance in EAC patients receiving the CROSS regimen.
Materials and Methods
Cell culture, chemicals and in vitro chemoradiation
OE19 cells (ATCC, Manassas, VA) were cultured according to standard procedures as described earlier.9 Carboplatin and paclitaxel were purchased from the pharmacy of the Academic Medical Center. Recombinant TGF‐β, used at 2 ng/mL was purchased from Peprotech (Rocky Hill, NJ). TGF‐β neutralizing antibody, fresolimumab, was a kind gift from Sanofi Genzyme (Framingham, MA) and was used at 10 μg/mL. For chemoradiation treatments, OE19, 081R and 037M cells were challenged with the following 2 week therapy scheme: Day 1, one single dose of carboplatin (2 μM) and paclitaxel (0.05 nM) combined with 1 Gy radiation; Day 2–5, cells received 1 Gy radiation per day; Day 6–7, cells received no therapy. This cycle was repeated on Day 8. 031M and 007B cells received the same schedule only using carboplatin (20 μm) and paclitaxel (0.5 μm). Doses were based on IC20 of each cell line. Only multimodality treatment was tested as this is used in the clinic and therefore most relevant.
Establishment and treatment of primary cell cultures
The establishment of primary EAC cultures was previously described.13 The specimens were grafted in NOD.Cg‐Prkdc scid Il2rg tm1Wjl/SzJ (NSG) immunodeficient mice to expand the material and their care was in accordance with institution guidelines and ethical approval (LEX102774). The primary EAC cultures used in our study are 031M, 007B, 081R and 037M, and patient characteristics regarding these cultures are listed in Table 1. Primary cultures were maintained as described earlier.9
Immunofluorescence
Immunofluorescence was performed as previously described.9 An SP8‐X SMD confocal microscope (Leica, Wetzlar, Germany) was used for visualization. The following antibodies were used: anti‐CDH1 (1:300, EP700Y, Abcam, Cambridge, UK) and anti‐vimentin (1:300, 0.N.602, Santa Cruz Biotechnology, Dallas, TX). Isotype control: FITC conjugated IgG1,K mouse isotype (1:300, P3.6.2.8.1, eBioscience, San Diego, CA) and unconjugated IgG mouse isotype (1:300, X40, BD Biosciences, San Jose, CA). Secondary antibodies: Alexa Fluor 488 conjugated anti‐rabbit IgG1 (1:400, A11008, Invitrogen, Waltham, MA) and Alexa Fluor 568 conjugated anti‐mouse IgG1 (1:400, A21124, Thermo Fisher, Waltham, MA). All incubations were in PBS + 0.1% Triton X‐100 + 1% normal goat serum.
Flow cytometry
Flow cytometric analyses were performed as described previously,14 using the following antibodies: anti‐CDH1 (1:500, EP700Y, Abcam), anti‐vimentin (1:300, 3B4, Agilent Technologies, San Jose, CA), FITC conjugated anti‐EPCAM (1:500, Ber‐EP4, DAKO, Glostrup, Denmark) and anti‐ZEB1 (1:100, Sigma, St Louis, MO). Propidium iodide was used to control for unspecific staining of dead cells. No dye exclusion was used when measuring intracellular epitopes, which were stained after using permeabilization buffer (BD Biosciences, San Jose, CA). Data were analyzed with FlowJo 10 (Tree Star, Ashland, OR).
Quantitative RT‐PCR
RNA isolation was performed (Macherey Nagel, Düren, Germany), and cDNA was synthesized using Superscript III (Invitrogen). SYBR green and a Lightcycler LC480II (both from Roche, Basel, Switzerland) were used to perform quantitative PCR (qRT‐PCR), according to the manufacturer's protocols. The comparative threshold cycle (Cp) method was used to calculate transcript levels, which were normalized to RPS18. The used primer sequences are listed in Table 2.
Next‐generation sequencing
Genomic DNA was isolated of cells using NucleoSpin Tissue according to manufacturer's instructions (Macherey‐Nagel). IonAmpliseq DNA libraries were prepared for panel‐based next‐generation sequencing (NGS) following the manufactures instructions (Life Technologies, Villebon sur Yvette, France). Target genes included in the panel were based on frequently mutated genes in EAC identified in the COSMIC database.15 Amplicon libraries were quantified using the Qubit dsDNA HS assay kit (Life Technologies) and subsequently sequenced at a depth of 250x on an IonTorrent S5™ system (Ion Torrent, Life Technologies). BAM files and sequence quality reports were generated in the Torrent suite software v5.10.
Western blot
Western blot analyses were performed as described previously.9 Primary antibodies: anti‐pSMAD2 (Ser465/467) (1:000, 138D4, Cell Signaling, Leiden, The Netherlands), anti‐SMAD2 (1:1000, L16D3, Cell Signaling) and anti‐GAPDH (1:5000, 6C5, BioConnect, San Diego, CA) were incubated overnight at 4°C. The secondary antibodies HRP‐conjugated Goat anti‐rabbit (1:5000, 7074, Cell Signaling) and HRP‐conjugated Goat anti‐mouse (1:5000, 1031‐05, Southern Biotech, Birmingham, Al) were incubated for 2 hr at room temperature. Proteins were imaged using Lumi‐Light plus Western blot substrate (Pierce, Thermo Scientific) on a FujiFilm LAS 4000 imager (Fuji, Tokyo, Japan).
Migration assay
The migration assays were performed as described previously.9 Prior to the assay, cells were either untreated subjected to the chemoradiation scheme or subjected to recombinant TGF‐β for 2 weeks. In the chemoradiation (CR) condition with fresolimumab, the fresolimumab was added at the start of the second week of the chemoradiation scheme. The cells were counted and equal amounts of cells per condition were used in the assay. Two percent serum was added as attractant in the lower compartment of the Transwell setup. Migration was measured every 2 min during 3 hr at 37°C using a cytofluorometer (BioTek Instruments, Winooski, VT). The values were controlled for the no‐attractant control.
Serum sample collection and TGF‐β measurement
Serum samples of patients diagnosed with EAC were collected in the BiOES biobank and processed according to the REMARK guidelines. Blood samples were spun down at for 10 min at 13,000 rcf and stored at −80°C. Blood was drawn before the start of therapy and directly after completing 5 weeks of neoadjuvant chemoradiation according to the CROSS regimen. For analysis of PFS before start of therapy, 63 patients were included (cohort 1) of which the clinical characteristics are listed in Table 3. For analysis of free TGF‐β1 serum levels before and after neoadjuvant chemoradiation, 20 patients with paired samples were included (cohort 2) of which the clinical characteristics are listed in Table 4. For analysis of free TGF‐β1 serum levels in patients with or without metastatic disease, 175 serum samples from our BiOES biobank were selected of which the clinical characteristic are listed in Table 5. Staging was performed according to the 7th edition of the American Joint Committee on Cancer/Union for International Cancer Control. TGF‐β serum concentration was quantified by ELISA (R&D Systems, DuoSet, Minneapolis, MN) according to the manufacturer's instructions in which the biologically active form of TGF‐β (referred to as free TGF‐β) was measured.
PET‐CT imaging
To identify patients with metastasis preoperatively and avoid non‐curative resections, a FDG PET‐CT scan was made 3 weeks after EAC patients had completed the CROSS regimen as described earlier.16 Post‐chemoradiation PET images were assessed by a nuclear medicine physician to determine pathological FDG uptake in locations outside the primary tumor.
Statistics
For Kaplan‐Meier analysis, the TGF‐β cutoff was determined using an established method to assess cutoff points in molecular data17 and log‐rank test was performed to determine statistical significance. PFS was defined as time from diagnosis until recurrence or death. In all experiments, two‐sided unpaired t‐tests were performed, unless noted otherwise. Statistical analyses were performed using GraphPad Prism 6. Error bars show the mean ± SD. A p‐value of <0.05 was considered statistically significant.
Study approval
All patients included in the BiOES biobank signed informed consent for the procedures described in this article (i.e., blood collection and grafting of EAC tumor pieces in mice) which was approved by the Academic Medical Center's ethical committee (METC 01/288#08.17.1042) and in accordance with the Declaration of Helsinki.13
Results
Chemoradiation therapy induces EMT in EAC cells
To study the consequences of chemoradiation at the cellular level, we developed an in vitro estimation of the CROSS regimen by first determining the IC20 for the individual regimen components (carboplatin, paclitaxel and radiotherapy). Patient‐derived 031M and 007B EAC cultures were then subjected to 2 weeks of combination treatment and morphology was assessed by phase contrast microscopy (Figs. 1 a and 1b). This revealed a marked morphological change; 031M cells obtained an elongated shape and reduced cell–cell adhesion. 007B cells remained densely packed in islands but displayed a more flattened morphology after chemoradiation. To characterize this morphological transition in more detail, immunofluorescence for specific markers was employed which revealed a decreased expression of the epithelial marker E‐cadherin (CDH1), and an increase in the mesenchymal marker vimentin (VIM) in 031M cells (Fig. 1 a), whereas these markers remained unchanged in 007B cells after chemoradiation (Fig. 1 b). These findings were in agreement with flow cytometry analysis that showed a decrease in CDH1 or EPCAM positive populations and an increase in VIM positivity for both the OE19 and 031M cells. Shifts in expression of VIM and CDH1 occurred only modestly in 007B cells after chemoradiation (Fig. 2 a). At the molecular level, markers for cell states were analyzed using qRT‐PCR and this revealed a significant induction of mesenchymal markers VIM (p = 0.012), ZEB1 (p = 0.031), slug (SNAI2) (p = 0.0024) and N‐cadherin (CDH2) (p = 0.0094), and cancer stem cell markers LGR5 (p < 0.0001) and CD133 (p = 0.0104) in OE19 and SNAI2 (p = 0.019), CDH2 (p = 0.0003), LGR5 (p = 0.0351) and CD133 (p = 0.0015) in 031M cultures (Fig. 2 b). 007B cultures showed an increase in VIM (p = 0.022) expression but not ZEB1, SNAI2, TWIST1 and LGR5 (CDH2 and CD133 were not detectable in both untreated and treated 007B cells). Together, these results suggest that EAC cells undergo EMT under the high therapeutic pressure of chemoradiation, and that inter‐tumor heterogeneity exists in this response.
Figure 1.
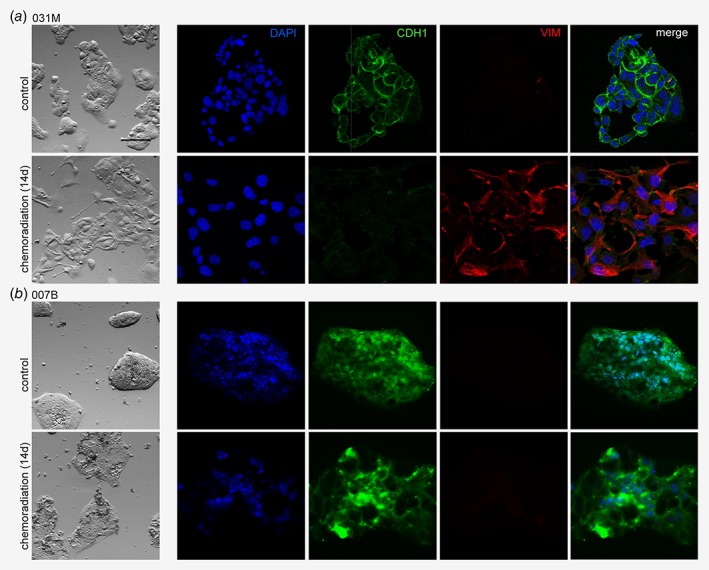
Chemoradiation therapy induces a mesenchymal morphology in a subset of EAC tumors. (a) 031M cells were either left untreated or subjected to a 14 days chemoradiation scheme and morphology was assessed by phase‐contrast microscopy and immunofluorescent staining using the indicated epithelial (CDH1) and mesenchymal (VIM) markers. Nuclei were stained using DAPI. Scale bar: 200 μm. (b) As for (a), using the 007B culture. [Color figure can be viewed at wileyonlinelibrary.com]
Figure 2.
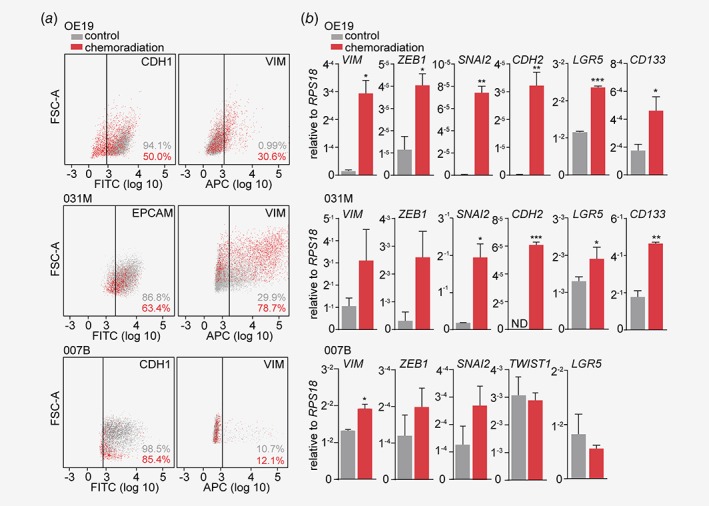
Chemoradiation therapy readily increases markers for EMT in EAC cells. (a) OE19, 031M and 007B cells were either left untreated or subjected to a 14 days chemoradiation scheme, and cell surface epithelial (CDH1, as CDH1 was not detected by flow cytometry in 031M cells EPCAM was used) and mesenchymal (VIM) markers were assessed using flow cytometry. (b) OE19, 031M and 007B cells in the same conditions as for (a), and gene expression of the indicated mesenchymal and cancer stem cell markers was determined using quantitative RT‐PCR. The bar graphs show means ± SD, n = 2. *p < 0.05, **p < 0.01, ***p < 0.001. [Color figure can be viewed at wileyonlinelibrary.com]
To test whether established primary EAC cultures derived from a metastasis biopsy, such as 031M cells, are more prone to undergo EMT when subjected to chemoradiation compared to cultures derived from the primary tumor, such as 007B cells, chemoradiation experiments were performed in patient‐derived 081R and 037M cultures. Microscopic assessment showed that 081R cells—derived from a primary tumor—obtained a more elongated mesenchymal morphology after chemoradiation (Fig. S1 a). In contrast, 037M cells—derived from a metastasis biopsy—remained densely packed in flattened islands, similar to 007B cells. On the protein (Fig. S1 b) and mRNA (Fig. S1 c) level, markers for EMT and stemness were strongly induced in 081R cells after chemoradiation, whereas these markers were only modestly increased in 037M cells. This suggests that EAC cells derived from a metastasis do not have a higher propensity to undergo EMT after chemoradiation, and implies that other cell‐intrinsic features contribute to the observed heterogeneous inter‐tumor response.
In an attempt to clarify the heterogeneous EMT response to chemoradiation, the genomic profiles of the EAC cultures OE19, 031M, 081R, 037M and 007B were analyzed using panel‐based IonTorrent next‐generation sequencing (Fig. S2). This revealed that all EAC cultures had a pathogenic mutation (substitutions/missense) in TP53 and 031M, 081R and 007B cells had a pathogenic mutation in ERBB2. Furthermore, several other pathogenic mutations (substitutions/missense, truncating or in frame indel) were found in 081R (CDKN2A and CTNNB1), 037M (FLG) and 007B (FGFR3). Together, these analyses revealed no enrichment for particular mutations in those cells that are highly prone to undergo EMT after chemoradiation (i.e., OE19, 031M and 081R cells) compared to cells with a low EMT propensity (i.e., 037M and 007B cells).
EAC cells produce TGF‐β in response to chemoradiation therapy to induce EMT
Recent work from our group has demonstrated that EMT in EAC cells can be initiated by the production of TGF‐β ligand and subsequent activation of the downstream pathway, and we hypothesized that this signaling axis could also be responsible for chemoradiation‐induced EMT.9 The concentration of free TGF‐β was determined in supernatant of OE19, 031M and 007B cells exposed to 14 days of chemoradiation, and this revealed that EAC cells produce TGF‐β in response to chemoradiation (Fig. 3 a). Interestingly, levels of secreted TGF‐β differed strongly between cell lines. OE19 and 031M cells produced respectively 433 and 191 pg/mL, whereas 007B cells were found to produce only 92 pg/mL free TGF‐β. To assess if the secreted TGF‐β was active, supernatant of OE19 and 031M cells exposed to 14 days of chemoradiation was placed on 293T cells, which lack endogenous TGF‐β activating ligands. Western blot analysis revealed induction of SMAD2 phosphorylation in 293T cells incubated with supernatant from EAC cells exposed to chemoradiation compared to supernatant from untreated EAC cells (Fig. 3 b). This showed that EAC cells are able to produce and secrete active TGF‐β ligands after chemoradiation. To ascertain whether EAC cells are also responsive to TGF‐β, treatment naive EAC cells were stimulated with recombinant TGF‐β for 14 days, and a mesenchymal morphology similar to that induced by chemoradiation was observed in OE19 and 031M cells (Fig. 3 c). This was confirmed at the protein level by immunofluorescent staining for EMT markers (Fig. 3 d). 007B cells were less responsive to TGF‐β showing modest morphological changes suggesting that 007B cells are less prone to undergo EMT in response to chemoradiation as they produce only little TGF‐β and are not as sensitive to this ligand compared to 031M and OE19 cells (Fig. 3 c). Together, these data demonstrate that a subset of EAC tumor types produces active TGF‐β in response to chemoradiation, and that this induces EMT.
Figure 3.
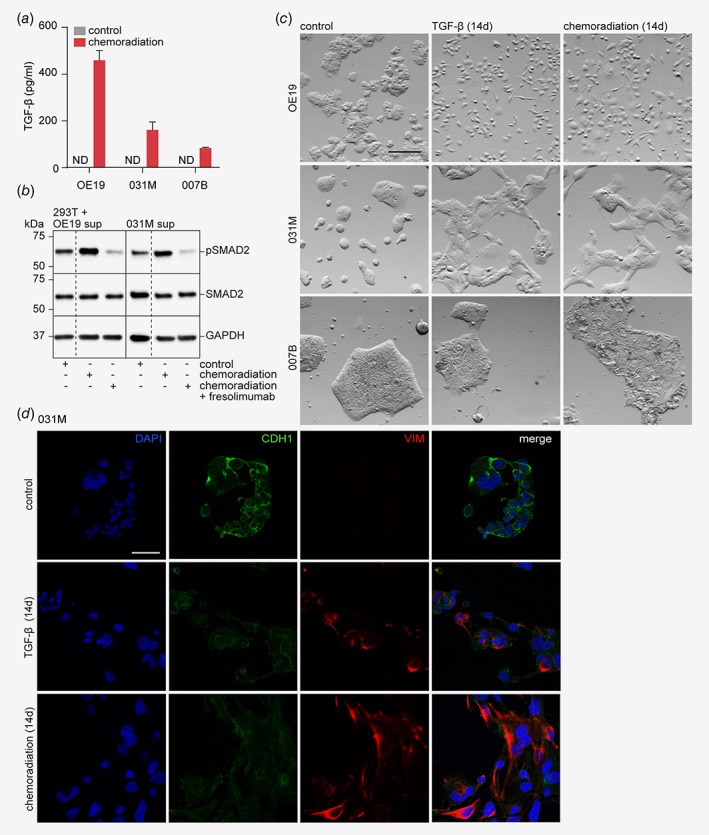
EAC cells produce TGF‐β in response to chemoradiation therapy and thereby induce EMT. (a) OE19, 031M and 007B cells were subjected to a 14 days chemoradiation scheme and the supernatant was used to measure the amount of free TGF‐β using ELISA. (b) OE19 and 31M cells were subjected to a 14 days chemoradiation scheme with or without the addition of fresolimumab, a TGF‐β neutralizing antibody, to the last 7 days of therapy and the supernatant was used to stimulate 293T cells. Supernatant from naive cancer cells was used as control. Different conditions were on the same membrane with equal exposure time, dashed lines indicate that membrane was cropped. (c) OE19, 031M and 007B cells were either left untreated, stimulated with recombinant TGF‐β for 14 days or subjected to a 14 days chemoradiation regimen and morphology was assessed by phase‐contrast microscopy. Scale bar: 200 μm. (d) Immunofluorescent staining of the indicated markers (CDH1 and VIM) on 031M cells, either subjected to 14 days of chemoradiation, recombinant TGF‐β or untreated. DAPI was used for nuclear staining. Scale bar: 200 μm. The bar graphs show means ± SD, n = 2. [Color figure can be viewed at wileyonlinelibrary.com]
Inhibition of TGF‐β signaling reverses chemoradiation‐induced EMT
If TGF‐β signaling is indeed responsible for chemoradiation‐induced EMT in EAC, inhibition of TGF‐β should reverse this transition. OE19 and 031M cells were subjected to chemoradiation for 14 days and fresolimumab, an engineered human monoclonal antibody that neutralizes all three isoforms of TGF‐β was added to the therapy schedule during the last 7 days of chemoradiation (see also arrow diagram in Fig. 4 a). Western blot analysis demonstrated that the addition of fresolimumab to the supernatant of chemoradiated EAC cells effectively inhibited activation of SMAD2 in 293T cells (Fig. 4 b). Phase contrast microscopy images at Day 14 of treatment showed that fresolimumab could reverse the mesenchymal morphology of both OE19 and 031M cells, even during chemoradiation (Fig. 4 a). Finally, we assessed the reversibility of chemoradiation‐induced EMT with and without the addition of fresolimumab. 031M cells were subjected to chemoradiation for 1 week followed by either observation only for another week or continued chemoradiation with the addition of fresolimumab for another week (see also arrow diagram Fig. 4 b, white blocks in the arrows indicate time points at which images were taken). Phase contrast microscopy revealed that cells treated with chemoradiation followed by observation retained a mesenchymal morphology, similar to that of 031M cells that were kept on chemoradiation (Fig. 4 b). Subsequent measurement of free TGF‐β in the supernatant showed that EAC cells still secreted active TGF‐β after 7 days of observation (i.e., Day 14 of treatment, Fig. 4 c) albeit substantially lower than during chemoradiation as shown in Figure 2 a. This suggests that TGF‐β production by EAC cells in response to chemoradiation therapy is maintained over longer periods of time, and that relatively low amounts of TGF‐β are sufficient to drive a mesenchymal morphology. On the contrary, cells treated with chemoradiation and fresolimumab obtained an epithelial morphology similar to untreated control cells already at Day 12 of treatment (Fig. 4 b). Together, these results indicate that EAC cells are not able to reverse EMT within 7 days after chemoradiation in the absence of TGF‐β inhibitors.
Figure 4.
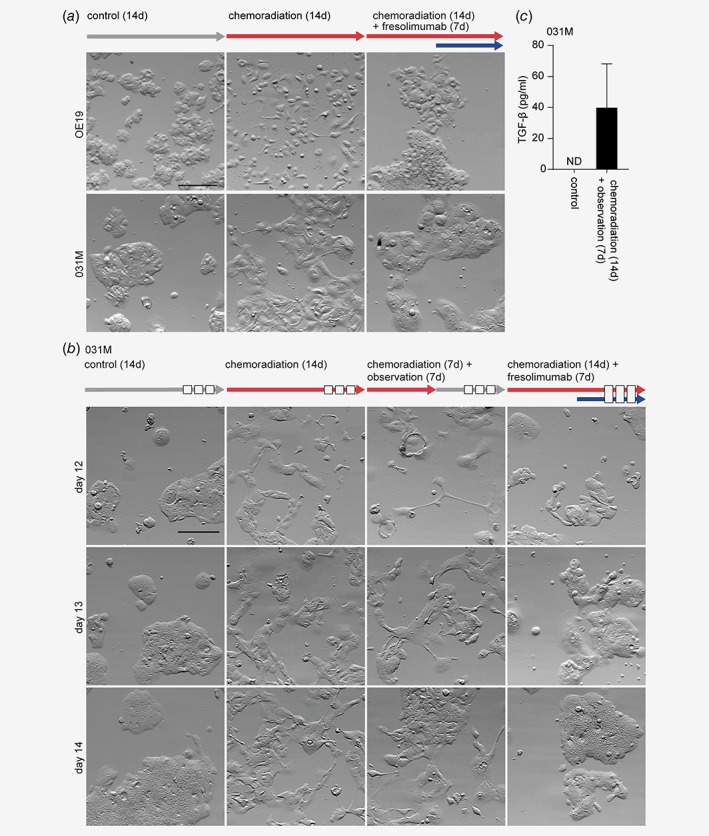
Inhibition of TGF‐β signaling during chemoradiation can reverse EMT in EAC cells. (a) OE19 and 031M cells were subjected to chemoradiation for 14 days, with or without the addition of the TGF‐β neutralizing antibody (fresolimumab) in the final 7 days. Morphology was assessed by phase‐contrast microscopy. Arrows indicate type and time of treatment. Scale bar: 200 μm. (b) Morphological analyses of 031M cells in the following conditions; no treatment, 14 days chemoradiation, 7 days chemoradiation followed by 7 days observation, 7 days chemoradiation followed by 7 days chemoradiation with fresolimumab. Arrows indicate type and time of treatment. The white blocks in the arrows indicate time points at which images were taken. Scale bar: 200 μm. (c) Supernatant of 031M cells which were either left untreated or received 7 days of chemoradiation followed by 7 days of observation was used to measure the amount of free TGF‐β using ELISA. The bar graphs show means ± SD, n = 2. [Color figure can be viewed at wileyonlinelibrary.com]
TGF‐β inhibition impairs tumor cell migration after chemoradiation
To confirm the observed mesenchymal‐to‐epithelial transition after fresolimumab incubation, transcript analysis of mesenchymal markers such as VIM, SNAI2, ZEB1 and TWIST1 was performed and revealed that the addition of fresolimumab reduced expression of EMT markers to levels similar to untreated control cells for all markers in 031M cells and the majority of markers in OE19 cells (Fig. 5 a). Also, flow cytometry analysis revealed that both recombinant TGF‐β and chemoradiation induced VIM expression in OE19 and 031M cells compared to control (Fig. 5 b, the dashed histograms represent isotype control). The addition of fresolimumab decreased VIM expression to levels below (non‐chemoradiation exposed) control, suggesting some baseline TGF‐β signaling to exist in otherwise naive EAC cells. To ascertain that the observed EMT and its reversal by fresolimumab in EAC cells after chemoradiation therapy is functional, we assessed migratory capacity using Transwell migration assays. Cells of the various conditions were collected and migration toward 2% FCS was analyzed over the course of 3 hr. Results demonstrated that migration was strongly enhanced in EAC cells after TGF‐β or chemoradiation treatment (Fig. 5 c). The addition of fresolimumab during chemoradiation treatment reduced their migratory capacity to levels similar to treatment‐naive cells, suggesting that TGF‐β inhibition is also effective against the functional consequences of EMT such as tumor cell dissemination. In conclusion, these results demonstrate that TGF‐β inhibition during chemoradiation therapy is critical to effectively and efficiently revert EMT and migration of EAC cells.
Figure 5.
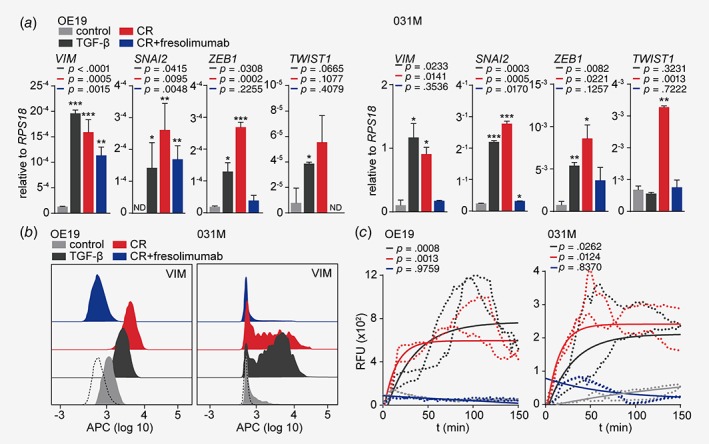
TGF‐β inhibition reduces the migratory capacity of EAC cells exposed to chemoradiation. (a) OE19 and 031M cells were left untreated or subjected to recombinant TGF‐β for 14 days, chemoradiation for 14 days, with or without the addition of the TGF‐β neutralizing antibody (fresolimumab) in the final 7 days. Gene expression of the indicated mesenchymal markers was measured using quantitative RT‐PCR. The Bar graphs show means ± SD, n = 3. *p < 0.05, **p < 0.01 and ***p < 0.001. (b) Staining of VIM using flow cytometry on OE19 and 031M cells in the same condition as (a). The dashed histograms represent the isotype control. (c) Transwell migration assays on OE19 and 031M cells in the same conditions as (a). Data shown in the graphs are corrected for no‐attractant controls (medium without FCS), shown are technical duplicates of two individual experiments. p‐Values were determined by two‐way ANOVA and Tukey's multiple comparisons correction. The p‐values shown are compared to the control condition. The one‐phase exponential curves were plotted, including the SD. [Color figure can be viewed at wileyonlinelibrary.com]
High TGF‐β serum levels after chemoradiation correlate with FDG‐avid metastatic disease
As chemoradiation‐induced TGF‐β secretion is responsible for EMT and enhanced migration of EAC cells, we reasoned that this could explain metastatic disease in EAC patients and we therefore assessed the dynamics of TGF‐β serum levels in EAC patients after chemoradiation in relation to PFS and disease activity beyond the primary tumor. Using ELISA, the mean TGF‐β serum level before start of therapy was 39.97 pg/mL. Patients with free TGF‐β serum levels before the start of therapy that were higher than 22.75 pg/mL, as determined using an established method to determine cutoff points in molecular data,17 had a significantly worse PFS compared to patients with serum levels lower than 22.75 pg/mL, with a 2‐yr PFS of 50% in patients with high serum TGF‐β and 83% in patients with low TGF‐β serum levels (Fig. 6 a). TGF‐β serum levels did not correlate with T or N stage as determined by endoscopic ultrasound (Figs. S3 a and S3 c) or after resection (Figs. S3 b and S3 d), nor with endoscopic longitudinal tumor length (Fig. S3 e), suggesting that it is not a marker for tumor load. To assess whether TGF‐β correlated with metastatic disease, a large cohort of EAC patients that had received various (neo)adjuvant treatment regimens was assessed. This revealed that TGF‐β serum levels of patients in which blood was collected at the time of metastatic disease was significantly higher compared to patients with nonmetastatic disease (45.73 ± 2.82 vs. 36.25 ± 3.85 pg/mL; Fig. 6 b). Subsequently, in patients where free TGF‐β serum levels were determined before (baseline) and directly after (post CR) treatment with the CROSS regimen, the dynamics of serum TGF‐β after chemoradiation was determined using the delta TGF‐β serum level (post CR—baseline). This revealed that approximately one third of the patients had pathological FDG uptake elsewhere (i.e., structures other than the primary tumor, mainly lymph nodes) at the post‐chemoradiation PET scan, and maintained a significantly higher serum TGF‐β level (i.e., smaller ΔTGF‐β) after the CROSS regimen (Figs. 6 c and 6e) compared to patients with no FDG uptake elsewhere (Figs. 6 c and 6d). Altogether, these data imply that relatively high TGF‐β serum levels after chemoradiation predict advanced disease and that monitoring TGF‐β serum level in EAC patients receiving the CROSS regimen could identify those patients likely to benefit from TGF‐β inhibition.
Figure 6.
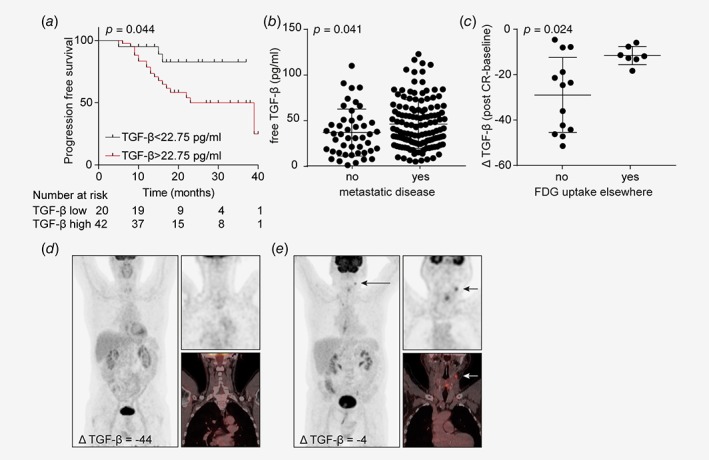
High TGF‐β serum levels after chemoradiation correlate with FDG‐avid metastatic disease. (a) PFS status of EAC patients before start of therapy using a TGF‐β serum level cutoff at 22.75 pg/mL as determined using the cutoff finder (n = 63). (b) TGF‐β serum levels of EAC patients with various (neo)adjuvant treatments measured in serum samples at the time of metastatic or nonmetastatic disease (n = 175). (c) ΔTGF‐β serum level (post CR—baseline) was determined after chemoradiation in patients with or without FDG uptake in structures other than the primary tumor on post chemoradiation PET scan (n = 20). Statistical significance was evaluated using Mann‐Whitney U test. The dot plots show mean ± SD. (d) Post‐chemoradiation total body 18F‐FDG‐PET scan and fused PET‐CT image of a patient with no FDG uptake in structures other than the primary tumor with ΔTGF‐β serum level of −44. (e) Patient with FDG uptake in a new lymph node, which did not show up on the pretreatment scan, with ΔTGF‐β serum level of −4. Arrow indicates metastatic disease with pathological FDG uptake in upper jugular lymph node at level II. [Color figure can be viewed at wileyonlinelibrary.com]
Discussion
This is the first study to identify a targetable resistance mechanism against the most relevant neoadjuvant treatment currently in use against EAC. The development of therapy resistance is a major problem in the treatment of cancer and it is of great importance to identify the resistance mechanisms that are at play in different tumor types and therapies. Several resistance mechanisms have already been identified in EAC, in which resistance toward 5‐fluorouracil is known to be mediated by miR‐221 via modulation of Wnt/βcatenin‐EMT pathways, and resistance toward cisplatin is mediated by overexpression of AXL and blocking apoptosis in EAC cells.18, 19 We revealed that resistance of EAC cells toward chemoradiation is mediated via EMT and increased stemness. Previous studies have shown that EMT is a critical regulator for acquiring and maintaining a subset of cells within the tumor, the cancer stem cell population.20 Indeed, cancer stem cells and cells that have undergone EMT are closely related in molecular and phenotypic characteristics. Cancer stem cells have increased resistance toward chemoradiation therapy by demonstrating increased anti‐apoptotic signaling, aberrant DNA repair and efficient drug efflux pump systems.21, 22 In other tumor types such as breast, lung and pancreatic cancer cells that have undergone EMT are also found to be more therapy resistant.23, 24, 25, 26
EMT can be induced by a variety of growth and differentiation factors. Of these, the TGF family is arguably best characterized.27, 28 Recently, we have shown that TGF‐β plays an important role in the induction of EMT in EAC cells,9 and we aimed to elucidate whether TGF‐β could also drive chemoradiation‐induced EMT in EAC. Our finding that EAC cells could undergo EMT via autocrine instruction by TGF‐β is supported by studies in EAC showing that enhanced TGF‐β expression is associated with advanced disease, poor survival and radioresistance.29, 30 Several potential mechanisms exist to explain the production of active TGF‐β by EAC cells in response to chemoradiation. For instance, numerous factors are known to activate latent TGF‐β, including reactive oxygen species.31 Studies have described the generation of reactive oxygen species in tumor cells by treatment with either paclitaxel, carboplatin or radiotherapy, and this could explain the induction of active TGF‐β after this combination regimen.32, 33, 34 TGF‐β production could also be regulated by changes in microRNA expression. Several microRNAs have been shown to regulate TGF‐β synthesis and various types of treatments or environmental changes have been described to affect microRNA expression.35, 36, 37 Moreover, radiation‐induced TGF‐β signaling is an often described phenomenon and it is postulated that TGF‐β is produced to activate surrounding fibroblasts and initiate radiation‐induced fibrosis via Smad3.38, 39
Previous reports have described that interference with TGF‐β signaling by blocking its receptor can reverse EMT in cultures of various tumor types.27 We found that the reversal of EMT in EAC cells could not be achieved by short‐term abstinence from chemoradiation, suggesting that a drug holiday (i.e., intermittent chemoradiation) is not sufficient to prevent chemoradiation‐induced EMT. The addition of the TGF‐β neutralizing antibody fresolimumab during the second week of chemoradiation treatment was however able to fully abolish EMT in EAC cells. This is of direct clinical relevance, as none of the previously published mechanisms of treatment resistance had direct potential for therapeutic intervention. Of particular interest are the observed effects of TGF‐β inhibition on migratory capacity, which completely returned to baseline levels. This suggests that the most important reason of treatment failure of the CROSS regimen—that is, the development of distant metastases4—could potentially be counteracted.
Previous studies have demonstrated that serum TGF‐β to associate with advanced stages, positive lymph nodes and poorer survival in various cancers.40, 41, 42, 43, 44 Interestingly, we found considerable heterogeneity between EAC tumor types regarding TGF‐β‐induced EMT in response to chemoradiation. Inter‐tumor heterogeneity is a well‐known phenomenon that has urged the classification of cancer in molecular subtypes. For gastroesophageal carcinoma, this has recently been published by The Cancer Genome Atlas Research Network.45, 46 The identification of different subtypes could help in finding the most appropriate treatment strategies for each patient. Although chemoradiation is a very effective therapy in EAC patients by prolonging survival from 24 to 49 months, approximately one third of patients eventually develops recurrence.4 Our findings suggest that simple monitoring of TGF‐β serum levels during chemoradiation could already improve treatment efficacy. By identifying the one third of patients that keep similar levels of circulating TGF‐β during chemoradiation and treating these patients with TGF‐β signaling inhibition, the risk of developing progressive disease after chemoradiation could potentially be counteracted. Given the fact that several trials are currently investigating the potential of TGF‐β signaling inhibitors for oncological indications,47, 48, 49 targeting TGF‐β during neoadjuvant chemoradiation therapy in these patients holds great promise in preventing therapy resistance and formation of distant metastases in EAC.
Author Contributions
Conception and design of the study: Steins A, Ebbing EA, Bijlsma MF, van Laarhoven HWM; Generation, collection, assembly, analysis, and/or interpretation of data: Steins A, Ebbing EA, Creemers A, van der Zalm AP, Jibodh RA, Waasdorp C, Meijer SL, van Delden O, Krishnadath KK, Bennink RJ, Medema JP, Bijlsma MF, van Laarhoven HWM; Drafting or revision of the manuscript: Steins A, Ebbing EA, Bijlsma MF, van Laarhoven HWM; Approval of the final version of the manuscript: All authors.
Supporting information
Figure S1: The propensity of chemoradiation‐induced EMT is not related to cell lines established from metastasis or primary tumor. (A) 081R and 037M cells were either left untreated or subjected to a 14 days chemoradiation scheme and morphology was assessed by phase‐contrast microscopy. Scale bar: 200 μm. (B) 081R and 037M cells in the same conditions as for panel A, and intracellular mesenchymal markers VIM and ZEB1 were assessed using flow cytometry. (D) 081R and 037M cells in the same conditions as for panel A, and gene expression of the indicated mesenchymal and cancer stem cell markers was determined using quantitative RT‐PCR. The bar graphs show means ± SD, n = 2. *P < 0.05, **P < 0.01.
Figure S2: Differences in genetic background cannot explain the heterogeneous EMT response to chemoradiation. Heatmap showing the mutation pattern of the 25 most significantly recurrent mutated genes. Genes are represented in the rows and EAC cultures are represented in the columns. Pathogenic mutations include; substitution/missense, truncation, in frame indel. Non‐pathogenic mutations include (non)synonymous mutations.
Figure S3: TGF‐β serum levels are not correlated with tumor load. (A) T‐stage as determined by EUS or CT before start of therapy. (B) T‐stage as determined in primary tissue after resection. (C) N‐stage as determined by EUS or CT before start of therapy. (D) N‐stage as determined in primary tissue after resection. For all panels, n = 63 and statistical significance was evaluated using one‐way ANOVA corrected for multiple comparisons. (E) Endoscopic longitudinal tumor length in cm as determined by EUS before start of therapy. N = 60 and statistical significance was evaluated using linear regression analysis.
Supplementary Table 1: Patient characteristics of primary cultures
Supplementary Table 2: List of used primers for qRT‐PCR
Supplementary Table 3: Patient characteristics cohort 1, correlated to TGF‐β serum level before start chemoradiation
Supplementary Table 4: Patient characteristics cohort 2, correlated to TGF‐β serum level before start chemoradiation
Supplementary Table 5: Patient characteristics metastatic and non‐metastatic disease
Acknowledgements
This work was supported by a KWF Dutch Cancer Society project grant (UVA 2012‐5607 and 10992) to M.F.B. and H.W.M.L., Oncode, and a personal research grant of the Dutch Research Council for H.W.M.L. (016.096.010).
Conflict of interest: The authors declare no conflict of interest. H.W.M.L. has acted as a consultant or had an advisory role for BMS, Eli Lilly and Company, and Nordic Pharma Group/Taiho, and has received unrestricted research grants from Bayer Schering Pharma AG, BMS, Celgene, The Janssen Pharmaceutical Companies of Johnson & Johnson, Eli Lilly and Company, Nordic Pharma Group, Philips, Roche Pharmaceuticals. M.F.B has received research funding from Celgene. None of these were involved in drafting of the manuscript.
References
- 1. Foo J, Michor F. Evolution of acquired resistance to anti‐cancer therapy. J Theor Biol 2014;355:10–20. [DOI] [PMC free article] [PubMed] [Google Scholar]
- 2. Shapiro J, van Lanschot JJB, Hulshof MCCM, et al. Neoadjuvant chemoradiotherapy plus surgery versus surgery alone for oesophageal or junctional cancer (CROSS): long‐term results of a randomised controlled trial. Lancet Oncol 2015;16:1090–8. [DOI] [PubMed] [Google Scholar]
- 3. van Hagen P, Hulshof MCCM, van Lanschot JJB, et al. Preoperative chemoradiotherapy for esophageal or junctional cancer. N Engl J Med 2012;366:2074–84. [DOI] [PubMed] [Google Scholar]
- 4. Oppedijk V, van der Gaast A, van Lanschot JJB, et al. Patterns of recurrence after surgery alone versus preoperative chemoradiotherapy and surgery in the CROSS trials. J Clin Oncol 2014;32:385–91. [DOI] [PubMed] [Google Scholar]
- 5. Lynam‐Lennon N, Heavey S, Sommerville G, et al. MicroRNA‐17 is downregulated in esophageal adenocarcinoma cancer stem‐like cells and promotes a radioresistant phenotype. Oncotarget 2016;8:11400–13. [DOI] [PMC free article] [PubMed] [Google Scholar]
- 6. Wang Y, Zhao Y, Herbst A, et al. miR‐221 mediates chemoresistance of esophageal adenocarcinoma by direct targeting of DKK2 expression. Ann Surg 2016;264:804–14. [DOI] [PubMed] [Google Scholar]
- 7. Lynam‐Lennon N, Bibby BA, Mongan AM, et al. Low miR‐187 expression promotes resistance to chemoradiation therapy in vitro and correlates with treatment failure in patients with esophageal adenocarcinoma. Mol Med 2016;22:388–97. [DOI] [PMC free article] [PubMed] [Google Scholar]
- 8. Bibby BAS, Reynolds JV, Maher SG. MicroRNA‐330‐5p as a putative modulator of neoadjuvant chemoradiotherapy sensitivity in oesophageal adenocarcinoma. PLoS One 2015;10:e0134180. [DOI] [PMC free article] [PubMed] [Google Scholar]
- 9. Ebbing EA, Steins A, Fessler E, et al. Esophageal adenocarcinoma cells and xenograft tumors exposed to Erb‐b2 receptor tyrosine kinase 2 and 3 inhibitors activate transforming growth factor beta signaling, which induces epithelial to mesenchymal transition. Gastroenterology 2017;153:63–76.e14. [DOI] [PubMed] [Google Scholar]
- 10. Ghahhari NM, Babashah S. Interplay between microRNAs and WNT/β‐catenin signalling pathway regulates epithelial‐mesenchymal transition in cancer. Eur J Cancer 2015;51:1638–49. [DOI] [PubMed] [Google Scholar]
- 11. Mani SA, Guo W, Liao M‐J, et al. The epithelial‐mesenchymal transition generates cells with properties of stem cells. Cell 2008;133:704–15. [DOI] [PMC free article] [PubMed] [Google Scholar]
- 12. Chaffer CL, San Juan BP, Lim E, et al. EMT, cell plasticity and metastasis. Cancer Metastasis Rev 2016;35:645–54. [DOI] [PubMed] [Google Scholar]
- 13. Damhofer H, Ebbing EA, Steins A, et al. Establishment of patient‐derived xenograft models and cell lines for malignancies of the upper gastrointestinal tract. J Transl Med 2015;13:115. [DOI] [PMC free article] [PubMed] [Google Scholar]
- 14. Ebbing EA, Medema JP, Damhofer H, et al. ADAM10‐mediated release of heregulin confers resistance to trastuzumab by activating HER3. Oncotarget 2016;7:10243–54. [DOI] [PMC free article] [PubMed] [Google Scholar]
- 15. Tate JG, Bamford S, Jubb HC, et al. COSMIC: the catalogue of somatic mutations in cancer. Nucleic Acids Res 2019;47:D941–7. [DOI] [PMC free article] [PubMed] [Google Scholar]
- 16. Anderegg MCJ, de Groof EJ, Gisbertz SS, et al. 18F‐FDG PET‐CT after neoadjuvant chemoradiotherapy in esophageal cancer patients to optimize surgical decision making. PLoS One 2015;10:e0133690. [DOI] [PMC free article] [PubMed] [Google Scholar]
- 17. Budczies J, Klauschen F, Sinn BV, et al. Cutoff finder: a comprehensive and straightforward web application enabling rapid biomarker cutoff optimization. PLoS One 2012;7:e51862. [DOI] [PMC free article] [PubMed] [Google Scholar]
- 18. Hong J, Peng D, Chen Z, et al. ABL regulation by AXL promotes cisplatin resistance in esophageal cancer. Cancer Res 2013;73:331–40. [DOI] [PMC free article] [PubMed] [Google Scholar]
- 19. Wang S, Zhang H, Cheng L, et al. Analysis of the cytotoxic activity of carboplatin and gemcitabine combination. Anticancer Res 2010;30:4573–8. [PMC free article] [PubMed] [Google Scholar]
- 20. Zhou P, Li B, Liu F, et al. The epithelial to mesenchymal transition (EMT) and cancer stem cells: implication for treatment resistance in pancreatic cancer. Mol Cancer 2017;16:52. [DOI] [PMC free article] [PubMed] [Google Scholar]
- 21. Morrison R, Schleicher SM, Sun Y, et al. Targeting the mechanisms of resistance to chemotherapy and radiotherapy with the cancer stem cell hypothesis. J Oncol 2011;2011:941876. [DOI] [PMC free article] [PubMed] [Google Scholar]
- 22. Ishii H, Iwatsuki M, Ieta K, et al. Cancer stem cells and chemoradiation resistance. Cancer Sci 2008;99:1871–7. [DOI] [PMC free article] [PubMed] [Google Scholar]
- 23. Fischer KR, Durrans A, Lee S, et al. Epithelial‐to‐mesenchymal transition is not required for lung metastasis but contributes to chemoresistance. Nature 2015;527:472–6. [DOI] [PMC free article] [PubMed] [Google Scholar]
- 24. Zheng X, Carstens JL, Kim J, et al. Epithelial‐to‐mesenchymal transition is dispensable for metastasis but induces chemoresistance in pancreatic cancer. Nature 2015;527:525–30. [DOI] [PMC free article] [PubMed] [Google Scholar]
- 25. Du Z, Qin R, Wei C, et al. Pancreatic cancer cells resistant to chemoradiotherapy rich in “stem‐cell‐like” tumor cells. Dig Dis Sci 2011;56:741–50. [DOI] [PubMed] [Google Scholar]
- 26. Creighton CJ, Li X, Landis M, et al. Residual breast cancers after conventional therapy display mesenchymal as well as tumor‐initiating features. Proc Natl Acad Sci 2009;106:13820–5. [DOI] [PMC free article] [PubMed] [Google Scholar]
- 27. Xu J, Lamouille S, Derynck R. TGF‐beta‐induced epithelial to mesenchymal transition. Cell Res 2009;19:156–72. [DOI] [PMC free article] [PubMed] [Google Scholar]
- 28. Massagué J. TGFβ in cancer. Cell 2008;134:215–30. [DOI] [PMC free article] [PubMed] [Google Scholar]
- 29. Kim AH, Lebman DA, Dietz CM, et al. Transforming growth factor‐beta is an endogenous radioresistance factor in the esophageal adenocarcinoma cell line OE‐33. Int J Oncol 2003;23:1593–9. [PubMed] [Google Scholar]
- 30. von Rahden BHA, Stein HJ, Feith M, et al. Overexpression ofTGF‐β1 in esophageal (Barrett's) adenocarcinoma is associated with advanced stage of disease and poor prognosis. Mol Carcinog 2006;45:786–94. [DOI] [PubMed] [Google Scholar]
- 31. Liu R‐M, Desai LP. Reciprocal regulation of TGF‐β and reactive oxygen species: a perverse cycle for fibrosis. Redox Biol 2015;6:565–77. [DOI] [PMC free article] [PubMed] [Google Scholar]
- 32. Meshkini A, Yazdanparast R. Involvement of oxidative stress in taxol‐induced apoptosis in chronic myelogenous leukemia K562 cells. Exp Toxicol Pathol 2012;64:357–65. [DOI] [PubMed] [Google Scholar]
- 33. He P, Ge R, Mao W, et al. Oxidative stress induced by carboplatin promotes apoptosis and inhibits migration of HN‐3 cells. Oncol Lett 2018;16:7131–8. [DOI] [PMC free article] [PubMed] [Google Scholar]
- 34. Holley AK, Miao L, St Clair DK, et al. Redox‐modulated phenomena and radiation therapy: the central role of superoxide dismutases. Antioxid Redox Signal 2014;20:1567–89. [DOI] [PMC free article] [PubMed] [Google Scholar]
- 35. Martin J, Jenkins RH, Bennagi R, et al. Post‐transcriptional regulation of transforming growth factor beta‐1 by MicroRNA‐744. PLoS One 2011;6:e25044. [DOI] [PMC free article] [PubMed] [Google Scholar]
- 36. Shan H, Zhang Y, Lu Y, et al. Downregulation of miR‐133 and miR‐590 contributes to nicotine‐induced atrial remodelling in canines. Cardiovasc Res 2009;83:465–72. [DOI] [PubMed] [Google Scholar]
- 37. Gulyaeva LF, Kushlinskiy NE. Regulatory mechanisms of microRNA expression. J Transl Med 2016;14:143. [DOI] [PMC free article] [PubMed] [Google Scholar]
- 38. Dancea HC, Shareef MM, Ahmed MM. Role of radiation‐induced TGF‐beta signaling in cancer therapy. Mol Cell Pharmacol 2009;1:44–56. [DOI] [PMC free article] [PubMed] [Google Scholar]
- 39. Martin M, Lefaix J‐L, Delanian S. TGF‐β1 and radiation fibrosis: a master switch and a specific therapeutic target? Int J Radiat Oncol 2000;47:277–90. [DOI] [PubMed] [Google Scholar]
- 40. Hou Y‐L, Chen H, Dong Z‐H, et al. Clinical significance of serum transforming growth factor‐β1 in lung cancer. Cancer Epidemiol 2013;37:750–3. [DOI] [PubMed] [Google Scholar]
- 41. Shim KS, Kim KH, Han WS, et al. Elevated serum levels of transforming growth factor‐β1 in patients with colorectal carcinoma. Cancer 1999;85:554–61. [DOI] [PubMed] [Google Scholar]
- 42. Tas F, Karabulut S, Serilmez M, et al. Clinical significance of serum transforming growth factor‐beta 1 (TGF‐β1) levels in patients with epithelial ovarian cancer. Tumor Biol 2014;35:3611–6. [DOI] [PubMed] [Google Scholar]
- 43. Papadopoulou E, Anagnostopoulos K, Tripsianis G, et al. Evaluation of predictive and prognostic significance of serum TGF‐beta1 levels in breast cancer according to HER‐2 codon 655 polymorphism. Neoplasma 2008;55:229–38. [PubMed] [Google Scholar]
- 44. Lin T‐H, Shao Y‐Y, Chan S‐Y, et al. High serum transforming growth factor‐β1 levels predict outcome in hepatocellular carcinoma patients treated with sorafenib. Clin Cancer Res 2015;21:3678–84. [DOI] [PubMed] [Google Scholar]
- 45. Visvader JE. Cells of origin in cancer. Nature 2011;469:314–22. [DOI] [PubMed] [Google Scholar]
- 46. Network TCGAR . Integrated genomic characterization of oesophageal carcinoma. Nature 2017;541:169–75. [DOI] [PMC free article] [PubMed] [Google Scholar]
- 47. Neuzillet C, Tijeras‐Raballand A, Cohen R, et al. Targeting the TGFβ pathway for cancer therapy. Pharmacol Ther 2015;147:22–31. [DOI] [PubMed] [Google Scholar]
- 48. Morris JC, Tan AR, Olencki TE, et al. Phase I study of GC1008 (Fresolimumab): a human anti‐transforming growth factor‐beta (TGFβ) monoclonal antibody in patients with advanced malignant melanoma or renal cell carcinoma. PLoS One 2014;9:e90353. [DOI] [PMC free article] [PubMed] [Google Scholar]
- 49. Buijs JT, Stayrook KR, Guise TA. The role of TGF‐β in bone metastasis: novel therapeutic perspectives. Bonekey Rep 2012;1:1–10. [DOI] [PMC free article] [PubMed] [Google Scholar]
Associated Data
This section collects any data citations, data availability statements, or supplementary materials included in this article.
Supplementary Materials
Figure S1: The propensity of chemoradiation‐induced EMT is not related to cell lines established from metastasis or primary tumor. (A) 081R and 037M cells were either left untreated or subjected to a 14 days chemoradiation scheme and morphology was assessed by phase‐contrast microscopy. Scale bar: 200 μm. (B) 081R and 037M cells in the same conditions as for panel A, and intracellular mesenchymal markers VIM and ZEB1 were assessed using flow cytometry. (D) 081R and 037M cells in the same conditions as for panel A, and gene expression of the indicated mesenchymal and cancer stem cell markers was determined using quantitative RT‐PCR. The bar graphs show means ± SD, n = 2. *P < 0.05, **P < 0.01.
Figure S2: Differences in genetic background cannot explain the heterogeneous EMT response to chemoradiation. Heatmap showing the mutation pattern of the 25 most significantly recurrent mutated genes. Genes are represented in the rows and EAC cultures are represented in the columns. Pathogenic mutations include; substitution/missense, truncation, in frame indel. Non‐pathogenic mutations include (non)synonymous mutations.
Figure S3: TGF‐β serum levels are not correlated with tumor load. (A) T‐stage as determined by EUS or CT before start of therapy. (B) T‐stage as determined in primary tissue after resection. (C) N‐stage as determined by EUS or CT before start of therapy. (D) N‐stage as determined in primary tissue after resection. For all panels, n = 63 and statistical significance was evaluated using one‐way ANOVA corrected for multiple comparisons. (E) Endoscopic longitudinal tumor length in cm as determined by EUS before start of therapy. N = 60 and statistical significance was evaluated using linear regression analysis.
Supplementary Table 1: Patient characteristics of primary cultures
Supplementary Table 2: List of used primers for qRT‐PCR
Supplementary Table 3: Patient characteristics cohort 1, correlated to TGF‐β serum level before start chemoradiation
Supplementary Table 4: Patient characteristics cohort 2, correlated to TGF‐β serum level before start chemoradiation
Supplementary Table 5: Patient characteristics metastatic and non‐metastatic disease