

Abstract
The assessment of soft tissue stiffness is important to evaluate many neuromusculoskeletal conditions. Several tools have been proposed for the assessment of stiffness, but ultrasonography appears to be most practical. The reflection of ultrasound waves as it travels through tissue enables assessment of tissue echogenicity, which is influenced by the characteristics of the sound wave as well as the characteristics of the tissue through which it passes, such as the amount of fat and fibrous tissue. However, tissue stiffness is not directly proportional to its echogenicity. Hence evaluation of echogenicity, as a stand-alone technique, is inadequate to describe its mechanical properties. The aim of this manuscript is to present a method of combining echogenicity evaluation by ultrasound and stiffness evaluation by palpation to better describe the mechanical properties of muscle using a stiffness-echogenicity matrix.
Key Words: stiffness, echogenicity, ultrasound, elastography
Ethical Publication Statement
We confirm that we have read the Journal’s position on issues involved in ethical publication and affirm that this report is consistent with those guidelines.
Defining a specific treatment plan in musculoskeletal medicine requires a clear understanding of the mechanics of the underlying tissue. Ultrasonography is a useful tool to visualize muscle tissue, and its composition can be inferred by assessing its echogenicity.1,2 Echogenicity denotes the brightness of an image caused by the reflection of soundwaves and is influenced by sound beam characteristics and tissue density.3 However, most ultrasound machines cannot assess the mechanical properties of muscle such as its stiffness, i.e., the ability of the muscle to be compressed, elongated, stretched or manipulated, which is essential for normal movement.
Dissociation between echogenicity and stiffness
Healthy muscles look dark with sharp bright lines on ultrasonography. The dark signal is hypoechoic and the bright lines represent hyperechoic signal from collagen fibers in the endomysium and perimysium. The echogenicity of muscle tissue can describe alterations in the structure of muscles with neuromuscular disease. For example, Pillen et al. found a significant correlation between hyperechogenicity by ultrasonography and interstitial fibrosis in muscle biopsies from dogs.4 However, data from older adults and children with neuromuscular disease (such as muscular dystrophy, myopathy and motor neuron disorders), found hyperechogenicity to be more strongly associated with intra- and intermuscular fat on muscle biopsy.5 Fat is typically characterized by low stiffness in comparison to fibrotic tissue which shows high stiffness. Thus, echogenicity alone cannot define the mechanical properties of muscle. Fat can show variable echogenicity depending on the number of septa within it,6 and on its state of inflammation. Chakraborty et al.7 reported that hyperechoic fat results from vasodilatation and edema extending from an adjacent source of infection or inflammation.8,9 However, inflamed hyperechoic fat is not necessarily stiffer. On the other hand, trigger points (TrPs) are defined as stiff nodules in a taut band of muscle that present a hypoechoic signal.10,11 These findings are also not in line with the common view of stiff areas as being composed of fibrotic hyperechoic tissue. Recent research suggests that the mechanical properties of the extracellular matrix (ECM) may be altered by changing its viscosity.12 Increased ECM viscosity may lead to “densification”,13 which increases tissue stiffness without increasing its echogenicity. Arts et al. have shown that elderly populations demonstrate higher muscle echogenicity when compared with young populations.14 Older men show an inverse association between muscle echogenicity and strength.15 Similarly, an inverse association is noted between muscle echogenicity and stiffness on palpation, where high echogenicity did not correspond with high stiffness, but instead was associated with soft, flaccid sarcopenic muscle in the elderly.16-20 It has been suggested that structural and biochemical changes in muscle ECM may contribute to age-related loss of muscle function.21 A recent experimental study in animals observed increased accumulation of interstitial connective tissue and thickened basal lamina in the skeletal muscle of older animals compared with the muscles in young animals.22
In addition, during contraction, muscle stiffness increases in the young but does not change in the elderly, perhaps due to substitution of muscle fibers with non-contractile fibrous tissue. Consequently, surrogate measures of muscle stiffness are needed along with echogenicity to understand muscle dysfunction.
Elastography in clinical practice
Elastography involves the measurement of local tissue deformation in response to applied mechanical stress.23 The way in which the tissue deforms provides information about the tissue’s mechanical properties. Elastographic techniques can be categorized based on how the stress is applied and how the deformation is measured. For example, stress application can be by direct compression using the ultrasound probe,23 or via ultrasonic radiation force,24,25 while deformation can be evaluated via ultrasound imaging.26 In quasi-static ultrasound elastography, the deformation is induced by manually pressing on the anatomy with the transducer and assessing its deformation or strain using B-mode ultrasound. This is also known as strain elastography (SE), which is a qualitative technique to relate stiffness of a specific area or lesion to that of the background tissue (strain ratio). In contrast, quantitative elastography is based on shear wave speed, and is known as shear wave elastography (SWE).27,28 However, both SE and SWE are highly user dependent, are affected by technique such as tissue pre-compression, and have a steep learning curve. The accuracy of SE can differ for superficial and deep tissues due to variable displacement of tissues at different depths.29 The accuracy of SWE can be reduced if the B-mode image shows extremely low signal (anechoic), leading to unsuccessful shear wave detection. SWE is also limited in deeper tissues due to the attenuation of the acoustic radiation force impulse (ARFI pulse). It has been suggested that shear elastic modulus measurements show large temporal variability and poor inter-session reliability because the shear wave has to pass through highly heterogeneous tissue.30
A practical solution: the stiffness-echogenicity matrix
We propose that combining echogenicity evaluation by ultrasonography along with evaluation of stiffness by manual palpation can better describe the mechanical properties of muscle in a clinical setting. We present a stiffness rating scale to assess muscle stiffness by palpation to be used in combination with echogenicity assessment using Heckmatt’s rating scale.31
Heckmatt’s rating scale
Muscle echogenicity can be graded by ultrasound using Heckmatt’s rating scale, where:
Grade 1: Normal.
Grade 2: Increase in muscle echo while bone echo is still distinct.
Grade 3: Marked increase in muscle echo and reduced bone echo.
Grade 4: Very strong muscle echo and complete loss of bone echo.
Fig 1.
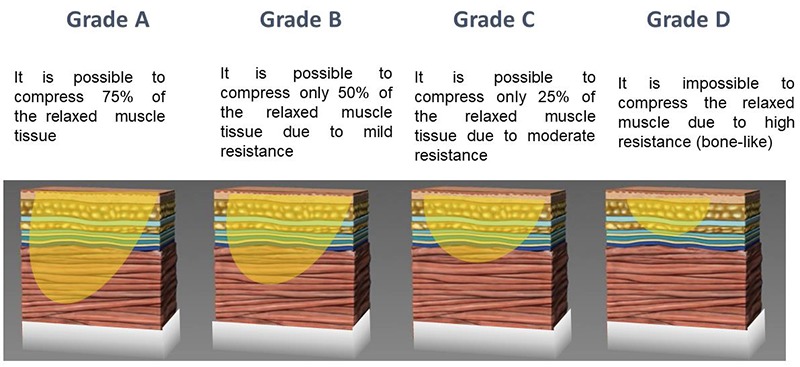
The stiffness rating scale assesses the compressibility of the underlying muscle by palpation to estimate the resistance of the tissue to displacement
Stiffness rating scale
The stiffness rating scale assesses the compressibility of the underlying muscle by palpation to estimate the resistance of the tissue to displacement (Figure 1). Tissue resistance may be graded as follows:
Grade A: The muscle feels soft to the palpating thumb or index finger. It is possible to compress 75% of the relaxed muscle tissue.
Grade B: It is possible to compress only 50% of the relaxed muscle tissue due to mild resistance.
Grade C: It is possible to compress only 25% of the relaxed muscle tissue due to moderate resistance.
Grade D: It is impossible to compress the relaxed muscle tissue due to high resistance (bone-like).
Figure 2 presents a stiffness-echogenicity matrix (SEM) which combines stiffness rating on the y-axis with echogenicity rating on the x-axis. Note the four major quadrants of the matrix which represent a wide spectrum of conditions seen in clinical practice. Figure 3 represents individual cells in the matrix. The combined stiffness and echogenicity grades range from 1A (acutely denervated but otherwise normal muscle on ultrasonography) to 4D (non-compressible stiff muscle with fibrosis).
Clinical utility of the stiffness-echogenicity matrix
Common clinical conditions can show variable stiffness and echogenicity and require a practical method for evaluation in ambulatory clinical settings. The purpose of the SEM is to better characterize muscle in clinical practice. Examples of clinical conditions that correspond to the various cells of the SEM are described below.
The upper left quadrant of the SEM represents cells that show mild variations in echogenicity, but when combined with the rating of muscle stiffness may permit differentiation of clinically important conditions. Healthy muscle appears dark with sharp bright lines,32 which represents the connective tissue rich perimysium responsible for mechanical properties of the the muscle. On palpation, healthy muscle encounters minimal resistance due to normal muscle tone and presents as grade 2B on the SEM. In acute denervation, characteristic echoes of fascial planes appear less intense,33 making the muscle slightly hypoechoic. On palpation, the examiner may encounter little resistance and may easily palpate the surface of the bone through the muscle, presenting as grade 1A on the SEM. In contrast, a hypertrophic muscle has thicker muscle fibers relative to connective tissue, hence it is likely to be slightly hypoechogenic compared to normal particularly in young healthy males, and present as grade 1B on the SEM. However, mildly atrophic muscle, for example due to disuse, and may have smaller muscle size but may not be stiff, presenting as grade 2A on the SEM.
Fig 2.
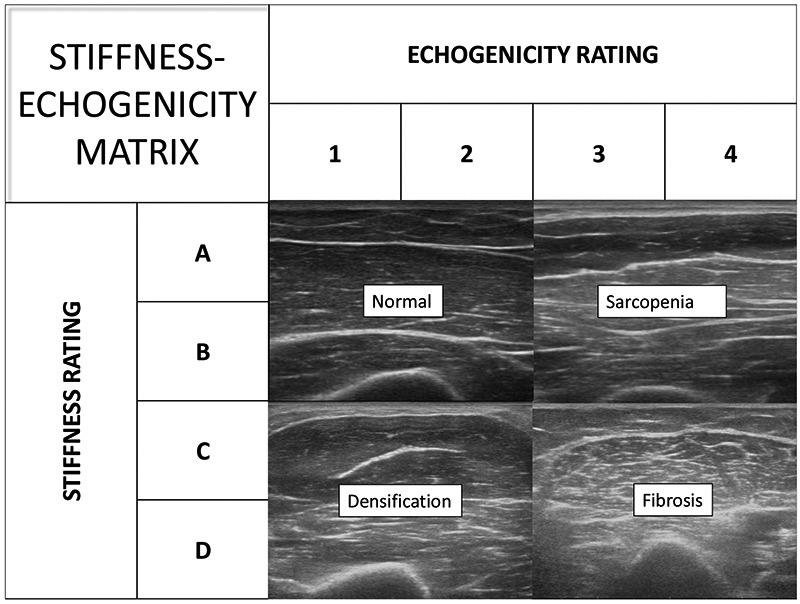
Presents a stiffness-echogenicity matrix (SEM) which combines stiffness rating on the y-axis with echogenicity rating on the x-axis. Each quadrant of the matrix can represent a wide spectrum of conditions seen in clinical practice.
Fig 3.
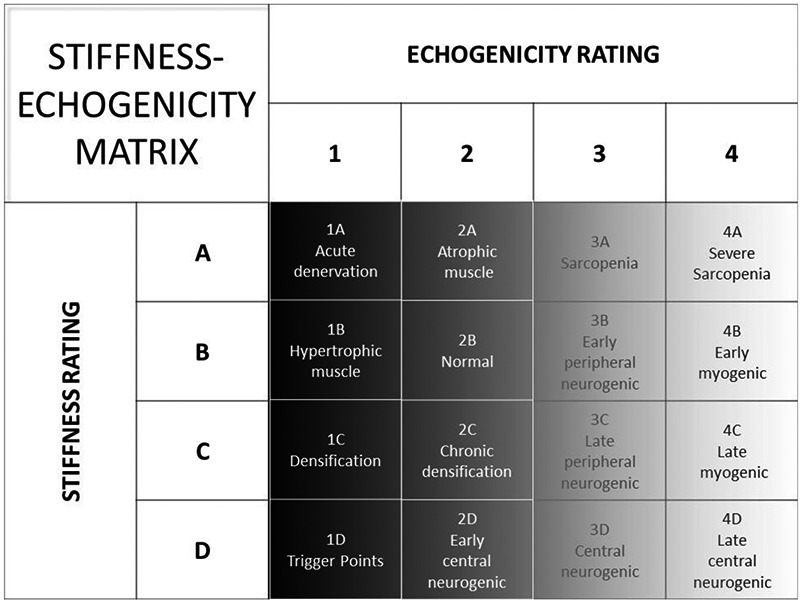
The cells in the SEM represent clinical conditions that show various degrees of muscle stiffness and echogenicity. The color of each cell in the matrix reflects the echogenicity grey-scale.
The lower left quadrant of the stiffness-echogenicity matrix represents cells that show mild variations due to stiffness which is greater than that seen with normal muscle tone. Myofascial pain syndrome is characterized by the presence of trigger points. Travell defined a trigger point as a hyperirritable spot in skeletal muscle that is associated with a hypersensitive palpable nodule in a taut band.34 The evolution of a trigger point starts with a taut band, i.e. a stiff area of muscle;35-38 which shows greater than normal muscle tone. Such areas may be “densified” perhaps due to increased ECM viscosity from aggregation of high molecular weight semi-flexible chains of hyaluronan (macromolecular crowding).12 These areas may be hypoechogenic on ultrasonography, presenting as grade 1C on the SEM. As a trigger point evolves, discrete regions in the taut band become stiffer but remain hypoechogenic on ultrasonography,39-41 presenting as grade 1D on the SEM. A chronically stiff muscle can stimulate the deposition of connective tissue due to lack of movement, making the muscle slightly more echogenic, and presenting as grade 2C on the SEM. If a patient has a central neurogenic condition characterized by increased muscle tone, such as stroke or multiple sclerosis, the echogenicity may be preserved in the early stages, but the muscle can demonstrate increased stiffness, presenting as grade 2D on the SEM.
The upper right quadrant of the SEM represents changes in muscle that may be associated with weakness from various causes. Sarcopenia is the degenerative loss of skeletal muscle mass (0.5-1% loss per year after the age of 50),42 quality, and strength associated with aging. Sarcopenic muscles have more connective tissue compared to muscles in non-sarcopenic individuals,43 and may present as grade 3A on the SEM. Muscle ultrasound in elderly athletes and untrained men has shown that echo intensity is higher in untrained men,44 corresponding to age-related replacement of contractile tissue by other tissues, such as fat. In contrast, in severe sarcopenia and cachexia,45 the muscle echo intensity will be even higher, presenting as grade 4A on the SEM. Neurogenic and myogenic conditions can also produce muscle weakness. Peripheral neurogenic conditions may show normal or moderate increase in echogenicity,46 presenting as grade 3B on the SEM. On the other hand, myogenic conditions, such as muscular dystrophies and myositis, tend to show increased echogenicity compared to neurogenic conditions due to replacement of muscle tissue by fibrofatty tissue (muscle lipomatosis, but not muscle fibrosis).47,48 These changes set up multiple planes of sound reflection in the underlying muscle, and the diseased muscle becomes progressively more echogenic with loss of normal heterogeneity of healthy muscle and its supporting fibrous stroma, presenting as grade 4B on the SEM. The lower right quadrant of the SEM represents changes in muscle due to late stage diseases that show both weakness and increased stiffness as a result of immobility. Immobility alone can increase aggregation of hyaluronan in the ECM, which can increase its viscosity.49-51 Late peripheral neurogenic conditions may present as grade 3C on the SEM, whereas late myogenic conditions tend to show higher echogenicity, and may present as grade 4C. However, in central neurogenic disorders such stroke and multiple sclerosis, the degree of stiffness tends to be greater, while the echogenicity may be normal or slightly increased, presenting as grade 3D on the SEM. Gao et al.52 described a significant difference in muscle strain ratios in the affected muscles of patients with multiple sclerosis with Modified Ashworth Scale (MAS) score of 1 or higher. In patients with late central neurogenic conditions, such as those with severe spasticity, the combination of hyper-echogenicity and stiffness is well recognized,53,54 and may present as grade 4D. The hyper-echogenicity can result from gradual collagen deposition, which can result in contractures. The SEM can aid in distinguishing between viscous stiffness, which may be reversible for SEM grades 2D and 3D,51 and irreversible for grade 4D.
In conclusion, similar to elastography, the SEM may be limited in the evaluation of deeper muscles. Furthermore, both the assessment of echogenicity and stiffness are qualitative because it is not possible to compare echogenicity values obtained using different devices or expect that examiners will use the same amount of pressure duration palpation. Nevertheless, the stiffness-echogenicity matrix developed using palpation and simple B mode ultrasonography may provide a practical and inexpensive approach to screen muscles, assess disease progression and define an appropriate treatment plan. The next step would be to validate the clinical utility of the matrix in a diverse sample of patients.
Acknowledgments
The authors acknowledge feedback on the manuscript provided by Dr. Soo Kim.
List of acronyms
- ECM
Extracellular matrix
- MAS
Modified Ashworth Scale
- MS
Multiple Sclerosis
- SE
Strain elastography
- SEM
stiffness-echogenicity matrix
- SWE
Shear wave elastography
Funding Statement
Funding: No funding was received.
Contributor Information
Carmelo Pirri, Email: carmelop87@hotmail.it.
Raffaele De Caro, Email: raffaele.decaro@unipd.it.
Preeti Raghavan, Email: praghav3@jhmi.edu.
References
- 1.Pillen S, van Alfen N. Skeletal muscle ultrasound. Neurol Res 2011;33:1016-24. [DOI] [PubMed] [Google Scholar]
- 2.Correa-de-Araujo R, Harris-Love MO, Miljkovic I, et al. The need for standardized assessment of muscle quality in skeletal muscle function deficit and other aging-related muscle dysfunctions: A symposium report. Front Physiol 2017;8:1–19. [DOI] [PMC free article] [PubMed] [Google Scholar]
- 3.Iftekharuddin KM, Awwal AAS. Field Guide to Image Processing; SPIE Field Guides; SPIE Press: Bellingham, WA, USA, 2012. ISBN 978-0-8194-9021-6. [Google Scholar]
- 4.Pillen S, Tak RO, Zwarts MJ, et al. Skeletal muscle ultrasound: correlation between fibrous tissue and echo intensity. Ultrasound Med Biol 2009;35:443-6. [DOI] [PubMed] [Google Scholar]
- 5.Reimers K, Reimers CD, Wagner S, et al. Skeletal muscle sonography: a correlative study of echogenicity and morphology. J Ultrasound Med 1993. 12:73-7. [DOI] [PubMed] [Google Scholar]
- 6.Spencer GM, Rubens DJ, Roach DJ. Hypoechoic fat: a sonographic pitfall. Am J Roentgenol 1995;164:1277-80. [DOI] [PubMed] [Google Scholar]
- 7.Chakraborty AK, Olcott EW, Jeffrey BR. Hyperechoic Abdominal Fat: A Sentinel Sign of Inflammation. Ultrasound Q 2019;35:186-94. [DOI] [PubMed] [Google Scholar]
- 8.Rosón N, Garriga V, Cuadrado M, et al. Sonographic findings of mesenteric panniculitis: correlation with CT and literature review. J Clin Ultrasound 2006;34:169-76. [DOI] [PubMed] [Google Scholar]
- 9.Behan M, Kazam E. The echographic characteristics of fatty tissues and tumors. Radiology. 1978;129:143-51. [DOI] [PubMed] [Google Scholar]
- 10.Özçakar L, Ata AM, Kaymak B, et al. Ultrasound imaging for sarcopenia, spasticity and painful muscle syndromes. Curr Opin Support Palliat Care 2018;12:373-81. [DOI] [PubMed] [Google Scholar]
- 11.Sikdar S, Shah JP, Gilliams E, et al. Assessment of myofascial trigger points (MTrPs): a new application of ultrasound imaging and vibration sonoelastography. Conf Proc IEEE Eng Med Biol Soc 2008;2008:5585-8. [DOI] [PubMed] [Google Scholar]
- 12.Cowman MK, Schmidt TA, Raghavan P, Stecco A. Viscoelastic Properties of Hyaluronan in Physiological Conditions. F1000Res 2015;25:622. [DOI] [PMC free article] [PubMed] [Google Scholar]
- 13.Pavan PG, Stecco A, Stern R, Stecco C. Painful connections: densification versus fibrosis of fascia. Curr Pain Headache Rep 2014;18:441. [DOI] [PubMed] [Google Scholar]
- 14.Arts IM, Pillen S, Schelhaas HJ, et al. Normal values for quantitative muscle ultrasonography in adults. Muscle Nerve 2010;41:32-41. [DOI] [PubMed] [Google Scholar]
- 15.Heymsfield SB, Adamek M, Gonzalez MC, et al. Assessing skeletal muscle mass: historical overview and state of the art. J Cachexia Sarcopenia Muscle 2014;5:9-18. [DOI] [PMC free article] [PubMed] [Google Scholar]
- 16.Strasser EM, Draskovits T, Praschak M, et al. Association between ultrasound measurements of muscle thickness, pennation angle, echogenicity and skeletal muscle strength in the elderly. Age (Dordr) 2013;35:2377-88. [DOI] [PMC free article] [PubMed] [Google Scholar]
- 17.Chang KV, Wu WT, Huang KC, et al. Limb muscle quality and quantity in elderly adults with dynapenia but not sarcopenia: An ultrasound imaging study. Exp Gerontol 2018;108:54-61. [DOI] [PubMed] [Google Scholar]
- 18.Ismail C, Zabal J, Hernandez HJ, et al. Diagnostic ultrasound estimates of muscle mass and muscle quality discriminate between women with and without sarcopenia. Front Physiol 2015;29:302. [DOI] [PMC free article] [PubMed] [Google Scholar]
- 19.Can B, Kara M, Kara Ö, et al. The value of musculoskeletal ultrasound in geriatric care and rehabilitation. Int J Rehabil Res 2017;40:285-96. [DOI] [PubMed] [Google Scholar]
- 20.Watanabe Y, Yamada Y, Fukumoto Y, et al. Echo intensity obtained from ultrasonography images reflecting muscle strength in elderly men. Clin Interv Aging 2013;8:993-8. doi:10.2147/CIA. S47263. Epub 2013 Jul 25. [DOI] [PMC free article] [PubMed] [Google Scholar]
- 21.Kragstrup TW, Kjaer M, Mackey AL. Structural, biochemical, cellular, and functional changes in skeletal muscle extracellular matrix with aging. Scand J Med Sci Sports 2011;21:749–57. [DOI] [PubMed] [Google Scholar]
- 22.Ramaswamy KS, Palmer ML, van der Meulen JH, et al. Lateral transmission of force is impaired in skeletal muscles of dystrophic mice and very old rats. J Physiol 2011;589(Pt 5):1195-208. [DOI] [PMC free article] [PubMed] [Google Scholar]
- 23.Ophir J, Ce´spedes I, Ponnekanti H, et al. Elastography: a quantitative method for imaging the elasticity of biological tissues. Ultrason Imaging 1991;13:111-34. [DOI] [PubMed] [Google Scholar]
- 24.Sugimoto T, Ueha S, Itoh K. 1990 Tissue hardness measurement using the radiation force of focused ultrasound. In Proc. IEEE Ultrasonics Symp, Honolulu, HI, 4–7 December 1990, vol. 3, pp. 1377-80. [Google Scholar]
- 25.Doherty JR, Trahey GE, Nightingale KR, Palmeri ML. Acoustic radiation force elasticity imaging in diagnostic ultrasound. IEEE Trans Ultrason Ferroelectr Freq Control 2013;60:685-701. [DOI] [PMC free article] [PubMed] [Google Scholar]
- 26.Dickinson RJ, Hill CR. Measurement of soft tissue motion using correlation between A-scans. Ultrasound Med Biol 1982;8:263-71. [DOI] [PubMed] [Google Scholar]
- 27.Bercoff J, Tanter M, Fink M. Supersonic shear imaging: a new technique for soft tissue elasticity mapping. IEEE Trans. Ultrason Ferroelectr Freq Control 2004;51:396-409. [DOI] [PubMed] [Google Scholar]
- 28.Lacourpaille L, Hug F, Bouillard K, et al. Supersonic shear imaging provides a reliable measurement of resting muscle shear elastic modulus. Physiol Meas 2012;33:N19-N28. [DOI] [PubMed] [Google Scholar]
- 29.Barr RG. Elastography. A practical approach. Thieme. 2017. [Google Scholar]
- 30.Barr RG. Sonographic breast elastography: a primer. J Ultrasound Med 2012; 31:773-83. [DOI] [PubMed] [Google Scholar]
- 31.Heckmatt JZ, Leeman S, Dubowitz V. Ultrasound imaging in the diagnosis of muscle disease. J Pediatr 1982;101:656-60. [DOI] [PubMed] [Google Scholar]
- 32.Quantitative ultrasound tissue characterization in shoulder and thigh muscles - a new approach Pernille Kofoed Nielsen Bente R Jensen Tron Darvann Kurt Jørgensen, Merete Bakke BMC Musculoskelet Disord 2006;7:2. Published online 2006 Jan 18. [DOI] [PMC free article] [PubMed] [Google Scholar]
- 33.Gunreben G, Bogdahn U. Real-time sonography of acute and chronic muscle denervation. Muscle Nerve 1991;14:654-64. [DOI] [PubMed] [Google Scholar]
- 34.Simons DG, Travell JG, Simons LS. Travell and Simons' Myofascial Pain and Dysfunction: The Trigger Point Manual. Vol 1. Upper Half of Body. 2nd ed Baltimore, Md: Williams & Wilkins, 1999. [Google Scholar]
- 35.Shah JP, Danoff JV, Desai MJ, et al. Biochemicals associated with pain and inflammation are elevated in sites near to and remote from active myofascial trigger points. Arch Phys Med Rehabil 2008;89:16-23. [DOI] [PubMed] [Google Scholar]
- 36.Sikdar S, Shah JP, Gebreab T, et al. Novel applications of ultrasound technology to visualize and characterize myofascial trigger points and surrounding soft tissue. Arch Phys Med Rehabil 2009;90:1829-38. [DOI] [PMC free article] [PubMed] [Google Scholar]
- 37.Adigozali H, Shadmehr A, Ebrahimi E, et al. Reliability of assessment of upper trapezius morphology, its mechanical properties and blood flow in female patients with myofascial pain syndrome using ultrasonography. J Bodyw Mov Ther 2017;21:35-40. [DOI] [PubMed] [Google Scholar]
- 38.Ballyns JJ, Shah JP, Hammond J, et al. Objective sonographic measures for characterizing myofascial trigger points associated with cervical pain. J Ultrasound Med 2011;30:1331-40. [DOI] [PMC free article] [PubMed] [Google Scholar]
- 39.Kumbhare DA, Clarke H, Peng P. Ultrasound-guided interventional procedures: myofascial trigger points. Reg Anesth Pain Med 2017;42:407-12. [DOI] [PubMed] [Google Scholar]
- 40.Kumbhare DA, Elzibak AH, Noseworthy MD. Assessment of myofascial trigger points using ultrasound. Am J Phys Med Rehabil 2016;95:72-80. [DOI] [PubMed] [Google Scholar]
- 41.Sikdar S, Shah JP, Gilliams E, et al. Assessment of myofascial trigger points (MTrPs): a new application of ultrasound imaging and vibration sonoelastography. Conf Proc IEEE Eng Med Biol Soc 2008;2008:5585-8. [DOI] [PubMed] [Google Scholar]
- 42.Phillips SM. Nutritional supplements in support of resistance exercise to counter age-related sarcopenia. Adv Nutr 2015;6:452-60. [DOI] [PMC free article] [PubMed] [Google Scholar]
- 43.Nijholt W, Scafoglieri A, Jager-Wittenaar H, et al. The reliability and validity of ultrasound to quantify muscles in older adults: a systematic review. J Cachexia Sarcopenia Muscle 2017;8:702-12. [DOI] [PMC free article] [PubMed] [Google Scholar]
- 44.Sipilä S, Suominen H. Ultrasound imaging of the quadriceps muscle in elderly athletes and untrained men. Muscle Nerve 1991;14:527-33 [DOI] [PubMed] [Google Scholar]
- 45.Ticinesi A, Meschi T, Narici MV, et al. Muscle ultrasound and sarcopenia in older individuals: a clinical perspective. J Am Med Dir Assoc 2017;18:290-300. [DOI] [PubMed] [Google Scholar]
- 46.Maurits NM, Bollen AE, Windhausen A, et al. Muscle ultrasound analysis: normal values and differentiation between myopathies and neuropathies. Ultrasound Med Biol 2003;29:215-25. [DOI] [PubMed] [Google Scholar]
- 47.Kamala D, Suresh S, Githa K. Real-time ultrasonography in neuromuscular problems in children. J Clin Ultrasound 1985;13:465-8. [DOI] [PubMed] [Google Scholar]
- 48.Reimers K, Reimers CD, Wagner S, et al. Skeletal muscle sonography: a correlative study of echogenicity and morphology. J Ultrasound Med 1993;12:73-7. [DOI] [PubMed] [Google Scholar]
- 49.Okita M, Yoshimura T, Nakano J, et al. Effects of reduced joint mobility on sarcomere length, collagen fibril arrangement in the endomysium, and hyaluronan in rat soleus muscle. J Muscle Res Cell Motil 2004;25:159-66. [DOI] [PubMed] [Google Scholar]
- 50.Stecco A, Stecco C, Raghavan P. Peripheral Mechanisms Contributing to Spasticity and Implications for Treatment. Curr Phys Med Rehabil Rep 2014;2:121. [Google Scholar]
- 51.Raghavan P, Lu Y, Mirchandani M, Stecco A. Human Recombinant Hyaluronidase Injections For Upper Limb Muscle Stiffness in Individuals With Cerebral Injury: A Case Series. EBioMedicine 2016;9:306-13. [DOI] [PMC free article] [PubMed] [Google Scholar]
- 52.Gao J, Memmott B, Poulson J, et al. Quantitative Ultrasound Imaging to Assess Skeletal Muscles in Adults with Multiple with Multiple Sclerosis: A Feasibility Study. J Ultrasound Med 2019. Mar 25. doi:10.1002/jum.14997. [DOI] [PubMed] [Google Scholar]
- 53.Wu CH, Ho YC, Hsiao MY, et al. Evaluation of Post-Stroke Spastic Muscle Stiffness Using Shear Wave Ultrasound Elastography. Ultrasound Med Biol 2017;43:1105-11. [DOI] [PubMed] [Google Scholar]
- 54.Bilgici MC, Bekci T, Ulus Y, et al. Quantitative assessment of muscular stiffness in children with cerebral palsy using acoustic radiation force impulse (ARFI) ultrasound elastography. J Med Ultrason 2018;45:295-300. [DOI] [PubMed] [Google Scholar]