Abstract
In the mid-1970’s a program of fundamental research was initiated at NBS to improve the scientific understanding of acoustic emission. Many individual results of this research have been reported in the literature and are beginning to be incorporated in a new generation of acoustic emission instrumentation, in improved test methodologies, and in the analysis of data. Here, we summarize the problems faced by acoustic emission midway through the last decade, review the accomplishments of the NBS program and related researchs programs, and outline the research that will be required in future years.
Keywords: acoustic emission, calibration, continuous monitoring, inverse problems, nondestructive evaluation, signal processing, structural integrity, theoretical bases
1. Introduction
Acoustic emission (AE) is the name given to the transient mechanical waves spontaneously generated by abrupt localized changes of strain within a body. Dislocation motion and crack growth are the mechanisms by which these strain changes occur during growth of flaws in materials; even minute crack propagation or plastic deformation results in elastic waves which can cause surface motion of a body. This surface motion is sometimes of sufficient amplitude to be detected by sensors (transducers) attached to the surface; the sensors convert a mechanical disturbance to a voltage-time waveform.
The surface motion due to an AE source contains information about both the location and characteristics of the source. Although this has been assumed for some time, it has been proved only recently [1,2]1. Using arrays of transducers and triangulation algorithms based on differences in signal arrival time, AE sources can be detected and located; however, their characterization is much more difficult. Nevertheless, by processing the received signals using newly developed methods, it is possible to extract additional information about the source. The AE technique, then, offers the potential of assessing and monitoring structures such as pressure vessels and piping, aircraft, bridges, etc., where a very high level of integrity is required.
Part of the potential of the AE technique was recognized early in the study of acoustic emission, and the first documented application to an engineering structure was published in 1964 [3], only 11 years after the first major laboratory investigation of the phenomenon by Kaiser [4]. It is important to realize several points. In the mid-1970’s industrial experience with AE had been accumulated over a relatively short time compared with established nondestructive evaluation (NDE) techniques. Not until now has sufficient experience been gained to assess the usefulness of AE for NDE. During the early applications of AE, the technique was used without a full understanding of its physical basis. Some mistakes were made and, together with enthusiasm and commercial pressure in the early days, these led to extravagant claims for the technique, inappropriate tests and uncritical interpretation of data. In the inevitable disillusionment that followed in the mid-1970’s the temptation was to dismiss the technique itself rather than to question the validity of the early experiments. More realistically, there was insufficient reliable evidence to make a valid scientific judgment then.
On the one hand, the technique did successfully solve some very important problems such as leak detection, the determination of regions of structures which require further detailed inspection, and the acceptance testing of glass fiber reinforced structures. Thus, even in its mid-1970’s form AE was undoubtedly a cost-effective monitoring technique for certain industrial applications. Table 1 [5] gives some idea of the scope of these successes.
Table 1.
Number of production tests monitored by acoustic emission [5]. (Total up to 7.1.79; numbers in brackets 7.1.78-7.1.79 only.)
| Shop hydrotest | Pre-service (installed) | In-service (requalification) | On-line monitoring* | |
|---|---|---|---|---|
| Chemical/petroleum vessels† | 32 [5] | 4 [0] | 382 [88] | 12 [4] |
| Chemical/petroleum systems | - | 3 [0] | 50 [0] | 3 [2] |
| Chemical/petroleum components and piping† | 1548 [812] | 34 [28] | 57 [25] | 14 [8] |
| Nuclear reactor vessels† | 24 [1] | 4 [0] | 5 [2] | 4 [0] |
| Nuclear power plant systems | - | 22 [0] | 9 [0] | - |
| Nuclear components and piping | 8 [0] | 22 [1] | 1037 [26] | 99 [64] |
| Nonnuclear power plant components | 2 [0] | - | 5 [2] | 17 [16] |
| FRP vessels† | 595 [135] | 47 [14] | 75 [70] | 12 [12] |
| FRP components and piping | 23 [23] | 303 [300] | 12 [12] | - |
| Storage tanks | 46 [1] | 29 [6] | 68 [14] | 1 [0] |
| Cell liners | - | - | 12 [0] | 4 [0] |
| Rocket cases (missiles, etc.) | 208 [2] | - | - | - |
| Autoclaves | 2 [0] | 1 [0] | 33 [18] | 11 [3] |
| Misc. pressure vessels† | 17 [11] | 2 [0] | 107 [30] | - |
| Misc. components | 2860 [360] | 4 [3] | 240 [240] | 230 [34] |
| Structures (bridges, cranes, etc.) | - | 14 [12] | 85 [14] | 4 [1] |
| Heat exchanger tubing (ft) | 231,000 | - | 500 [500] | - |
| Liquid and gas pipelines (ft) | 58 [5] | 1000 [0] | 517,000 [46,000] | 2002 [2000] |
| Drill pipe (ft) | 961,000 [961,000] |
On-line surveillance of operating systems or components.
Excludes experimental vessels.
Tested separately from a system test.
The Electric Power Research Institute and the National Bureau of Standards among others recognized certain key impediments to the development of the AE technique for monitoring the integrity of structures such as nuclear pressure vessels. These impediments included a lack of AE test data interchangeability; lack of a mathematical framework and physical understanding of the AE process; and an inability to determine the characteristics and significance of the AE source event from the processed AE signal. The NBS program on acoustic emission commenced in November 1975 and had a goal of developing a basis for quantitative AE inspection and monitoring. The purpose of this paper is to describe, in one place, many of the research results that came out of this program (together with supporting results from a similar collaborative project at A.E.R.E. Harwell) and their potential impact on field applications. It is also to point out the remaining (more difficult) problems now limiting the potential of the acoustic emission method of assessing and monitoring the condition and integrity of high performance structures.
2. Framework for the Approach and Theoretical Formulation
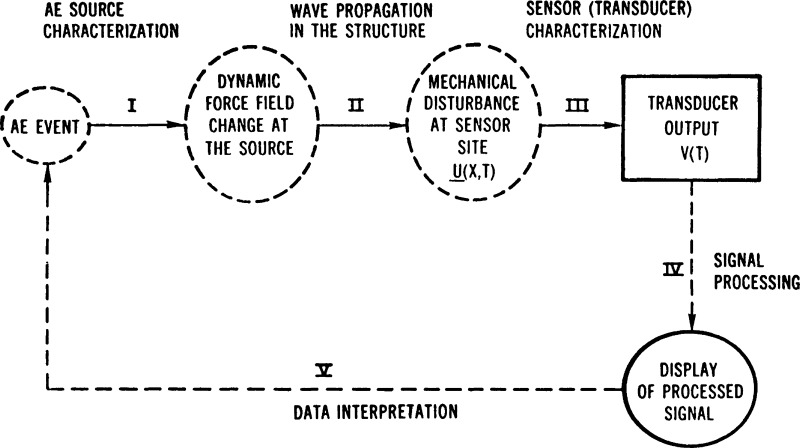
The sequence of events giving rise to a detected acoustic emission signal can be summarized in the manner shown in figure 1. This figure showing the processes of source generation, evolution, signal transduction and signal processing is also essentially an outline of this paper. An event takes place within, or near, the surface of a structure. This event, considered the AE source, causes a dynamic force (or stress) field at the particular location (Link I). The force field change is propagated as a mechanical disturbance throughout the structure (Link II). The sensor, usually a piezoelectric transducer mounted at a particular location on the structure, detects the disturbance and produces an output voltage as the detected AE signal (Link III). The goal of AE signal analysis, then, is to identify through a proper choice of signal processing and display (Link IV), the character and significance of the event (Link V).
Figure 1.
The causal chain of acoustic emission signal analysis.
Achieving this goal is difficult, even though the final output of the detected and amplified signal—a time-dependent voltage—can be recorded and processed, and this is because the characteristics of the source are essentially unknown in as much as they are modified by the structure and sensor. The wave propagation in the structure is affected by interaction with material properties, inhomogeneities, geometrical arrangement of free surfaces, and loading conditions. The complexity of these interactions usually forbids detailed analysis. Furthermore, conventional sensors are made of piezoelectric ceramic materials. Although the electromechanical conversion process of a piezoelectric element is understood in principle, the determination of the mechanical-electrical transfer function of individual transducers has not been possible in the past [6]. In summary, in the mid-1970’s the signal flow through the AE system chain was viewed as though completely inside a black box. Only the output signals were available for processing, and experimentally, only the loads applied and the specific geometry of the specimen were subject to control.
The first requirement of theory was the development of a framework for the quantitative description of acoustic emission from defects and other sources. To begin this, we note that AE consists of elastic waves generated by the release of stored elastic energy. The literature on elastic waves from a dynamic source in an elastic body extends over the fields of dislocation theory [7–9], dynamic fracture [10], and theoretical seismology [11,12]. Since the waves due to AE have the same character as earthquakes except for the scale, the study of acoustic emission is similar to seismology.
2.1. The Transfer Function Formalism
The framework for describing the acoustic emission process was developed using a Green’s function approach. This approach was specialized to localized, “pseudopoint” sources which admit a transfer function formalism over a restricted bandwidth, called the “informative bandwidth.” In essence this permits the replacement of the convolution integral of a Green’s function and a stress history in the time domain with the product of a transfer function and the transform of the stress history in the frequency domain. Viewed in the frequency domain, information is transmitted independently, frequency by frequency, so that filtering and other digital signal techniques can be employed to separate useful signals from noise. The virtues of using a frequency method for source characterization have also been discussed by Stephens and Pollock [13] and by Tatro [14].
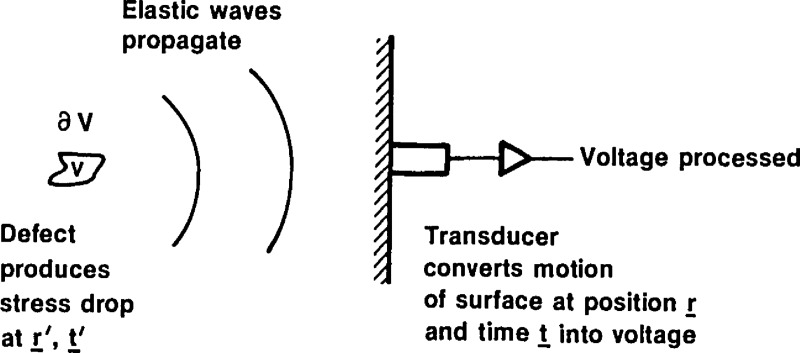
After an AE disturbance occurs, the wave character of the disturbance is altered by propagation through the structure, and is further modified when the local wave disturbance is converted to a voltage by a transducer and then processed, figure 2. A prediction of the output voltage in terms of the source and intervening structure is a description of the forward problem (conversely, the inverse problem is the determination of the source from measured voltage waveforms).
Figure 2.
Schematic of AE generation and detection process.
In the time domain, the surface motion due to an AE event is given by the combined effect of the stress rate and traction rate history convolved with the appropriate Green’s functions and integrated over the volume and surface of the structure. More formally, given the configuration in figure 2 Simmons and Clough [15] have shown that the displacement vector at time t and position in a volume V with boundary ∂V and surface normal due to a source at time t′ and position is characterized by a stress rate and a surface traction rate :
| (1) |
where the quantities are the partial derivatives at in the direction of the Heaviside elastic Green’s tensor2. The components of are the displacements in the i direction as a function of time, t, at the point , due to a step function point force applied in the j direction at . Equation (1) is more general than need be to describe acoustic emission since it contains within its compass the entire stress history of the structure, both static and dynamic. Acoustic emission sources are generally considered to be sharply limited in spatial extent and are usually measured over some limited frequency range because of noise and instrumentation limitations. Also, it is possible to ignore surface traction changes (although many spurious emission sources, such as frictional slipping of the body or surface oxide cracking, are of this type). Thus, the second term in eq (1) may be omitted to obtain:
| (2) |
which is a convolution of a time varying dipole density and the spatial derivatives of the Green’s tensor. It is still difficult to evaluate this expression in general if is extended over a substantial distance since it requires calculation of the Green’s tensor between each source and receiver point. It is further complicated by the possibility that, in general, each stress drop (or dipole density) component could, in principle, have a different temporal behavior.
These problems can be avoided by introducing the following simplifications that are expected to be valid for the majority of acoustic emission sources encountered in practice: 1) approximate distributed sources by a Taylors expansion about a point (the source centroid position) and 2) assume that all stress drop components have identical temporal behavior (an approximation first developed in seismology). It then follows that:
| (3) |
where is the space averaged stress drop considered to be distributed on the point .
In order to complete this derivation, it is necessary to model the response of the transducer and instrumentation. The approximation made was that of a “nondisturbing” transducer monitoring a given area of the body, ST. By “nondisturbing” is meant that the change in the waveform caused by the presence of the transducer could be neglected because it is small compared with the magnitude of the waveform itself. If the transducer is considered sensitive to displacement its point-by-point impulse response function can be denoted by , . This refers to the voltage at time t produced by a delta-function displacement in the i-direction at the point r at time zero. With this definition, the voltage at time t due to the emitting source is given by:
| (4) |
In the frequency domain, eq (4) becomes the transfer function formalism:
| (5) |
where is defined by combining the transfer tensor of the structure and instrumentation while is the stress drop (or dipole density) tensor of the source. We note that the integration over the transducer face has a tendency to cancel out “high” frequency components (those with wavelength comparable with the transducer diameter) in the signal; it acts as a (de facto) low-pass filter. This transfer function approach, eq (5), has a number of important consequences:
By far the most important consequence of the transfer function formalism is that information about the source is passed frequency by frequency to the output through the transfer tensor, a consequence of a linear system. For acoustic emission to be detectable, then, the transfer tensor must have significant components in that frequency band where the signal-to-background noise ratio for the source history is highest. One can expect, then, to gain only the information about the source history that is contained in that frequency band. By maximizing this useful band, one maximizes the possibility of finding enough information about the source to detect its signature. On the other hand, in certain situations no significant information about the source may pass to the output. For instance, in ductile and brittle materials comparable stress drops occur, but since the time scale of the ductile fracture process is longer, most information will be sent at lower frequencies—often below those that are usually measured so that one finds “no acoustic emission” [16,17].
Because the complex voltage v(ω) consists of the sum of a series of terms, phase interference effects are important. Owing to this, simple amplitude spectrum analysis will be invalid except for single time parameter sources.
Because of the number of stress rate components that must be separated from one another, multichannel measurements generally are needed to find an unknown source. This can mean from six channels, if a point source approximation with six independent components is used, up to 15 channels if the dipole terms, density changes, and surface monopole sources are included.
In the case of multichannel measurements, the transfer function relation can be written as
| (6) |
where vΓ is the voltage output of the Γth transducer and TΓ is the system transfer function.
If additional information is known about the source (e.g., its orientation and mode) then the number of channels is greatly reduced. For example, quantitative characterizations of acoustic emission have been reported for only a single information channel. The deduction of source properties from acoustic emission signals is referred to as the inverse problem here. An example of the solution of this AE inverse problem was first given by Hsu, Simmons, and Hardy [1]. Further examples were given by Hsu and Hardy [18] and the method was detailed by Hsu and Eitzen [18]. Simmons [20] and Simmons and O’Leary [21] have developed alternative inverse schemes using special decomposition and transform methods.
3. The Source
In early applications of AE to pressure vessel testing there was little or no understanding of the origin of acoustic emission signals. Later tests revealed the great weakness of this when it was found that steels used in pressure vessels often failed to give detectable AE even though crack growth clearly occurred.
Laboratory studies have more recently shown that in steels in the conditions likely to be encountered in pressure vessels, the following signal amplitudes could be generated: weak AE signals by plastic deformation, signals of moderate amplitude by the decohesion and/or fracture of inclusions such as sulphides and silicates, and signals with a wide range of amplitudes from crack growth depending upon the local microstructure state [22]. Plastic deformation and inclusion decohesion/fracture can occur during plastic zone formation at the tips of flaws. Using the theoretical formalism developed in Section 2, it is now possible to estimate the AE amplitudes that each type of source would generate.
It has recently [23,24] been shown that the stress change due to the motion of a dislocation is proportional to the distance moved (a) and mean velocity (v). Using eq (3) it can be concluded that the peak displacement amplitude u is given by
| (7) |
where k depends on material characteristics and geometry and h is the distance from the source. For dislocations in steel it has been estimated [23] that k≃10−14. From this it is possible to deduce the weakest detectable source. If a detector is positioned a distance h from the source, and has a displacement sensitivity threshold of x then av> 1014hx m2s−1 for the dislocation to be detected. Measurements of background noise indicate that in the laboratory the smallest detectable displacement is ~10−14 m, while in the field it is no better than 10−13 m. Then, the smallest detectable dislocation loop at a depth of 100 mm must have av⩾l m2s−1. Even if the velocity were ~3000 ms−1 (the theoretical limit is the shear wavespeed, ~3000 ms−1 in iron and steels), a single dislocation must propagate ~0.3 mm for detection. This is much greater than the distance usually moved by a single dislocation [25] and can therefore by discounted as a potential emission source in most structures. However, energetic burst emission during the yield deformation of a number of quenched ferritic steels tempered at 200 to 300 °C has been reported [26]. This has been attributed to the cooperative motion of groups of hundreds or thousands of dislocations. This source, however, occurs over a narrow range of microstructures likely to be encountered only near welds that have been improperly stress relieved. Heavily irradiated metals are susceptible to deformation by dislocation channeling. While the precise mechanisms for this are still not fully resolved, it is possible they may involve a cooperative slip process similar to that of critically tempered material. Thus, irradiated materials undergoing deformation might generate more acoustic emission and this could be why the acoustic emission activity of growing flaws in irradiated material is found to be greater than that of flaw growth in unirradiated material [27].
The fracture (or decohension) of precipitates and inclusions as a plastic zone sweeps ahead of a flow are candidates for generating detectable emission. Let us suppose that the microfracture event can be approximated by the formation of a “penny-shaped” crack which grows from zero to radius a at a velocity v under an applied stress 𝜎. Then for the event to be detected by a transducer with detection threshold x, at a distance h from the source, it can be shown [23] σa2v>5×l014 hx (watts). Thus, for h=100 mm and x=10−13 m, a2v>5 watts. Thus detected amplitude is proportional to the rate of release of elastic strain energy. Assuming a local stress of 500 MNm−2 and an intermediate crack growth velocity of 100 ms−1, yields a ≅3 μm. Carbide particle sizes in steels [25] are ⩽1 μm; their fracture is therefore below the level of detection unless they fracture at very high velocity. But inclusions are sufficiently large to be detectable.
Inclusion size, volume fraction, and morphology can vary considerably from place to place in large steel structures due to macrosegregation during ingot solidification. These inclusions, initially spheroidal in castings, become extended during rolling into strings with lenticular shapes. In plate material a typical inclusion in the string might be as large as 1 mm× 100 μm× 10 μm, the long axis being parallel to the rolling direction. Thus, the fracture of 100 μm× 10 μm cross-section of the inclusion would be above a detection threshold of 10−13 m. If the inclusions are strongly bonded to the steel matrix the decohesion of a 1 mm × 100 μm face is likely to occur at a lower stress. Nevertheless the large surface area is likely to assure detection even at stresses as low as 1 MNm−2.
We conclude that, while deformation of unirradiated low alloy steels, or fracture of spheroidal carbides will not be detected, the decohesion and fracture of large inclusions probably is detectable. It is likely to be the single most important emission source during plastic zone development ahead of a flaw in tough low alloy steels.
Applying the above model to the extension of a flaw by microcracking (with the same detection limit of 10−13 m displacement and a stress of 109 Nm−2), crack advance at the shear wave velocity approximately of ~3000 ms−1 in steel would be detectable if the new crack area was >2 μm2. At a more realistic velocity for a brittle advance (v~500 ms−1), the minimum detectable crack increment would be ~10 μm2. It might therefore be possible to detect crack advance of about 1 μm provided the advance takes place over more than 10 μm of crack front, making the acoustic emission technique the most sensitive NDE method available for detecting growth of a flaw. During continuous monitoring, ambient noise levels and hence detection thresholds are far higher than in the laboratory. The literature does not provide data on the absolute levels, but assuming for instance an increase by a factor of 100 resulting in a detection threshold of 10−11 m, the minimum detectable crack advance becomes ~ 1000 μm2 at a distance of 100 mm from the receiver (i.e., fracture of a 30 μm diameter grain).
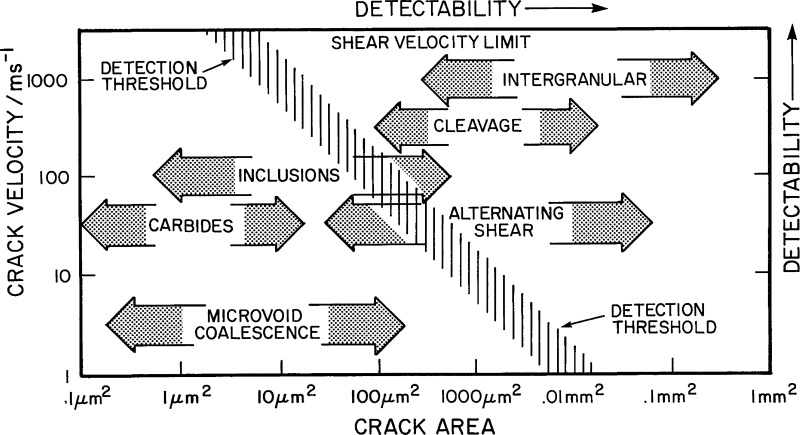
In general, crack advance occurs if the stress at any pre-existing flaw exceeds a critical value determined by the toughness of the material, the local stress and the size and orientation of the flaw. Crack growth will normally occur by the ductile dimple mechanism at temperatures above the ductile-to-brittle transition temperature, and by transgranular (cleavage) or intergranular fracture in the less probable event of crack advance below the transition temperature or in a locally embrittled region. In the event of cleavage crack advance, fracture of a grain (typically 30 μm dia) would generate large amplitude signals, as would intergranular fracture along several grain facets. More generally there is likely to be a range of crack areas and velocities generating detectable emission. Scruby and Wadley [28] made an attempt to represent these (fig. 3) in the form of a map that visually indicates the likelihood of detectability. All the estimates assumed an isolated microcrack. Recent work [29] has shown that the effect of a precrack, which would be present in the practical case, is one of a “sounding-board” for the AE event, enhancing its apparent amplitude in the frequency range of observation. An “amplification factor” of about 10 has been determined by experiment, so that correspondingly smaller crack increments should be detectable or the same sized events detectable from further away.
Figure 3.
Detectability of fracture events in steels. Detection threshold assumes transducer compression wave sensitivity of 10−13 m, source-transducer distance 0.1 m, stress 500 MNm−2.
Turning now to the more usual forms of constructional steel fracture, it is necessary to distinguish two modes of ductile fracture. In material of low work-hardening capacity, for instance in the heat-affected zone of a weld, or following radiation embrittlement, fast shear of inter-inclusion ligaments may occur. This occurrence involves crack advances of 100 μm2 or more and is likely to be detectable if the crack velocity exceeds ~50 ms−1. Such a source has been observed [30]. In material of higher work-hardening capacity, inter-inclusion and inter-carbide ligaments neck down until they finally part. This process occurs slowly and involves final separations over relatively small areas comparable with the intercarbide spacing. The product a2v is likely therefore to be below the detection threshold, and the quietness of this ductile dimple fracture has been confirmed experimentally many times [22].
It should be noted, however, that ductile crack growth is accompanied by the expansion of a plastic zone. Thus, although the crack advance mechanism itself may be quiet, there may be detectable AE from decohesion or fracture of inclusions as the plastic zone expands.
In service, sub-critical crack growth is most likely to occur under fatigue loading, possibly assisted by the environment, i.e., corrosion fatigue. During the fatigue of low alloy ferritic steels, crack advances as large as ~1 μm in a fatigue cycle are possible. Provided the advance takes place over at least 10 μm of the crack front and at a velocity >500 ms−1, detectable AE should be generated. Environmental effects and embrittlement by, for instance, hydrogen, in addition to possibly changing the fracture mode, also enhance the AE activity from crack growth. Under these conditions McIntyre and Green [31], for example, have shown that AE activity is proportional to crack extension.
In order to measure the reliability of flaw detection by AE, more experiments are required. Of particular importance are tests to determine the AE from fatigue and corrosion fatigue mechanisms in both base plate material and in and near weldments under realistic conditions of stress and temperature. Simultaneous, independent measurements of crack advance also must be made during these experiments.
4. Wave Propagation
4.1. Calculation of Elastic Wave Propagation in a Plate Specimen
The interpretation of source signatures requires a fully instrumented and well characterized laboratory experiment incorporating a structure whose wave propagation characteristics are known. The simplest geometry with practical relevance is a plate. Simmons et al. [32], and independently Pao et al. [33], thus set about the task of developing the mathematical and numerical framework for determining wave propagation in a plate; i.e., they calculated the dynamic elastic Green’s tensor for an isotropic elastic plate.
Previously, only Green’s tensor solutions for the elastic whole-space and half-space were available and experimental time records could only be compared with theory for short periods of time (a few microseconds for a convenient-sized test block) in geometries (plates) that resembled engineered structures. Two features of the solution for the plate were as follows:
The derived solution was a complete Green’s tensor of an infinite plate in the sense that the vector displacement at an arbitrary point, due to any arbitrarily oriented point force with step function time dependence, could be numerically calculated.
It was in the form of an infinite series expansion, usually called a generalized ray expansion in geophysical applications where similar problems have been treated [34,35]. This series is not an approximation (like normal modes).
The objective was to develop usable representations for the response of an elastic plate to a point force with step function time dependence. Since no completely closed solution is possible, the approach had to be amenable to computation. Two approaches were feasible. The first, designated in the seismological literature as a “ray theory” method, explicitly takes account of each wave reflection and is useful for short times after the initial application of the force. The second approach is to study the normal modes of the plate and to find what mode combinations are excited by the given source. The first approach has been implemented at NBS.
Consider the problem defined by the equations of motion:
| (8) |
and the boundary conditions:
| (9) |
where the stress σij is related to the displacement gradient ∂ui/∂xj by:
| (10) |
The summation convention is employed, 𝛿(x) denotes the Dirac delta function and H(t) is the Heaviside step function. The plate is assumed to be at rest until the instant t=0.
The solution of eqs (7) to (9), may be written in the form:
| (11) |
where the “Heaviside Green’s tensor” represents the ith-component of displacement produced by a unit point force H(t) applied in the j-direction. Thus, satisfies the equations:
| (12) |
and
| (13) |
The final task is to find explicit representations for . The ray approach represents GH as the sum:
| (14) |
where G∞ is the (readily calculable) infinite-body Heaviside Green’s tensor, and Gim is the “image” tensor induced by the free boundaries at x3=±h. Gim is thus composed of all possible reflections of the waves generated by G∞, and the ray method represents Gim in this form.
The physical meaning of each ray is quite straightforward. If the initial source function is broken into its characteristic components—longitudinal (P), horizontal polarized shear (SH), and vertical polarized shear (SV)—then each of these components can be followed through a series of reflections at the top and bottom faces of the plate until the receiver is reached, at which time they can be recombined. One ray is the contribution of one such component followed through a particular series of reflections—taking into account mode conversion wherein longitudinal or vertical shear components split into each other at each reflection. All rays arriving at the same time at the receiver can be grouped together and classed by arrival time.
Although the derivation of the Green’s function is based on an infinite plate, the solution is exactly applicable to a finite plate for a finite period. This period corresponds to the first arrival of the ray reflected from the sides of the plate or to the number of terms used in the ray expansion.
4.2. Examples of Green’s Function Components for Point Monopole and Dipole Sources in a Ferritic Steel Plate
The Green’s tensors for a ferritic steel plate are used as input to both the forward and inverse AE problems; however, a great deal can be learned about wave propagation by inspection of the Green’s tensors themselves. The tensor components of the Green’s function are informative because they give the displacement-versus-time response of the structure due to a point force input. While this input may or may not represent some AE sources, the response indicates which surface displacement directions are active, how the response changes relative to the source and sensor locations, how the source signal changes, and how much information is potentially available. The Green’s function for a (double-force) dipole source, equal and opposite forces at a point, provides additional information on questions discussed above and information on how the surface displacements available for measurement change due to a change in source function. The dipole source also provides a simple model for some AE events.
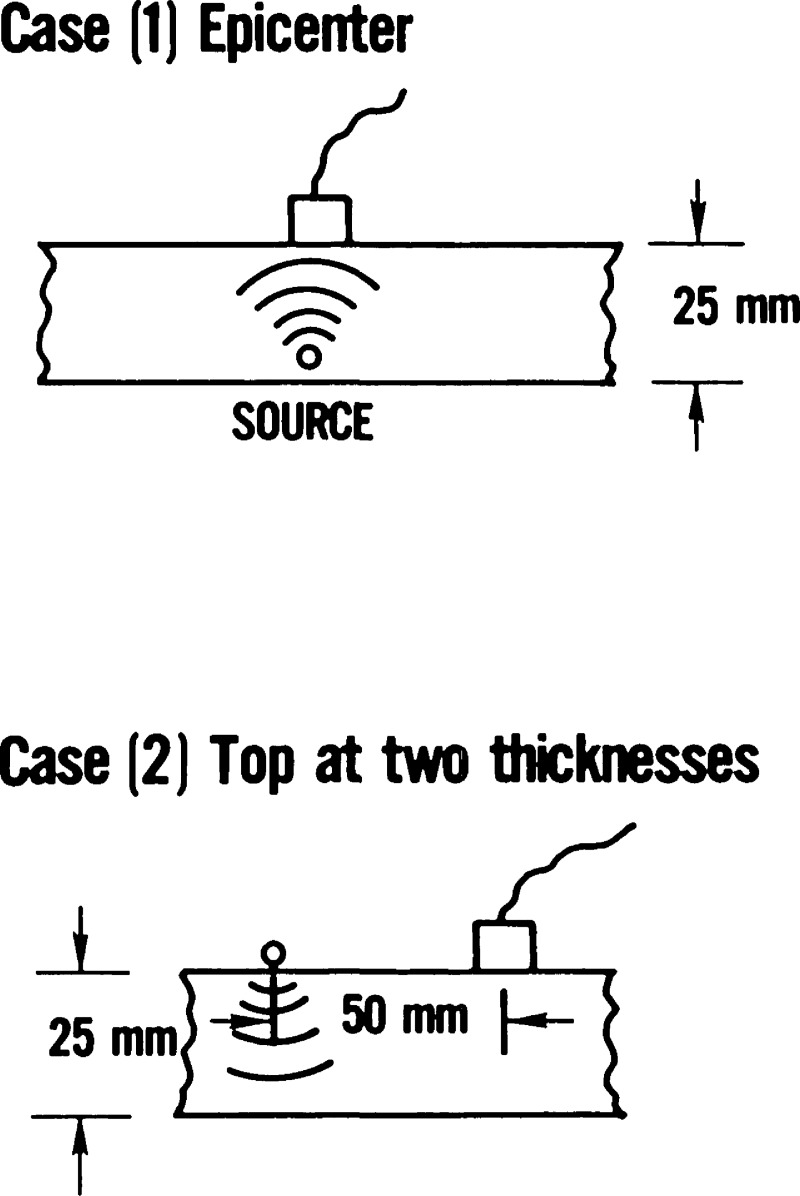
As before, the Green’s function tensor is designated by G and the component functions, the displacements in a given direction due to a point-force source in a given direction, are designated by G with two subscripts, for example, G13 or G23. As shown in figure 4, the subscript number 3 designates a direction normal to the plate surface; the subscripts 1 and 2 designate orthogonal directions in the plane of the plate surface. Thus, G13 describes the displacement in the plane of the plate due to a point force normal to the plate and G33 describes the normal displacement due to a normal force. We note that since the components represent displacements in the j direction due to a force in the i direction, the reciprocity theorem of elasticity applies and Gij=Gji so that, for example, G13 = G31.
Figure 4.
Source-plate-transducer configurations.
The displacement response due to a force dipole is designated by three subscripts on G for example, G31,1 which represents the displacement normal to the structure due to collinear equal but opposite forces in the plane of the structure.
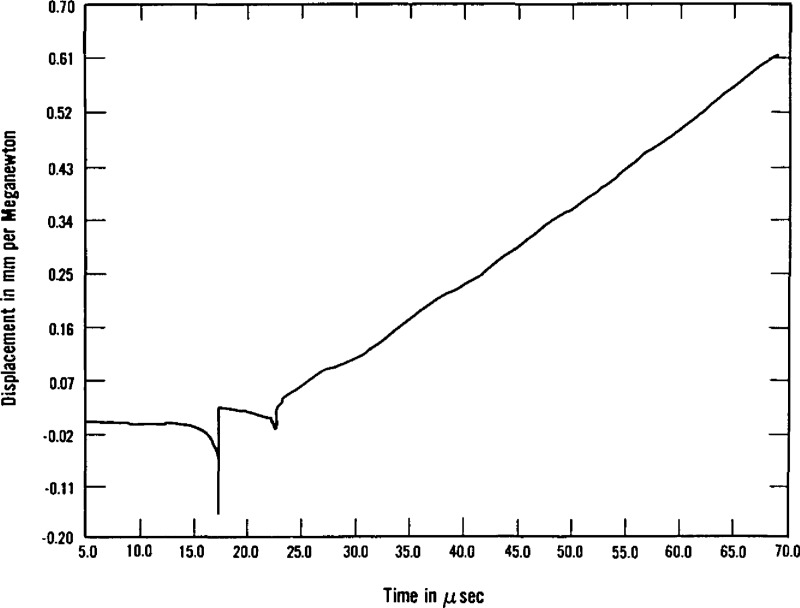
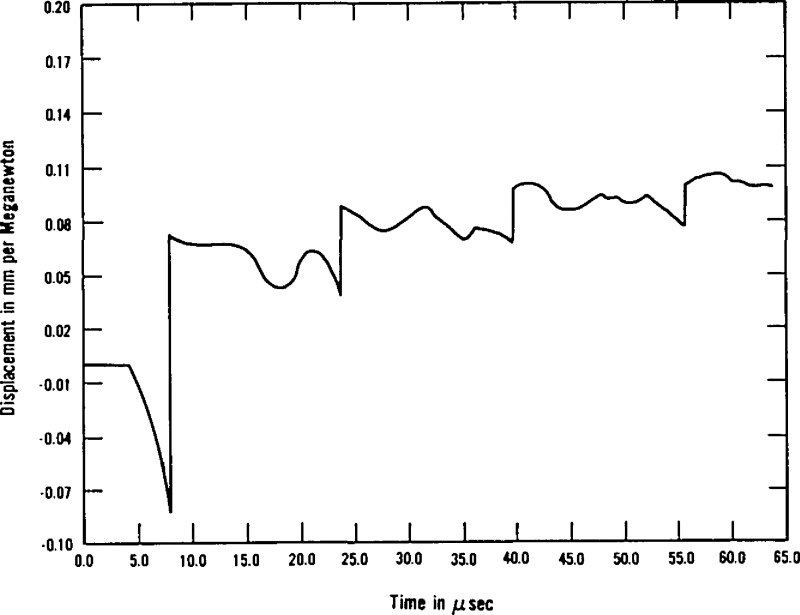
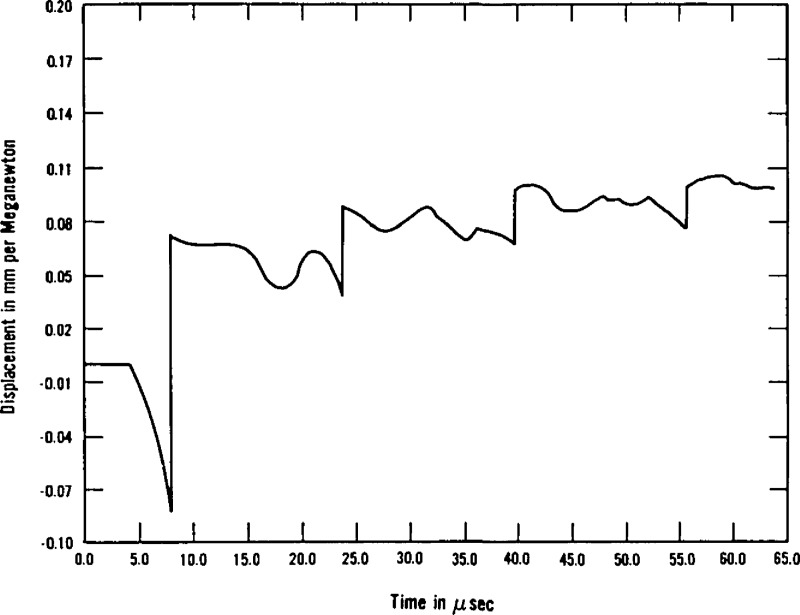
Figures 4 to 10 are examples of displacements arising from point force step and force dipole step sources at the top and bottom of a nominal 2.5 cm plate of A533B pressure vessel steel. A complete set of responses was calclated using measured wave speeds for an A533B plate specimen:
Figure 10.
Displacement response G33 due to a point force step for case 2.
Figure 5.
Displacement response G11 due to a point force step for case 1.
Figure 6.
Displacement response G13 due to a point force step for case 1.
Figure 7.
Displacement response G22 due to a point force step for case 1.
Figure 8.
Displacement response G33 due to a point force step for case 1.
Figure 9.
Displacement response G33,1 due to a point force step for case 1.
Here, we present examples of these calculated responses. The first of the figures (fig. 4) exhibits the geometry and the notations for the remainder of the plots. We summarize some of the principal observations from these curves as follows:
Each geometrical configuration of the source (its type, orientation, and location), plate thickness and transducer (its position, directionality, and sensitivity) produce characteristic signatures which permit determination of source location and orientation, especially source depth, with improved resolution over conventional source location techniques [2]. These signatures contain many characteristic features and thus demonstrate the crudity of attempting to select a single feature, such as amplitude of the curves, especially after these undistorted curves have passed through a resonating transducer as was done in the instruments of the mid-1970’s for source characterization. The spikes in the curves generally result from the arrival of wavefronts that have traveled over multiple paths so that, if their arrival times are to be used for source location, a more detailed analysis of their significance is required than is currently the case.
This leads to a related observation concerning the multi-axial (or vector) nature of displacements. A transducer with sensitivity to displacement in a single direction may not “see” displacements in other directions. Thus, source location, in which it is assumed that only waves with the Rayleigh velocity are observed may be grossly inaccurate. In addition, unless the vector calibration of a sensor is known, i.e., its sensitivity to displacement in each orthogonal direction, it is not possible to characterize the vector properties of the source. These two points underscore the importance of multi-axial (vector) transducer calibration [36,37].
5. Transduction
Transducers are used to convert dynamic surface displacements of transient elastic waves into electrical signals. The electrical signal resulting from the transient displacements of an AE event depends critically on the transduction process. The majority of transducers used in acoustic emission are piezoelectric crystals. Other types have been used; e.g., capacitors, laser interferometers, EMATs, etc., but these are normally too insensitive. Those used in field applications are similar in design to the transducers used in pulse/echo ultrasonic testing. To develop better instruments we must be able to characterize the measurement system. System characterization in turn leads to an understanding and improvement of the action of the transducers.
In the mid-1970’s, AE transducers were not optimally designed. One part of the NBS program has centered around the use of calibration systems for the design of advanced AE transducers that are now beginning to appear commercially. The second area of transduction research at NBS has focused on the calibration/standardization itself. The numerical values of traditionally measured parameters of AE signals (e.g., event or ring-down count) depend very much upon the sensitivities, directivities, and frequency response of the transducer used. In addition, if the individual transducers of a source-locating array are of unequal sensitivity or respond differently to a particular kind of wave motion, the deduced location may be in error.
Standardization provides a basis for transducer comparison making it possible to compare the results of different tests. The need for a standard method of calibrating transducers has been stressed by the American Society for Nondestructive Testing, the American Society for Testing and Materials, the American Society of Mechanical Engineers, and other technical organizations concerned with using acoustic emission techniques.
Many people hold strong opinions that a calibration be expressed in terms of absolute physical quantities such as open circuit volts of output per unit of surface motion at the transducer face,3 the motion being that which would occur in the absence of the transducer. Another choice could be to base it on the dynamic stress resulting from the interaction of the transducer and the body on which it is mounted, but with no transducer present this surface would be traction free. However, the problem with the latter approach is that two transducers having the same sensitivity to stress, but which present different loads to the surface, would give a different output to the same mechanical input. The definition in terms of a free surface has thus been the preferred one.
In order to improve data interchangeability and to improve extraction of information from AE signals through signal processing, the NBS AE program undertook to develop:
An AE transducer calibration and standardization system.
An optimal AE transducer using the calibration facility.
5.1. AE Transducer Calibration System
After consulting with practitioners and researchers in the AE community it was decided first to implement a transducer calibration system using the so-called “surface-pulse” method. The development of the basic principles that make the calibration possible owes to Breckenridge, Tschiegg, and Greenspan [38].
The surface-pulse transducer calibration system [39] functions in the following way: A step-function force event is generated on the plane surface of a large elastic block by the sudden release of a nearly static force applied through a glass capillary which is released when the capillary breaks. The resulting dynamic displacements of all points on this surface can be expressed in closed form by elastic theory (Section 4) up until the arrival time of reflections from the other boundaries of the block.
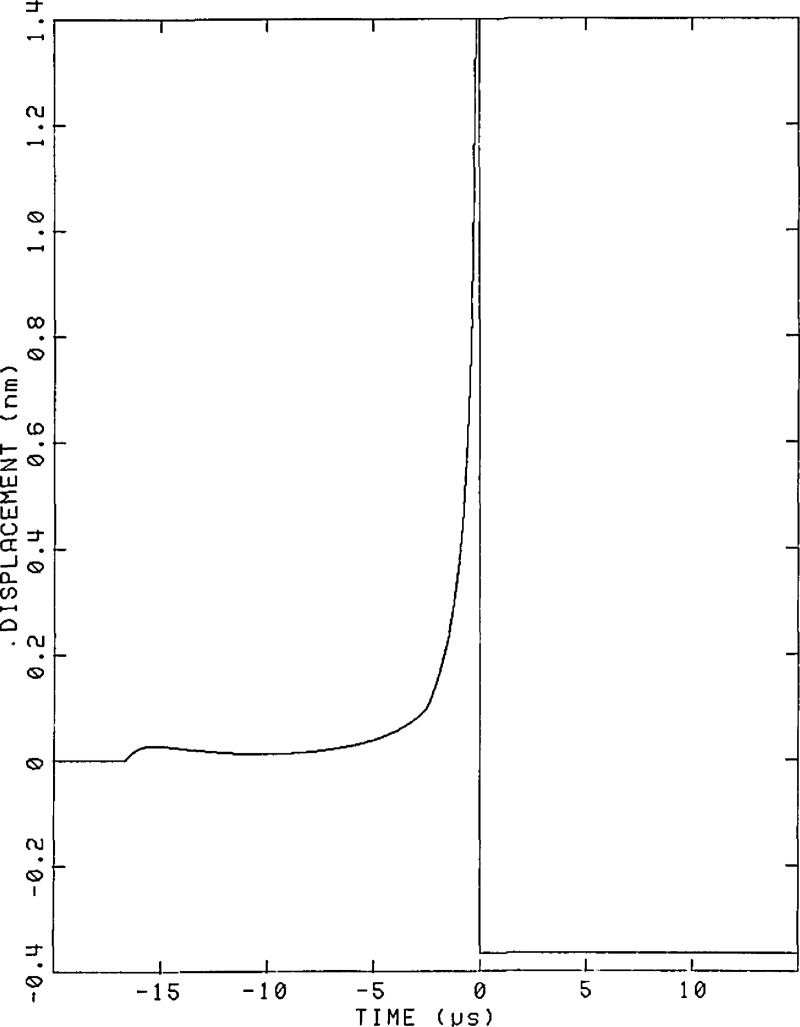
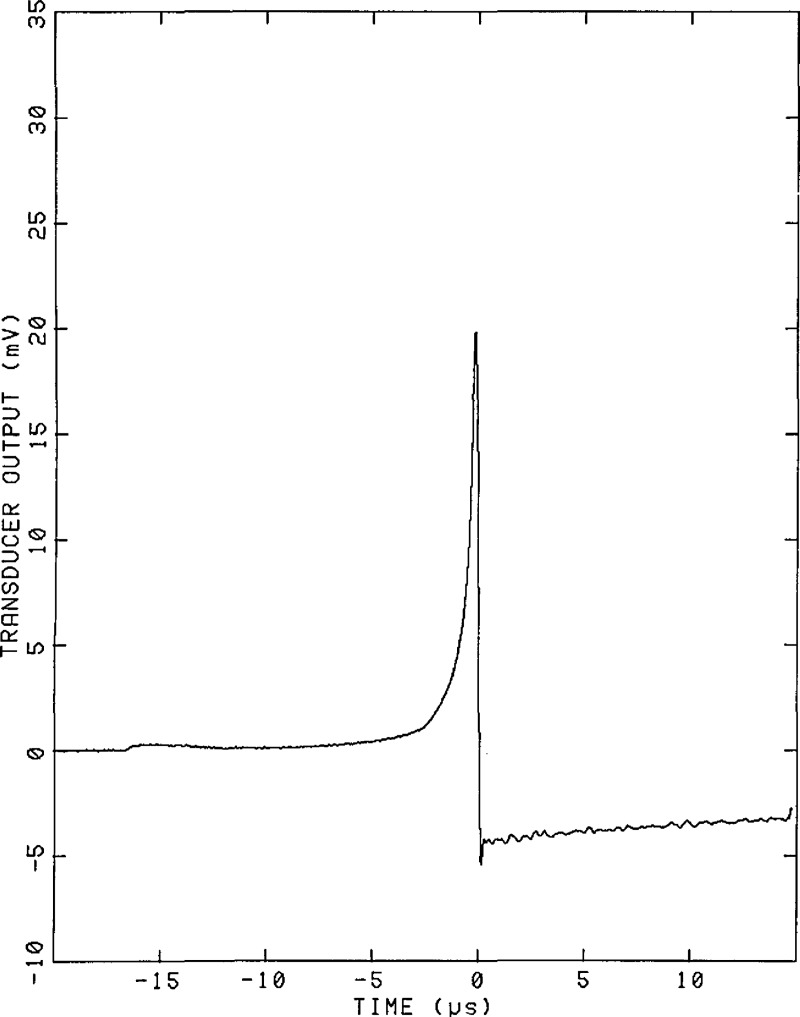
The normal component of the dynamic displacement is measured using a capacitive transducer [40] which is described below. Figures 11 and 12 show the theoretically calculated displacement and the average of 10 measured displacement waveforms. Satisfactory agreement between theory and measurement is observed. To perform a calibration, the capacitive transducer (standard) and the transducer to be calibrated (unknown) are placed on the plane surface of the steel block equally distant from the source. The transient electrical outputs of both the standard and the unknown transducers are recorded digitally and computer processed (deconvolved) to extract the response of the unknown transducer relative to that of the standard capacitive transducer.
Figure 11.
Calculated surface-pulse waveform for the steel block at the location of the transducer (101 mm from the source).
Figure 12.
Experimental surface-pulse waveform obtained by averaging 10 waveforms from the transducer.
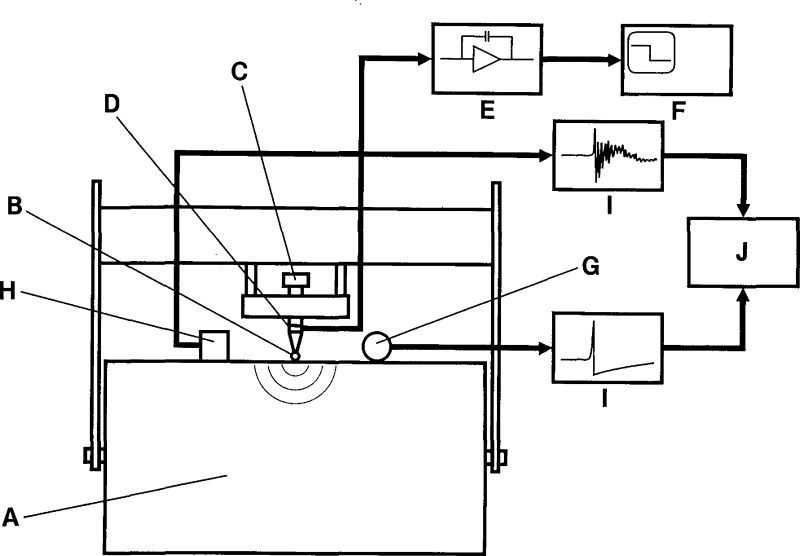
Figure 13 indicates the basic arrangement. A glass capillary, B, (~0.2 mm diameter), is squeezed between the top of the loading screw, C, and the upper face of the large steel transfer block, A. When the capillary breaks, the sudden release of force is a step function, whose risetime is of the order of 0.1 μs. The magnitude of this force step is measured by the combination of the PZT disc, D, in the loading screw and a charge amplifier, E, connected to a storage oscilloscope, F. The standard capacitive transducer, G, and the transducer under test, H, are equally distant and on opposite sides of the source. It is obvious from the symmetry that the surface displacements would be the same at the two transducer locations if it were not for the loading effects of the transducers. The loading effect of the standard capacitive transducer is negligible and the loading effect of the unknown transducer is part of its calibration. Voltage transients from the two transducers are recorded simultaneously by digital recorders, I, and the information stored for processing by computer, J.
Figure 13.
Schematic of the apparatus.
With this system it is possible to compare the signal from the unknown transducer with either that of the standard transducer or the calculated displacement waveform using a value for the magnitude of the step function force measured with a piezoelectric force transducer attached to the capillary loading device. The comparisons produce similar results. In either case, it is the free motion of the surface that is determined, the reference capacitive transducer providing essentially no loading [40]. The unknown transducer interacts with and loads the surface, the interaction also being dependent on the block material. These interactions are considered to be part of the calibration and so, in principle, the interpretation of the transducer output would be affected if used on a material with elastic properties different from those of the steel transfer block A.
The frequency range for the calibration of acoustic emission transducers is nominally from 100 kHz to 1 MHz. In order to deal with frequencies as low as 100 kHz, 100 μs of sample time is necessary to avoid computation errors. This dictates that a large transfer block be used so that sidewall reflections are delayed 100 μs or more. The block, donated by Bethlehem Steel, is 90 cm in diameter and 43 cm thick. It weighs about 4000 kg, and is made of A508 Class 2 steel. Both faces of the block were lapped in the NBS optical shop to be spectral reflectors in order to satisfy the surface smoothness requirements of the capacitive transducer and to eliminate surface roughness or surface work-hardening effects on wave propagation.
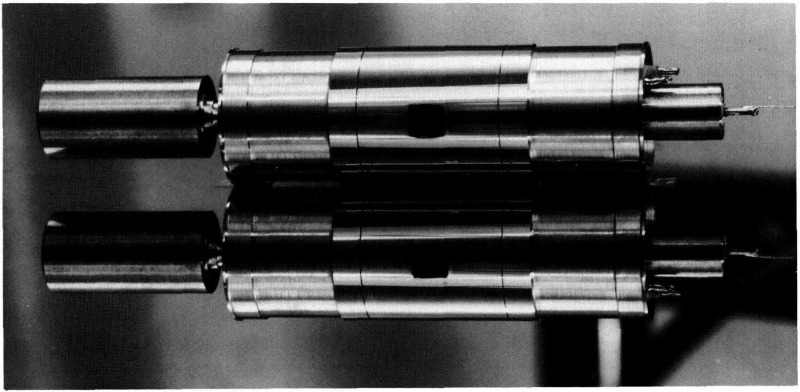
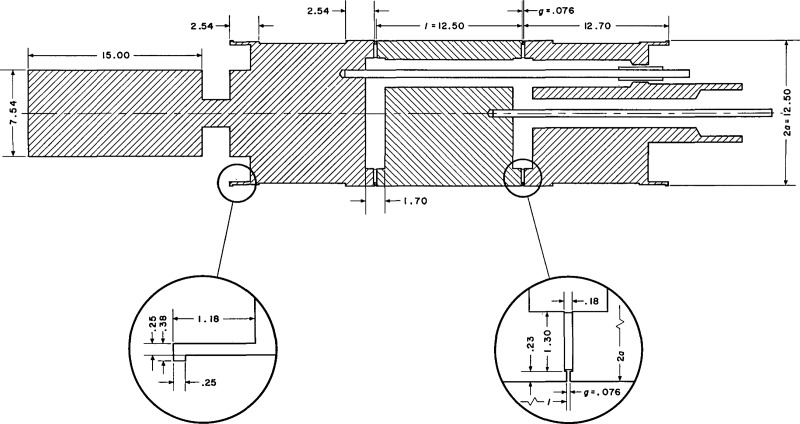
The standard capacitive transducer (figs. 14 and 15) has three cylindrical parts separated by insulators. The center cylinder is the active electrode and the ends are electrical guards. The ends are driven by a special unity gain amplifier, whose input is connected to the center part. The sensitivity of the transducer may be calculated with an error of at most 0.6% on the basis that the active portion is part of an infinitely long cylinder. This sensitivity is one-half the polarization voltage divided by the air gap. The air gap, nominally 4 μm, can be independently deduced from a measurement of static capacitance using a three-terminal capacitance bridge. The transducer also features built-in compliant elements remote from the active portion to minimize loading of the block. The sensitivity limit (noise level) of the standard transducer is about 4×10⁻¹² m.
Figure 14.
Photograph of the transducer and its reflection.
Figure 15.
Longitudinal section through the transducer. All dimensions are given in millimeters. Here 1 is the length of the active electrode, 2a is its diameter, and g is the width of the guard gap.
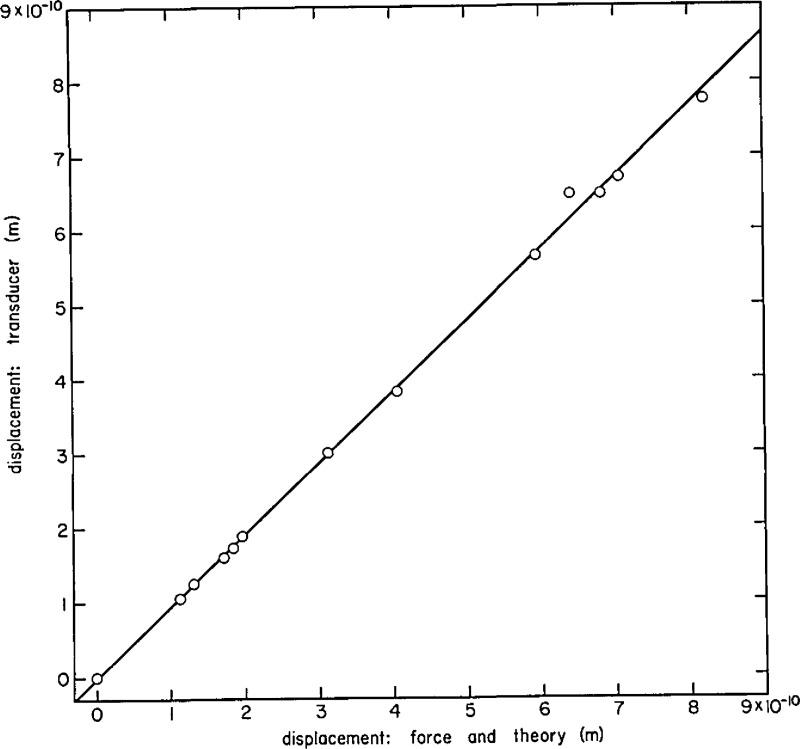
There is a measure of redundancy built into the calibration system—provided the displacement as measured by the standard capacitive transducer agrees with the calculated displacement. Experiments to check this agreement were performed (see fig. 16) and adequately establish this redundancy in the determination of displacements.
Figure 16.
Comparison of the displacement measured by the capacitive transducer (ordinate) and that determined by elastic theory from measurements of applied force (abscissa): steel block. The line is a linear least-squares fit to the data shown.
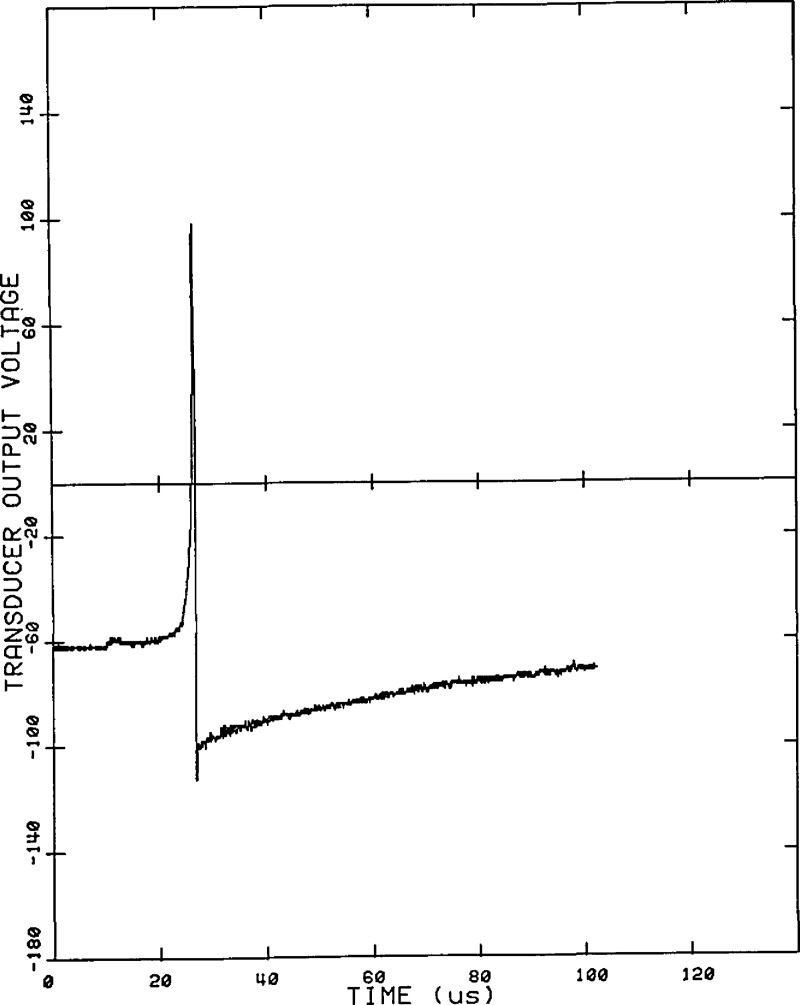
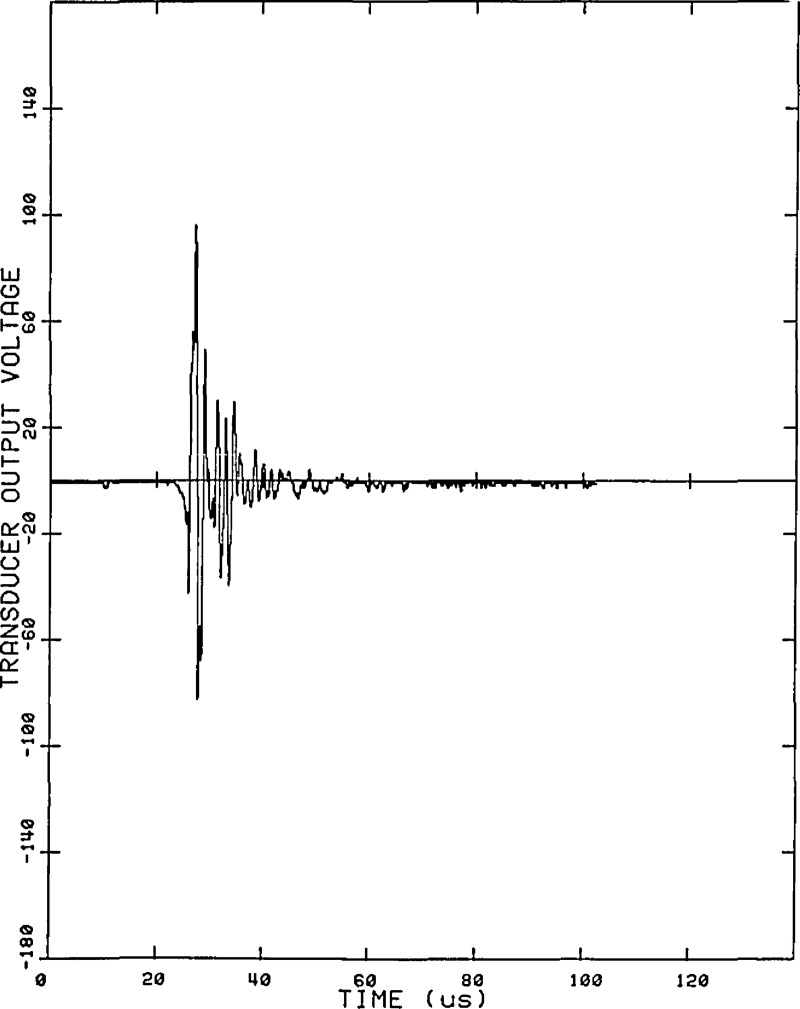
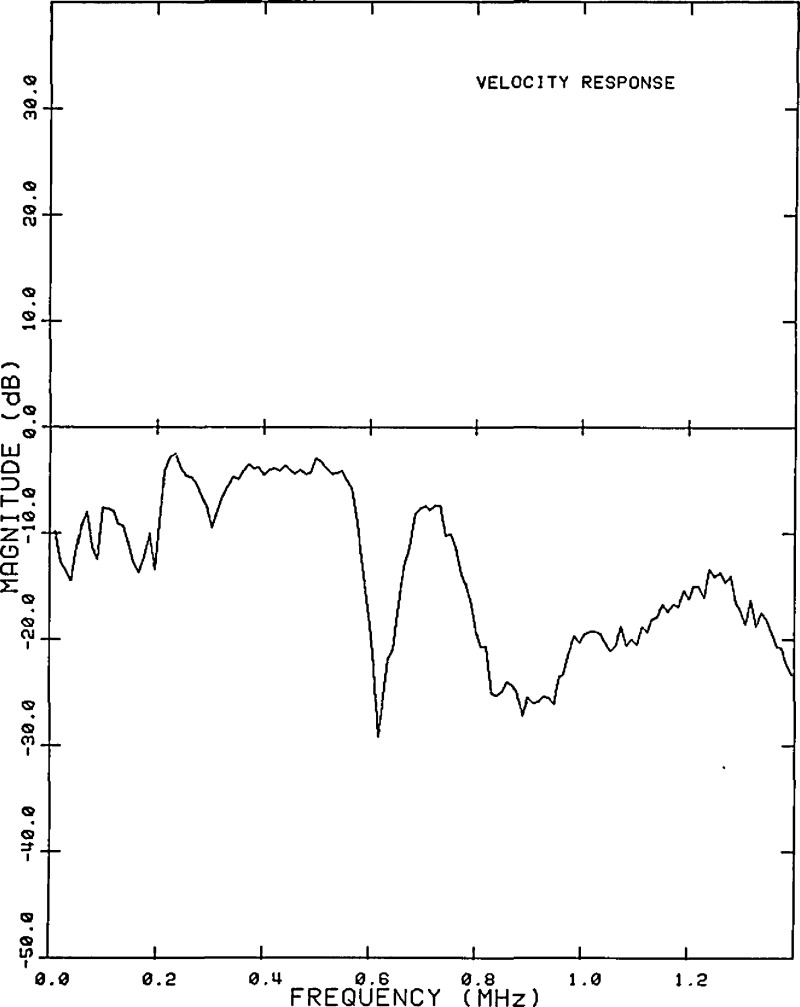
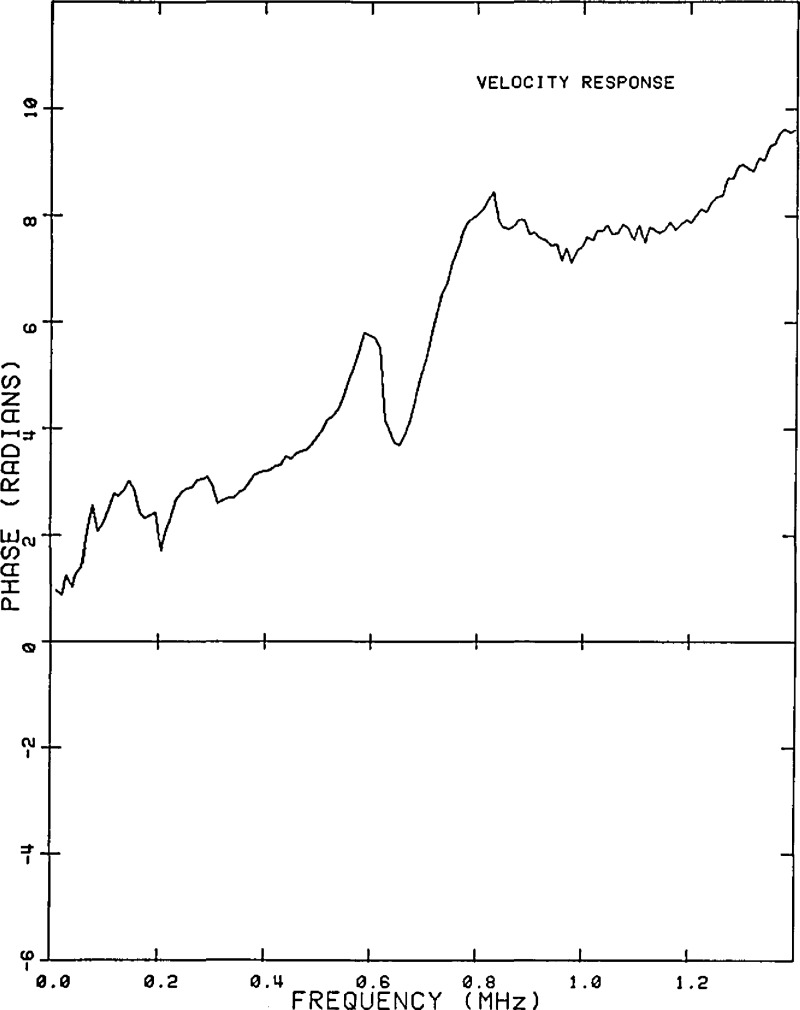
A typical captured waveform from the standard transducer is shown in figure 17, and, for the same force event, the waveform from an unknown transducer is shown in figure 18. An FFT is performed on both of these waveforms and the resulting frequency spectra are divided, frequency by frequency. The result yields the frequency response of the unknown transducer relative to that of the standard. The results of this calibration are presented with a logarithmic scale in figures 19 and 20.
Figure 17.
A typical calibration: voltage versus time waveform from the standard transducer as captured by the transient recorder.
Figure 18.
The same calibration: voltage versus time waveform from the unknown transducer as captured by the transient recorder.
Figure 19.
Magnitude response of the unknown transducer.
Figure 20.
Phase response of the unknown transducer.
5.2. An Optimal Acoustic Emission Sensor
The typical response of commercially available AE transducers to transient surface displacement is shown in figure 18. Such devices have two drawbacks:
They tend to be sensitive to a combination of mechanical inputs (displacement, velocity, or acceleration) rather than only a single physical quantity. As will become clear in the later discussion of source characterization, this leads to difficulties in the conceptual design and implementation of AE source determination.
They also tend to have large variations in sensitivity over the frequency range of interest. Regaining the information filtered out in the regions of sensitivity minima is, at best difficult, because of the poor signal-to-noise ratio at these frequencies.
The capacitive transducer described above has a flat frequency response over a wide frequency range, making possible a faithful reproduction of dynamic surface displacement. It is, however, directional, of low sensitivity, and requires a highly polished mounting surface. While it is an excellent transducer for laboratory calibration work, a need for a transducer without these limitations was evident.
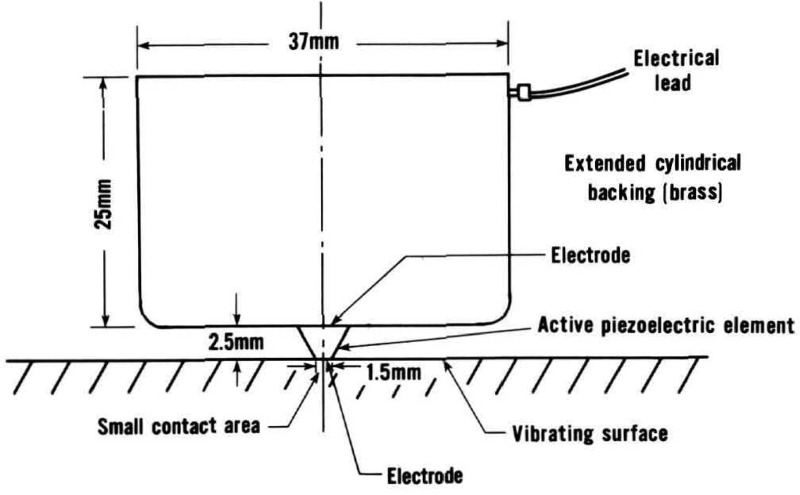
The NBS conical transducer was developed in response to these needs [41–44]. One of the first models is shown in figure 21. It is a simple two-piece device consisting of a small conical piezoelectric element and a large backing, usually of brass.
Figure 21.
Schematic of one version of the NBS conical transducer.
By design, this transducer has a contact area which is small relative to Rayleigh wavelengths in the working range, nominally 0.1–1 MHz. This eliminates the aperture effect, evident in most commercial transducers, which changes transducer directionality and reduces bandwidth. The brass backing block is so large and so lossy that waves entering it via the conical element are largely dissipated by the time they reflect back to the element. Thus the backing block may be approximated as a solid elastic half-space. On this basis, it can be shown that for low frequencies the transducer functions as a displacement sensor.
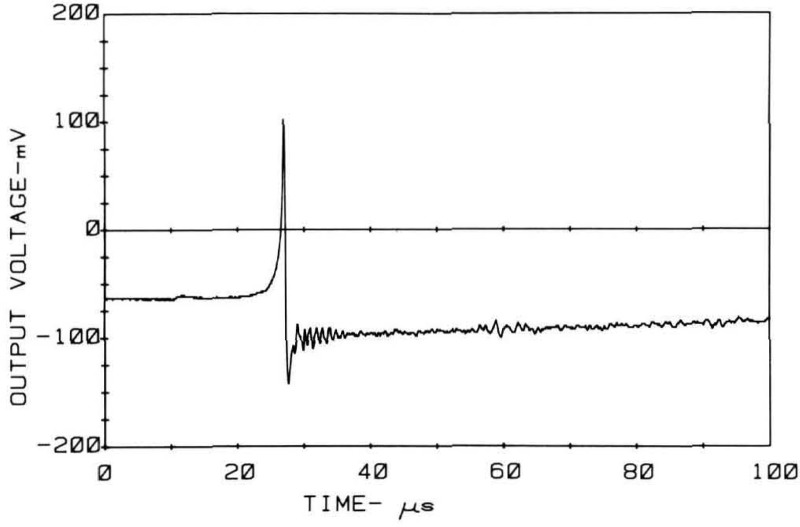
The surface-pulse response of the NBS conical transducer (fig. 22) shows a little undershoot after the Rayleigh wave arrival and some backing reflections but compares favorably both with the theory and with the capacitive transducer response as shown in figure 17. It also compares very advantageously with the typical response of a commercial transducer to the same waveform as shown in figure 18. It follows dynamic normal displacements nearly as well as the standard capacitive transducer but it is more rugged, one to two orders of magnitude more sensitive (about as sensitive as commercial AE transducers), and it is broad band.
Figure 22.
Measurement of surface pulse using the NBS conical transducer.
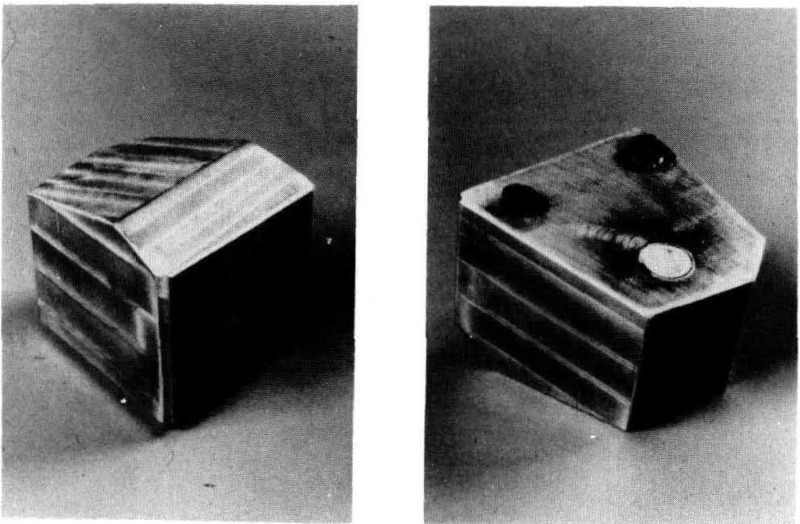
Figure 23 shows two views of a newer model of the transducer which produces the most faithful waveform of any piezoelectric transducer we have encountered. The idea behind the complex geometry is to smear out the reflections to the element by the backing; it does this by delaying them because of their different transit times.
Figure 23.
Version of NBS conical transducer which produces most faithful measurement of dynamic displacement by means of a piezoelectric transducer.
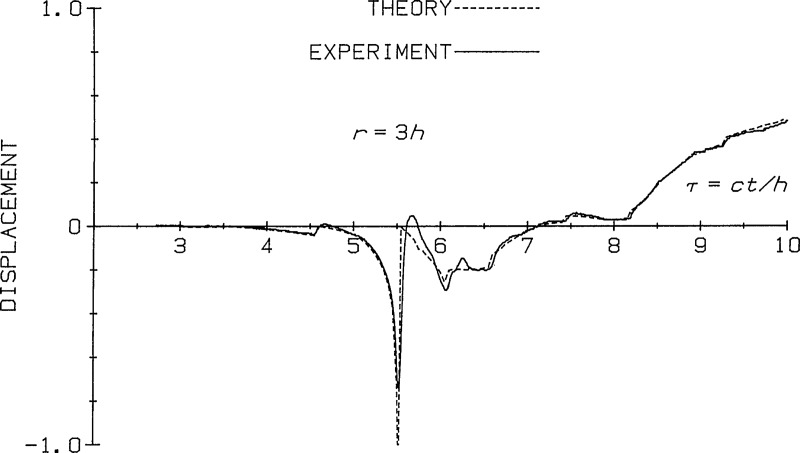
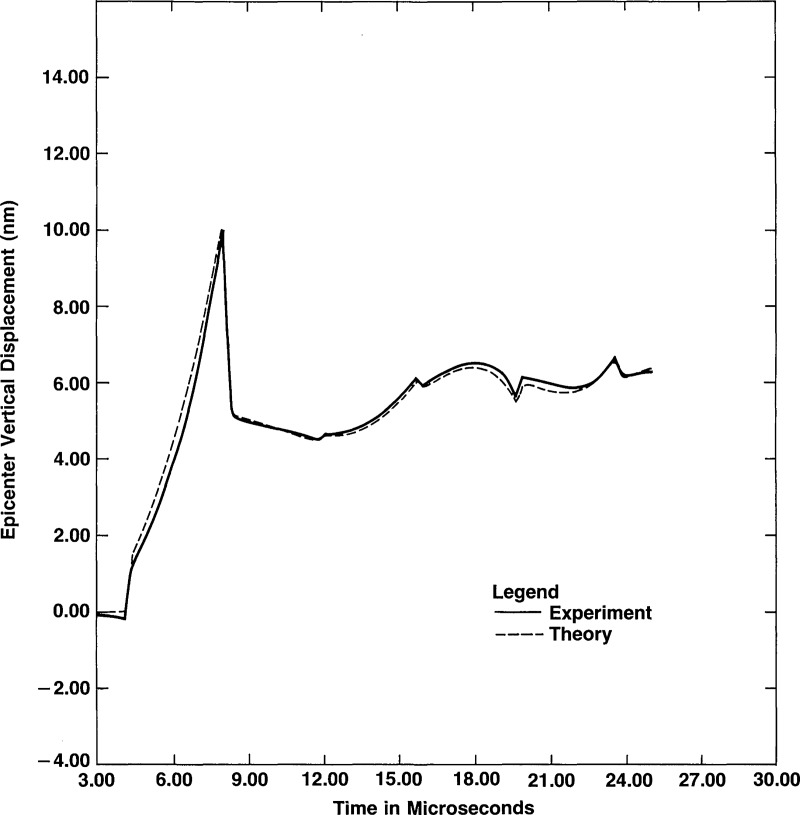
An example of the response of this model of the NBS conical transducer is shown in figure 24. The dashed curve gives the theoretically predicted normal displacement of a plate at a location three thicknesses away from, and on the same side of a plate as, a pointforce step function input. The solid curve is the voltage-time output of the transducer shown in figure 23 on a glass plate with the transducer located two plate thicknesses away from a breaking glass capillary event [44]. Current plans call for making available for purchase the model shown in figure 23 through the NBS Standard Reference Materials Program. Other models have been designed to be more rugged or smaller but with almost the same fidelity.
Figure 24.
Theoretically predicted and measured displacement of a plate due to step-function force input. The transducer used is that shown in figure 22.
6. Simulated AE Sources
A long-term weakness with the development of acoustic emission for materials testing and structural monitoring has been the absence of a well characterized simulated source that can be used for system evaluations. Such a source should result in a short duration stress pulse, similar to actual sources, of known characteristics at any arbitrarily-chosen location. Referring back to figure 1, a simulated AE source is critical to calibrating AE transducers (defining Link III) in conjunction with a structure with known wave propagation characteristics, to determining unknown wave propagation characteristics of structures (defining Link II) in conjunction with a calibrated transducer of high fidelity, and to aiding the development and testing of appropriate signal processing schemes (Link IV) for determining source significance. This latter function includes facilitating the making of instrument settings and the verification of performance, for example, of source location systems. A simulated source should be; 1) repetitive, 2) reproducible with a known source mechanism, 3) of similar characteristics to “real” AE, and 4) relatively easy to implement.
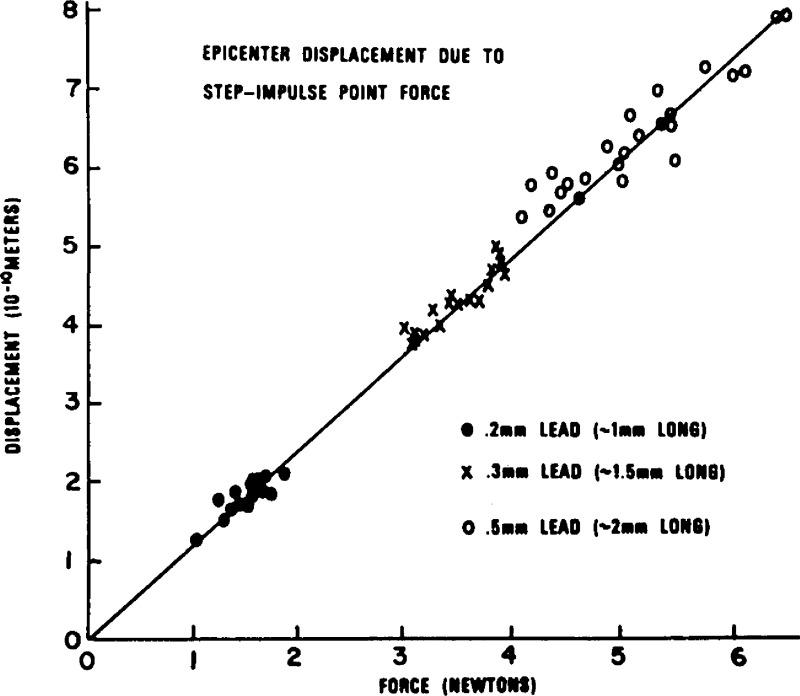
The first simulated AE source developed, the breaking capillary source, already has been described briefly. Some additional details are given by Breckenridge [39]. The technique has proved an extremely good laboratory tool. Hsu [45] has extended the approach with a technique based on the breaking of a pencil lead. A self-contained push-button type mechanical pencil with high quality pencil leads replaces the glass capillary. A piece of lead of specific length is projected from the pencil. As the tip of the lead is pressed, at steadily increasing pressure, against the structure; this increasingly loads the structure until the lead breaks, thereby generating a step function force unloading on the structure. The magnitude of the force can be selected by the choice of pencil lead as shown in figure 25. This simple technique has become the standard method throughout the world for checking instrument calibrations. It is being adopted as a calibration tool by AE standards groups in the United States, Europe, and Japan.
Figure 25.
Typical calibration results.
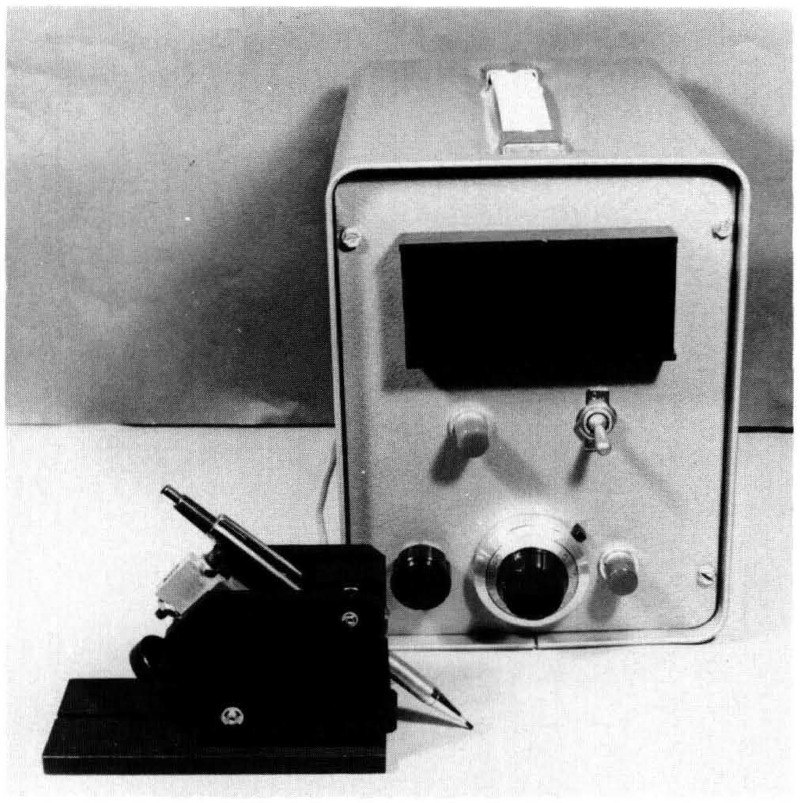
The pencil lead technique has also been implemented as an absolute input force [2]. Figure 26 shows such a device. As the pencil is pushed against the structure by turning a loading screw, the force is transmitted through a previously calibrated load cell which pivots the pencil to load the structure. The load cell output is connected to a peak-hold device and displays the peak force which is the magnitude of the force-step. The waveform shape of each lead-break event is very similar to the others; the exact amplitude cannot be controlled since it linearly scales with force magnitude. Provided this is determined through the technique above, absolute calibration is possible, however.
Figure 26.
Mechanical AE simulator.
More recently a Nd:YAG pulsed laser has been used to produce predictable, repetitive, thermoelastic dipole sources to generate elastic waves (simulated AE) in a structure [46]. A large plate has been used to implement this source to permit comparisons with theory. The elastic displacements due to a force dipole combination representing the thermal expansion for a laser source have been calculated for an isotropic elastic plate. Figure 27 shows the excellent agreement between experiment and theory for this source. An advantage of this source is the wide range of source strengths that can be activated merely by varying laser pulse energy. The source is also dipolar in nature, like defect sources. It is, however, a very costly simulated source with certain safety limitations.
Figure 27.
Comparison of experiment and theory for laser generated AE in 2024-T6 Aluminum.
Comparisons have been made between more economical and safe electrical spark impact sources and pulsed laser sources. The laser source is effective but the spark source has advantages which include portability, simplicity, and low cost. The charging, switching, and triggering circuits have been perfected so that a brief (few nanosecond), high-voltage current pulse with very low jitter can be discharged between electrodes. The simulated AE waveforms that result are essentially identical one to another.
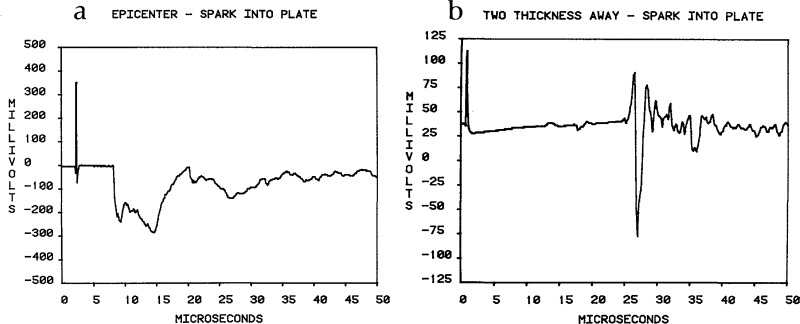
The mode of the spark source which is controlled by the configuration of the electrodes effects the signal generated. We have emphasized the configuration in which the plate or structure is one electrode with the second just above the plate surface. The stress wave generated in the structure can be modeled as evolving from local surface plasma heating, the same mechanism as when using a pulsed laser source for radiation heating. Figure 28 shows a detected signal due to sparking onto a 1.5 in thick plate. In figure 28, (a) corresponds to the sensor located at the epicenter and (b) to the sensor located on the same surface as the source, and two plate thicknesses away from the source. From such experiments we conclude that: the source is extremely reproducible; the detected signals agree well with theoretical predictions for a dipole source; the surface normal motion has a well-defined negative pulse whose arrival is easily detected, a fact that could be exploited for precise measurements of ultrasonic wave speed measurements; the rise time for the stress wave is less than one-half microsecond; and, although the source generates electromagnetic signals, these can be isolated easily in the time domain. A comparison of these various sources has recently been completed by Jones, Green, and Hsu [47].
Figure 28.
Detected AE signals due to a spark source for sensor (a) at epicenter and (b) on the same surface as the source and two plate thicknesses away.
A different approach to producing a known source is to induce actual AE events in a material in a controlled way [16]. The method we have used involved indentation, i.e., local loading, of a plate so that the location can be chosen. The number and size of defects can be controlled by the loading rate. By using surface-hardened steel plates and diamond pyramid indenters, subsurface microcracks can be reproducibly created and sized later using destructive metallography. Correlations can then be made between the signal from the defect, signals from non-defect (simulated) sources such as those discussed above, and the crack microstructure. Indentation is not a new method of producing surface cracks, but it is new in combination with AE.
In using the indentation source, acoustic emission signals were monitored at the epicenter as well as on the same surface as the source. A sample of 02 tool steel, 2.54 cm thick and 7.62 cm in diameter, was prepared by austenitizing at 865 °C, and water quenching, following which the surfaces were ground and metallographically polished with care to avoid surface damage.
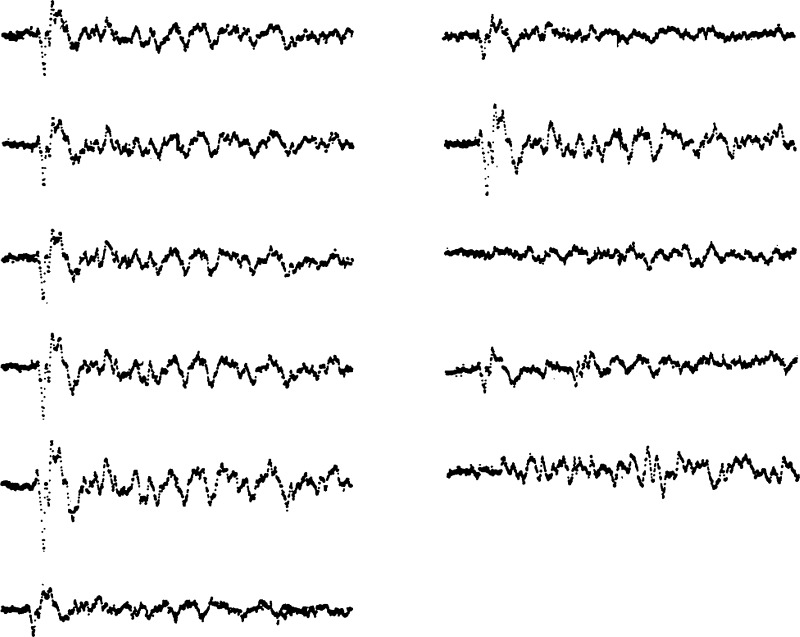
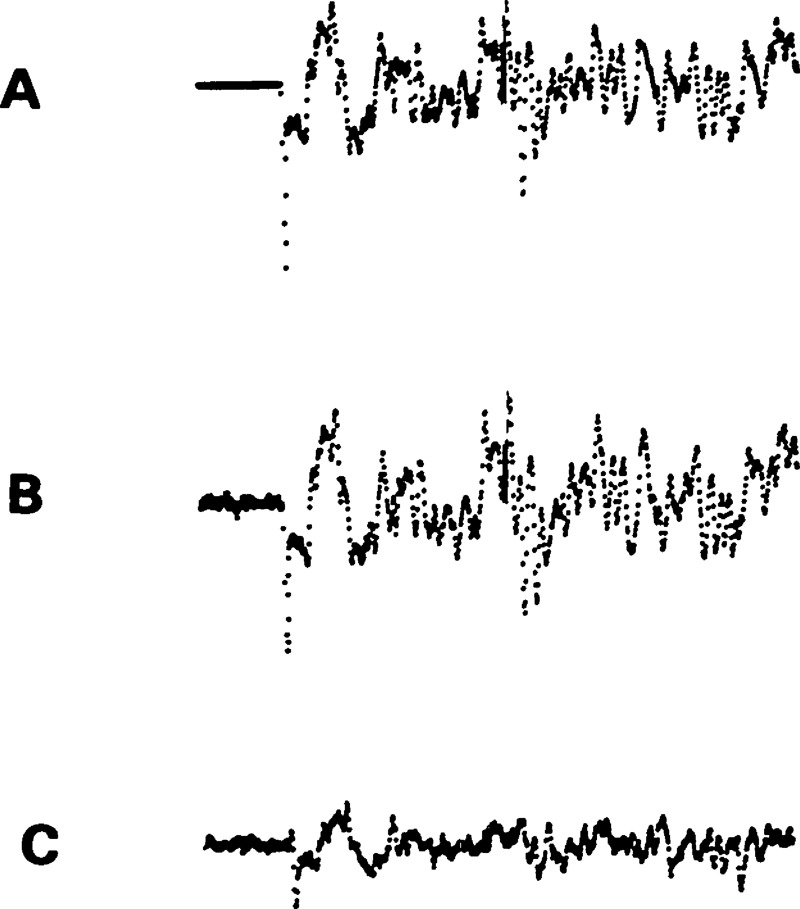
Examples of the very reproducible epicenter signals which were generated are shown in figure 29. In figure 30, one of these signals (A) is compared with that produced by very fast (~0.3 μs) step function unloading due to breaking of a glass capillary, while another signal (B) is obtained by replacing the glass capillary with a piece of commercially available plastic labeling tape. Here the load, in excess of 50 kg, is approximately that needed for indentation AE, and the signal is of the same order of magnitude (−76 dB) as the signal from the microcracks. The glass capillary signal is at a much higher level, −20 dB. The similarity of these signals suggests that the epicenter signal from the crack looks very much like an unloading signal consistent with the notion that cracking relaxes the elastic stress distribution.
Figure 29.
Reproducible signals at epicenter from indentation in an embrittled 02 tool steel (Rockwell C hardness, 69). The duration of the signal is 102 μs and the amplitude after 76 dB amplification is about ±50 mV. Two of the signals near the end are included to show some of the occasional nonreproducible signals that occurred during this test.
Figure 30.
Epicenter signals through plate of embrittled 02 tool steel (Rockwell C hardness, 69). The signal duration is 102 μs and the amplitude is about ±50 mV. (A) Ball-tipped indenter breaking glass capillary (20 dB amplification). (B) Ball-tipped indenter fracturing plastic labeling tape (76 dB amplification). (C) Vickers indenter directly contacting plate (76 dB amplification).
7. Source Characterization (the Inverse Problem)
One of the most important objectives of current AE research is development of signal analysis methods to explicitly characterize the AE source from remotely measured AE signals alone. This general problem, common to fields such as seismology and radar, is as yet an unsolved one, and one that will require complex processing of many independent channels of information. However, for sources which can be represented by a point force of unknown magnitude and time dependence but known direction, normal to the surface, for example, explicit determination of the source by deconvolution has been accomplished for two source-receiver configurations.
One geometry used for deconvolution of the received signal is that of a large plate with a point source on one surface and the receiver centered directly over the source on the opposite surface (epicenter). In this case, the Heaviside Green’s function Gh can be calculated exactly. It is also assumed that the sensor measures the normal surface displacement, u3. Practically this is accomplished by using either a capacitive transducer or the NBS conical transducer. For this case of a point source applied to a surface, it can be readily shown that eq (1) reduces to a one dimensional convolution integral:
| (15) |
where is the Heaviside Green’s function and is the history of the time rate change in the point force. Following the procedure detailed by Hsu and Hardy [18], the differentiated source function can be obtained as a convolution integral,
| (16) |
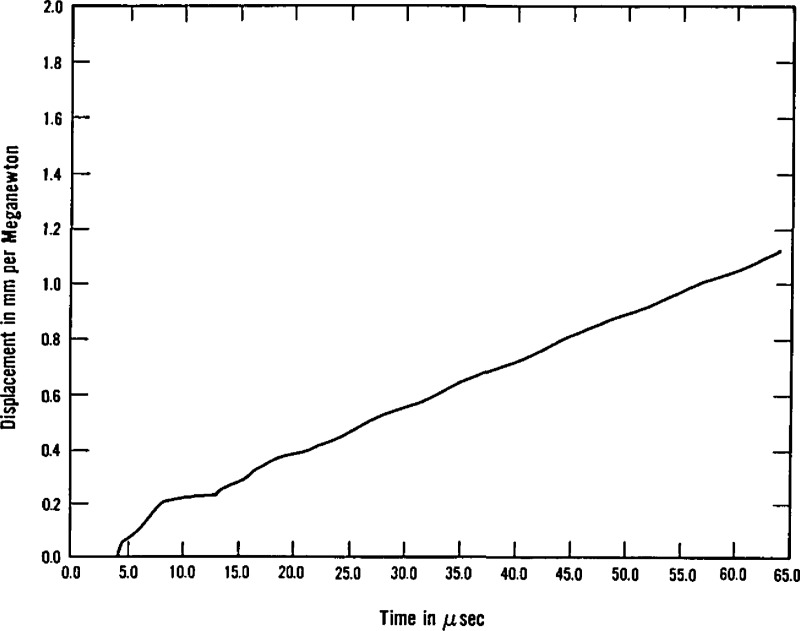
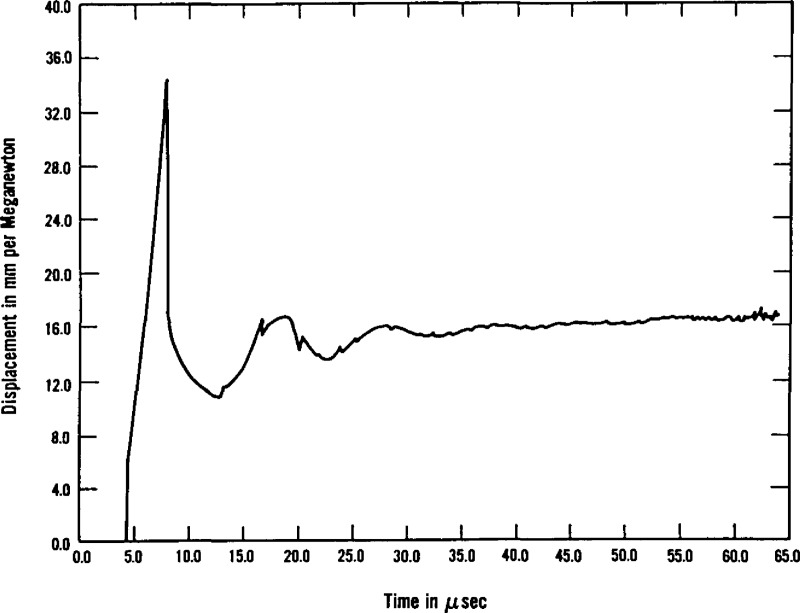
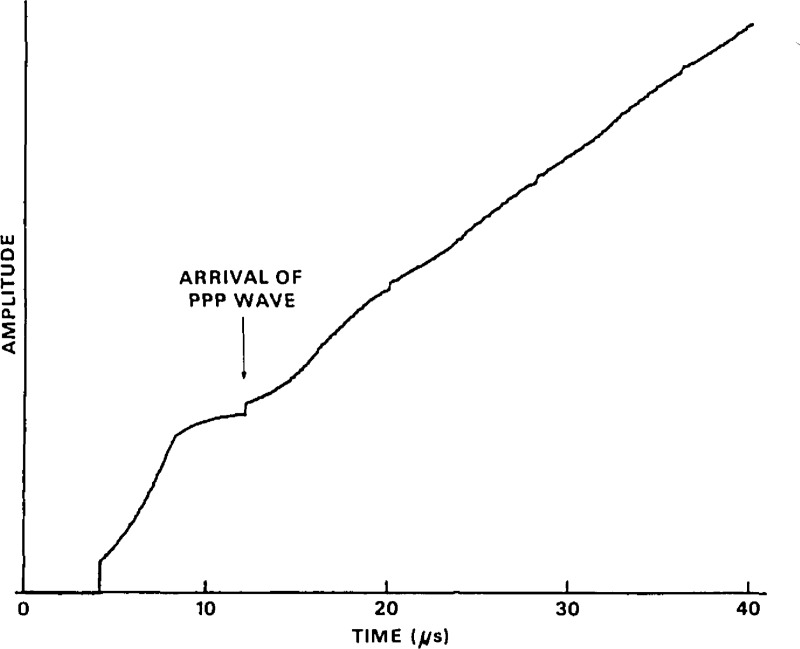
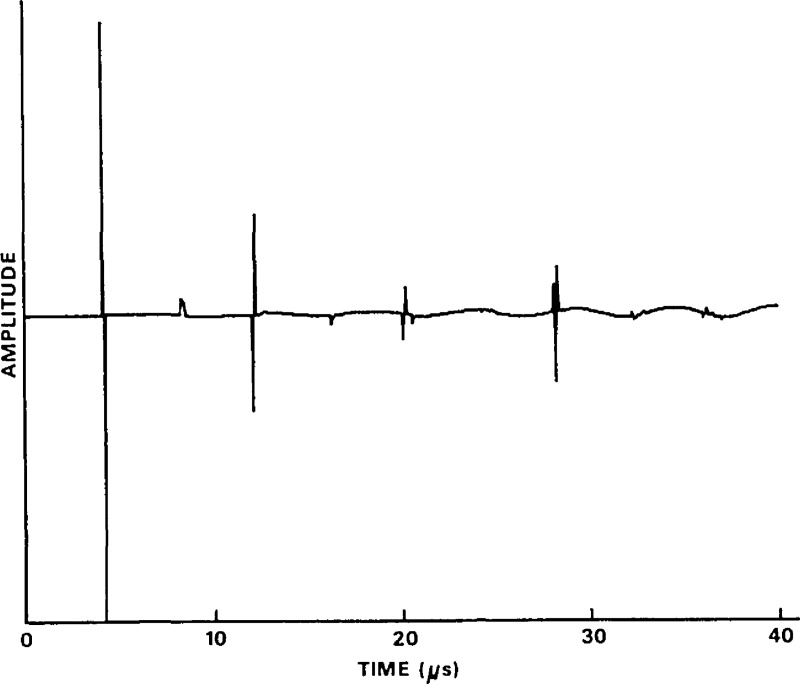
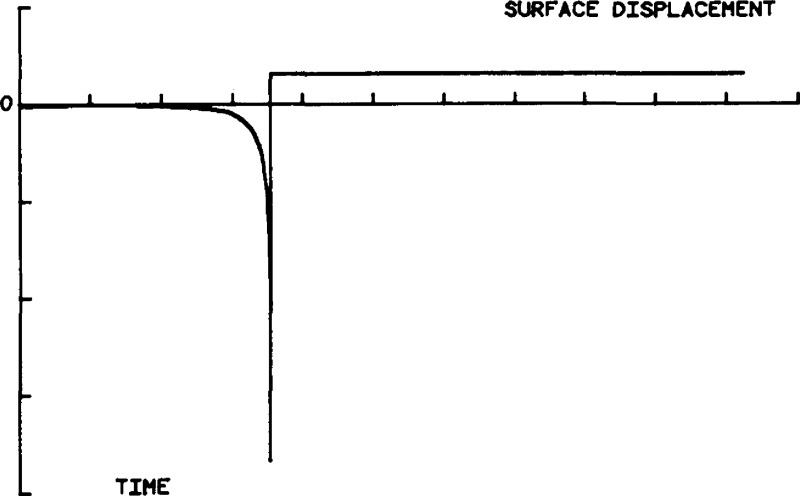
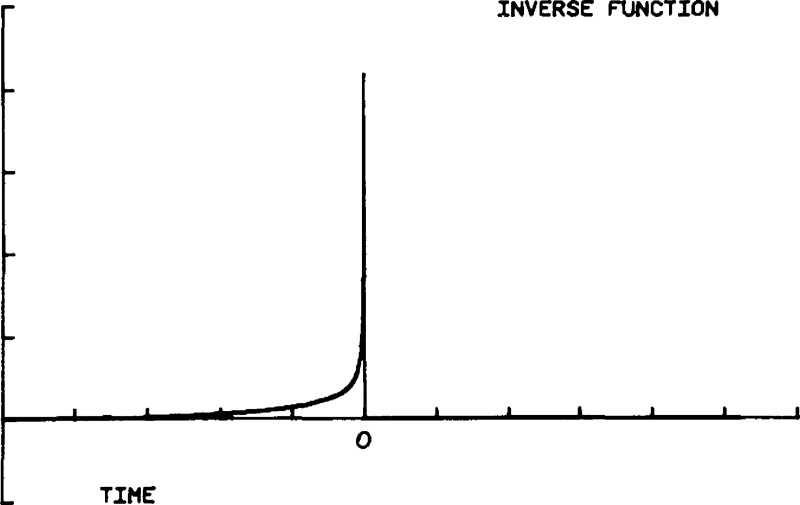
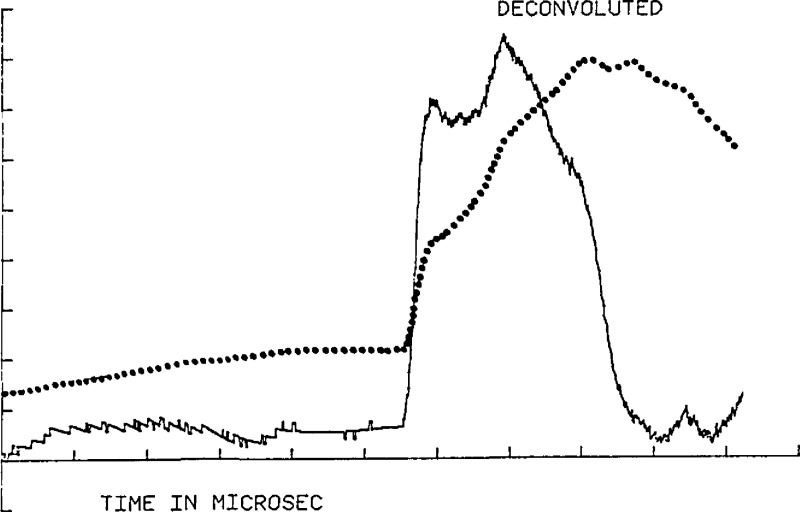
where H=(GH)−1 Shown in figures 31 and 32 are plots of GH(t) and H(t) corresponding to an aluminum plate with a shear wave speed to longitudinal wave speed ratio of 0.487. The vertical scale is relative. GH(t) is computed using the geometric ray method and H(t) is obtained by the matrix inversion technique outlined in [19]. The step curve shown in figure 33 is the convolved function plotted to show the numerical stability of the computations.
Figure 31.
Theoretical vertical displacements at the epicenter. GH(t)—due to a vertical force of step-function time dependency.
Figure 32.
H(t)—inverse function of GH(t).
Figure 33.
Convolution of the step-function response curve GH(t) with the inverse function H(t), the inpulse response.
Two key elements of the procedure are being able to 1) measure a physical quantity such as normal displacement (uncorrupted by horizontal displacements), and 2) determine the inverse Heaviside Green’s function. We have shown how, with care, this displacement can be accurately measured. In the case of the plate with source and receiver at epicenter, the computation of the inverse Green’s function is rather straightforward. In general, however, not every time series has an inverse with respect to convolution; whether a specific time series, in our case a specific Green’s function, has an inverse or not cannot be answered in general and it is this problem on which much of the ongoing research is focused. We have found, however, that in a second configuration, where the sensor and source are on the same surface and are sufficiently close, the inverse function can again be computed. But it is necessary to resort to the trick of reversing the time, computing the inverse, and reversing the time again. Examples of such computations are shown as figures 34 and 35.
Figure 34.
Theoretical vertical surface displacement for a point nearby and on the same surface as the source. GH(t)—due to a vertical step-function force.
Figure 35.
H(t)—inverse function for GH(t) for a point on the same surface as the source.
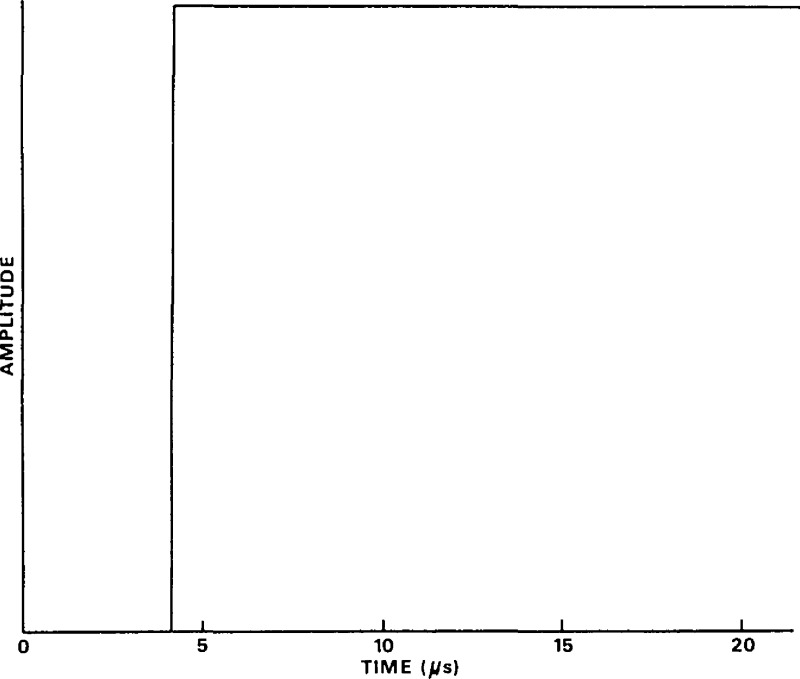
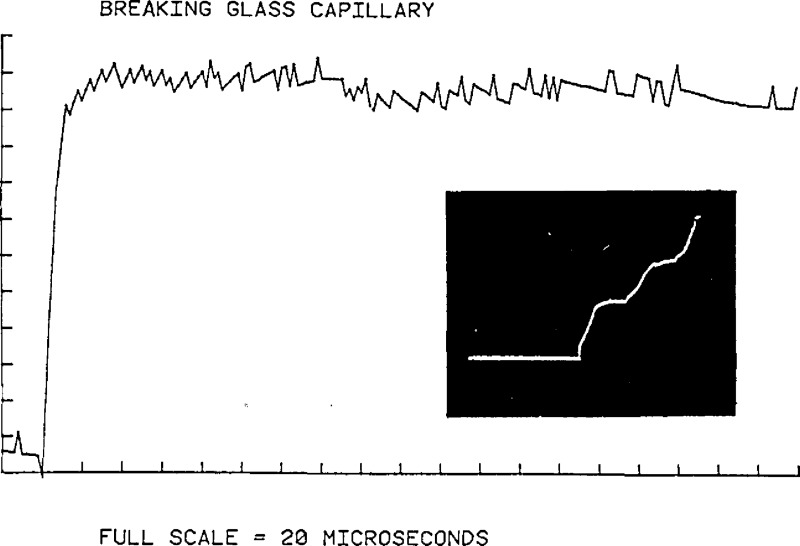
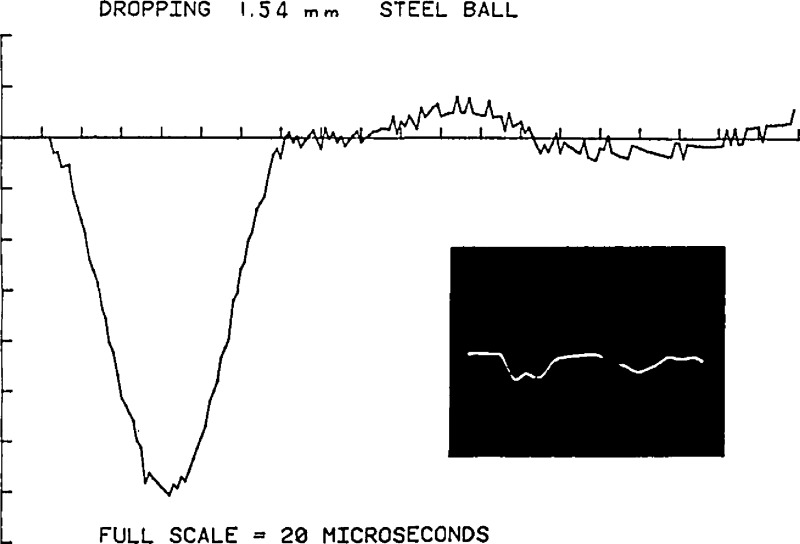
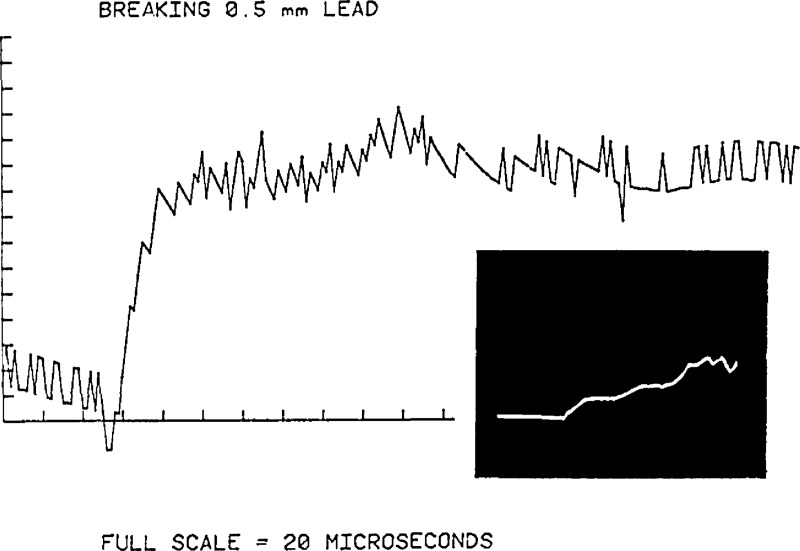
Having established the validity of the theoretical calculation and experimental devices, we may substitute unknown components one at a time into the experiment, and determine their characteristics. Thus this procedure may be used to determine the source function, Green’s tensor or transducer response. The data processing outlined above and detailed in [18,19] was used to determine simulated AE sources. Results are shown in figures 36 through 38 [18]. The inserts in the figures are the actual epicenter displacements detected by a capacitive transducer for various sources. A theoretically computed impulse response for the plate was used in this computation. It is found that the force time history produced by a breaking glass capillary is, indeed, a step-function with a rise time <0.5 μs. The source function for the breaking pencil lead has a small yet noticeable dip before the step. This is interpreted as due to the reflection of the fracture wave at the contact point. The remotely measured displacement and deconvolved force-time history shown in figure 38 was produced by dropping a steel ball onto a plate. The dropping ball contact source function deduced compares well with elasticity theory. Deconvolution was also performed on displacements measured during an actual cracking event. Acoustic emission signals induced by indenting a glass plate were recorded and deconvolved (see fig. 39). The source signatures of such brittle fractures resemble a step function at least for the initial part of the waveform.
Figure 36.
Source force-time function of breaking glass capillary obtained by time domain deconvolution of recorded epicenter displacement. Insert trace is the recorded epicenter displacement.
Figure 38.
Force-time function for a source produced by dropping a 1.5 mm steel ball from a height of 5 cm onto a plate.
Figure 39.
Source function for a brittle crack opening produced by indenting a glass plate.
Figure 37.
Source force-time function of breaking 0.5 mm pencil lead. Insert trace is the recorded epicenter displacement.
No data smoothing procedure was used for the computations; thus noise sources introduced by the measurement and deconvolution procedures could be investigated. As was expected, the limited resolution (8-bit) of the analog/digital conversion process during waveform recording caused noise in these computations, especially when the full dynamic range of the A/D was not utilized. The usual noise suppression scheme for repetitive signals of summing and averaging is inappropriate for AE source characterization because each is a unique event. However, it can be used for determining the other unknowns in an AE system. The signal averaging technique has been used, for example, for characterizing the force-time function of a wideband piezoelectric transducer excited by a short-duration electrical pulse [1]. This application offers a possible absolute calibration technique for ultrasonic transducers used as ultrasound generators for nondestructive testing.
While considerable success has been achieved in deconvolution of the waveforms shown above, the same cannot be said for the waveforms encountered in practice using sensitive, but narrow-band resonant receivers located remotely from the source. The requirement to deconvolve these complicated signals in the presence of noise has stimulated ongoing research into the development and application of inverse methods.
Simmons [20] and Simmons and Leary [21] have developed two new methods for inverse modeling. One technique is based upon the singular value decomposition method. The second is based upon z-transforms. The algorithms developed from this work have proved to have sufficient flexibility to optimize filtering in such a way as to use only the data with acceptable signal-.noise value. These techniques show promise that many more source-detector geometrical arrangements may be amenable to deconvolution. However, they are complicated and require excessive computing capacity to implement. They are useful for laboratory studies but more simple techniques may be called for in field applications.
8. Summary
In the mid-1970’s it was realized that acoustic emission techniques possessed great potential for determining and monitoring structural integrity. Acoustic emission signals were thought to contain potentially useful information about the location and identity of defects and about the criticality of the defects in a structure under load. However, the signal reception methods failed to preserve much of this information, and signal processing techniques used then, such as threshold counting, RMS recording, energy measurement, peak detection, and spectral analysis, did not extract the remaining information unambiguously. Acoustic emission was thus unable to fulfill its early promise, in part because of the inherent complexity of 1) the generating mechanisms, 2) the transient wave propagation details, and 3) the physics of the mechanical-to-electrical conversion process of the sensor. In other words, there was insufficient basic understanding of the acoustic emission phenomenon in solids.
The reviewed research program along with parallel efforts elsewhere have done much to remedy the situation. Particularly noteworthy contributions which help remove the impediments to the optimal application of acoustic emission techniques have included the development of:
A theoretical framework for investigating and analyzing the acoustic emission process.
Theoretical methods for predicting the surface motion due to an acoustic emission event.
Calibration methods and standards that currently are being adopted on a worldwide basis and are leading to data interchangeability and improved reliability of field data.
A transducer for measuring the normal component of surface motion with high sensitivity and fidelity, a tool necessary for advanced signal processing; and finally, the development of
Inverse techniques for processing the remotely measured signals to extract maximum information about the acoustic emission source.
These and other developments are now being embodied in laboratory and field studies and in test methods, instruments, and analysis methods used in field applications. Acoustic emission is becoming, by NDE standards, a relatively well understood phenomenon. But research needs are far from satisfied. It is becoming increasing apparent that:
Signal analysis methods should be developed for field applications where only limited, noisy data are available and source significance must be determined quickly.
Inverse techniques for more complex geometries and materials must be developed.
More realistic models of the sources themselves, going beyond those of a microcrack under uniform loading, are required.
Additional transducer developments, e.g., for transverse surface motion, are required. The calibration methods already developed provide the essential tools for this.
It is hoped that such research, in conjunction with increasing practical experience, will result in a successful transition from adolescence to maturity for this important NDE technique.
Acknowledgments
We wish to acknowledge the help and encouragement of our colleagues, F. Breckenridge, N. Hsu, T. Proctor, R. Clough, J. Simmons, and C. B. Scruby in preparing this review of their contributions to acoustic emission of the past decade. We also acknowledge J. Willis (University of Bath) who made important contributions to the NBS program on AE while visiting the Bureau.
Biography
About the Authors, Paper: D. G. Eitzen is leader of the Ultrasonic Standards Group in the Mechanical Production Metrology Division, part of the NBS Center for Manufacturing Engineering, while H. N. G. Wadley leads the Nondestructive Characterization Group in the Metallurgy Division, NBS Center for Materials Science. The program on which they report was jointly sponsored by NBS and the Electric Power Research Institute. Additional support was received from the Office of Naval Research.
Footnotes
Figures in brackets refer to references at the end of this paper.
Capped subscript indices refer to space-time variables and uncapped indices refer to space variables (j,k, etc.= 1,2,3).
For example, the attendees of the U.S. Acoustic Emission Working Group, San Antonio, TX, April 1975, arrived at a consensus on this point.
References
- [1].Hsu N.; Simmons J. A.; Hardy S. An approach to acoustic emission signal analysis—Theory and experiment. Matls. Eval. 35: 100–106; 1977. [Google Scholar]
- [2].Eitzen D.; Breckenridge F.; Clough R.; Fuller E.; Hsu N.; Simmons J. Fundamental developments for quantitative acoustic emission measurements. Electric Power Research Institute Report EPRI NP-2084. Palo Alto, CA; 1981. 1–219. [Google Scholar]
- [3].Green A. T.; Lockman C. S.; Steele R. K. Modern PLastics. 41: 137; 1964. [Google Scholar]
- [4].Kaiser J. Arkiv fur das Eisenhuttenwessen. 24: 43; 1953. [Google Scholar]
- [5].Spanner J. C. Advances in acoustic emission. Dunhart: U.S.A.; 1981. p. 1. [Google Scholar]
- [6].Sachse W.; Hsu N. Ultrasonic transducers for materials testing and their characterization, in Physical acoustics, Vol. 14 Mason W. P. and Thurston R., eds. New York: Academic Press; 1979. 277–406. [Google Scholar]
- [7].Nabarro F. R. N. The synthesis of elastic dislocation fields. Philos. Mag. 42: 1224–1231; 1951. [Google Scholar]
- [8].Mura T. Continuous distributions of moving dislocations. Philos. Mag. 8: 843–857; 1963. [Google Scholar]
- [9].Malen K.; Bolin L. A theoretical estimate of acoustic emission stress amplitudes. Phys. Stat. Sol. (b) 61: 637–645; 1974. [Google Scholar]
- [10].Freund L. B. The analysis of elastodynamic crack tip stress fields, in Mechanics today, Vol. 3 Namat-Nasser S., ed. New York, NY: Pergamon Press; 1976. 55–91. [Google Scholar]
- [11].Aki K.; Richards P. G. Quantitative seismology. San Franciseo: W. H. Freeman; 1980. [Google Scholar]
- [12].Rice J. R. The mechanics of earthquake rupture Proc. Int. School of Physics “Enrico Fermi,” Italian Physical Society, Course LXXVIII (Varenna on Lake Como, Italy, 1979) on Physics of the Earth’s Interior, Boschi E., ed. North-Holland Publ. Co. (expected publication 1980–81). [Google Scholar]
- [13].Stephens R. W. B.; Pollock A. A. Waveforms and frequency spectra of acoustic emission. J. Acoust. Soc. Am. 50: 904–910; 1971. [Google Scholar]
- [14].Tatro C. A. Design criteria for acoustic emission experimentation, in Acoustic emission, ASTM STP 505, Philadelphia, PA: American Society for Testing and Materials; 1972. [Google Scholar]
- [15].Simmons J. A.; Clough R. B. Theory of acoustic emission, in Proc. Int. Conf. Dislocation Modeling Physical Systems. Hirth J. and Ashby M, eds. Scripta Metall.; 1981. [Google Scholar]
- [16].Clough R. B.; Simmons J. A. Reproducible acoustic emission signatures by indentation in steels. Mater. Eval. 39: 1026–1031; 1981. [Google Scholar]
- [17].Wadley H. N. G.; Scruby C. B.; Shrimpton G. Quantitative acoustic emission source characterization. Acta Metall. 29: 399; 1981. [Google Scholar]
- [18].Hsu N.; Hardy S. C. Experiments in acoustic emission waveform analysis for characterization of AE sources, sensors, and structures, in Elastic waves and nondestructive testing of materials, AMD-Vol. 29. Pao Y. H., ed. New York: The American Society of Mechanical Engineers; 1978. 85–106. [Google Scholar]
- [19].Hsu N.; Eitzen D. AE signal analysis—Laboratory experiments examining the physical processes of acoustic emission. Proc. Fifth Int. Acoustic Emission Symp., Tokyo: Japanese Society for NDI; 1980. 67–78. [Google Scholar]
- [20].Simmons J. New methods for deconvolution and signature analysis of causal and transient time series. Submitted to IEEE, 1984. [Google Scholar]
- [21].Simmons J.; O’Leary D. SIAM J. Sci. Stat. Comput. 2: 474–489; 1981. December. [Google Scholar]
- [22].Wadley H. N. G.; Scruby C. B.; Speake J. Int. Metall. Rev. 3: 41; 1980. [Google Scholar]
- [23].Scruby C. B.; Jones C.; Titchmarsh J. M.; Wadley H. N. G. Metall. Sci. 15: 241; 1981. [Google Scholar]
- [24].Scruby C. B.; Wadley H. N. G.; Sinclair J. E. Philos. Mag. A44: 240; 1981. [Google Scholar]
- [25].Titchmarsh J. M.; Bartlett A. F.; Druce S. G. AERE-R9674. 1980. [Google Scholar]
- [26].Wadley H. N. G.; Scruby C. B.; Lane P.; Hudson J. A. AERE-R9945. 1981. [Google Scholar]
- [27].Gopal R.; Smith J. R.; Rao C. U. Proc. Inst. Mech. Eng. c 194/76, p. 1; 1976. [Google Scholar]
- [28].Scruby C.; Wadley H. An assessment of acoustic emission for nuclear pressure vessel monitoring. Nucl. Eng. 11: 275–297; 1983. [Google Scholar]
- [29].Wadley H. N. G.; Scruby C. B. AERE-R10351. 1981. [Google Scholar]
- [30].Wadley H. N. G.; Furze D. C.; Scruby C. B.; Eyre B. L. Metal Sci. 13: 451; 1979. [Google Scholar]
- [31].McIntyre P.; Green G. Br. J. NDT 20: 135; 1978. [Google Scholar]
- [32].Simmons J. A.; Willis J. R.; Hsu N. N. The dynamic Green’s tensor for an elastic plate. In preparation.
- [33].Pao Y. H.; Gajewski R. R.; Ceranoglu A. N. Acoustic emission and transient waves in an elastic plate. J. Acoust. Soc. Am. 65: 96–105; 1979. [Google Scholar]
- [34].Muller G. Theoretical seismograms for some types of point-sources in layered media. Part II: Numerical calculations. Z. fur Geophysik 34: 147–162; 1968. [Google Scholar]
- [35].Pao Y. H.; Gajewski R. R. The generalized ray theory and transient responses of layered elastic solids, in Physical acoustics, Thurston R. N., ed. Vol. XIII: New York, NY: Academic Press; 1977. [Google Scholar]
- [36].Hsu N.; Breckenridge F. Characterization and calibration of acoustic emission sensors. Mater. Eval. 39: 60–68; 1981. [Google Scholar]
- [37].Simmons J. A.; Wadley H. N. G. Vector transducer calibration. Review of progress in quantitative NDE. Santa Cruz. 1983. To be published. [Google Scholar]
- [38].Breckenridge F. R.; Tschiegg C. E.; Greenspan M. Acoustic emissions: Some applications of Lamb’s problem. J. Acoust. Soc. Am. 57: 626–631; 1975. [Google Scholar]
- [39].Breckenridge F. Acoustic emission transducer calibration by means of the seismic surface pulse. J. Acoustic Emission 1: 87–94; 1982. [Google Scholar]
- [40].Breckenridge F.; Greenspan M. Surface-wave displacement: Absolute measurements using a capacitive transducer. J. Acoust. Soc. Am. 68: 1177–1185; 1981. [Google Scholar]
- [41].Proctor T. Improved piezoelectric transducer for acoustic emission reception. J. Acoust. Soc. Am. Suppl. 1, 68: 568; 1980. [Google Scholar]
- [42].Proctor T. An improved piezoelectric acoustic emission transducer. J. Acoust. Soc. Am. 71: 1163–1168; 1982. [Google Scholar]
- [43].Proctor T. Some details on the NBS conical transducer. J. Acoustic Emission 1 173–178; 1982. [Google Scholar]
- [44].Proctor T. Breckenridge F.; Pao Y. Transient waves in an elastic plate: Theory and experiment compared. J. Acoust. Soc. Am. 75(1): 1984. [Google Scholar]
- [45].Hsu N. Acoustic emission simulator. U.S. Patent 4018084 assigned to Lockheed Aircraft Corporation, Burbank, CA, May 1976.
- [46].Wadley H. N. G.; Simmons J. A. Review of progress in quantitative NDE, Santa Cruz; 1983; to be published. [Google Scholar]
- [47].Jones M.; Green R.; Hsu N. Comparison of simulated acoustic emission sources. Proc. Ultrasonics Int. 1983. [Google Scholar]


