

ABSTRACT
The protective effects of lower body subcutaneous adiposity are linked to the depot functioning as a ”metabolic sink” receiving and sequestering excess lipid. This postulate, however, is based on indirect evidence. Mechanisms that mediate this protection are unknown. Here we directly examined this with progressive subcutaneous adipose tissue removal. Ad libitum chow fed mice underwent sham surgery, unilateral or bilateral removal of inguinal adipose tissue or bilateral removal of both inguinal and dorsal adipose tissue. Subsequently mice were separated into 5 week chow or 5 or 13 week HFD groups (N = 10 per group). Primary outcome measures included adipocyte distribution, muscle and liver triglycerides, glucose tolerance, circulating adipocytokines and muscle insulin sensitivity. Subcutaneous adipose tissue removal caused lipid accumulation in femoral muscle proximal to excision, however, lipid accumulation was not proportionally inverse to adipose tissue quantity excised. Accumulative adipose removal was associated with an incremental reduction in systemic glucose tolerance in 13 week HFD mice. Although insulin-stimulated pAkt/Akt did not progressively decrease among surgery groups following 13 weeks of HFD, there was a suppressed pAkt/Akt response in the non-insulin stimulated (saline-injected) 13 week HFD mice. Hence, increases in lower body subcutaneous adipose removal resulted in incremental decreases in the effectiveness of basal insulin sensitivity of femoral muscle. The current data supports that the subcutaneous depot protects systemic glucose homeostasis while also protecting proximal muscle from metabolic dysregulation and lipid accumulation. Removal of the “metabolic sink” likely leads to glucose intolerance because of decreased storage space for glucose and/or lipids.
KEYWORDS: metabolic sink, lipectomy, subcutaneous adipose tissue, visceral adipose tissue, adipose tissue distribution, triglyceride, muscle
Introduction
Obesity has steadily increased over the past 50 years with ~ 40% of Americans being obese (BMI> 30) today compared to only 14% in the 1960s.1 Obesity is linked to numerous co-morbidities including glucose intolerance, insulin resistance, dyslipidemia, and cardiovascular dysfunction, which are largely preventable.2,3 However, obesity is not an exclusive predictor of metabolic dysregulation. For example, some obese individuals maintain insulin sensitivity, and have a reduced risk for type-2-diabetes, hypertension and heart disease,4–6 whereas others with seemingly normal adipose tissue levels develop these co-morbidities.7,8 Variations in fat distribution, in part, are suggested to mediate these risks.9 The apple-shaped (android) phenotype deposit adipose tissue in the upper body, this is otherwise known as visceral adiposity. In contrast, pear-shaped (gynoid) phenotype deposit fat subcutaneously beneath skin in the lower body gluteus-femoral region. These differing types of adipose tissue distribution have opposing metabolic outcomes in overweight and obese individuals.
Visceral adipose tissue is highly associated with metabolic disease, however other studies suggest that subcutaneous adipose tissue (SAT), or lack thereof, may be playing a contributory role.10 This postulate arises from the relative proportions that visceral and subcutaneous depots contribute to overall adiposity. Specifically, visceral adipose is merely ~ 10% of total adiposity whereas SAT accounts for ~ 85% total fat mass. There is evidence that lower body subcutaneous adipose tissue (LBSAT) accumulation is protective relative to visceral. It is postulated that LBSAT functions as a metabolic sink with enhanced ability, relative to visceral fat, to take up lipid from circulation and store it thereby protecting insulin sensitive tissues from ectopic deposition.10–12 Indeed, LBSAT storage is associated with increased glucose tolerance and insulin sensitivity.13 Additionally, SAT is positively associated with factors related to energy intake regulation (leptin, adiponectin) and negatively associated with inflammatory factors (IL-6, TNFα, MCP-1).10,14–17
Here we postulated that if subcutaneous adipose tissue is protective, then removal of these depots should have deleterious consequences. We have previously demonstrated in mice that removal of the protective lower body adipose depots, specifically inguinal WAT, by lipectomy resulted in systemic and muscle insulin resistance which was exacerbated by high fat diet (HFD).11 In the same study, chow and HFD fed mice with inguinal fat removal both experienced increases in muscle triglycerides. Metabolic outcomes of peripheral adipose tissue removal have also been examined in humans, but these studies have inherent experimental limitations due to variations in amount of adipose tissue removed, study duration and age range.18–22 Yet, studies by Hernandez et al. support that subcutaneous adipose tissue is protective because its removal caused redistribution of lipids to the abdomen20 and worsened postprandial blood lipid concentration.23 Rodent research supports and extends findings in humans.24–33
The intent of this study was to systematically examine the hypothesis that peripheral adipose tissue promotes glucose homeostasis by protecting muscle from ectopic lipid accumulation, hence acting as a “metabolic sink”. We have previously demonstrated that the removal of lower body subcutaneous adipose tissue resulted in impairments in glucose tolerance and increased lipid accumulation in skeletal muscle.11 We proposed to utilize the subcutaneous lipectomy model to comprehensively examine the effects of peripheral adipose tissue both in relation to insulin-mediated regulation of glucose metabolism and non-adipose tissue lipid accumulation. We expanded on our initial observations by carrying out time course studies that included removal of varying amounts of peripheral adipose tissue. Our general strategy was to perform sham surgery, unilateral or bilateral removal of inguinal adipose tissue or bilateral removal of both inguinal and dorsal adipose tissue to evaluate the effects of this on glucose tolerance, adipose tissue compensation and non-adipose tissue lipid accumulation. We predicted that progressive peripheral adipose tissue removal would produce dose-dependent increases in non-adipose tissue lipid accumulation leading to an associated dose-dependent deterioration in systemic glucose tolerance.
Results
Fat pad removal, food intake, and body weight
Table 1 contains the amount of fat removed for each surgery group. The four surgery groups consisted of sham-operated surgery (Sham), Unilateral (Uni IngX) or Bilateral (Bi IngX) removal of inguinal adipose tissue, and Bilateral removal of both inguinal and dorsal adipose tissue depots (All). The Bi IngX group had approximately twice as much fat removed as the Uni IngX group (avg 224 vs. 110 mg), while the All (Bi IngX + Bi DorX) group had 3.5 times more adipose tissue removed as the Uni IngX group (avg 110 vs 381 mg). Amounts of adipose tissue recovered from excised depots were significantly smaller than untouched depots collected from respective sham controls (Supplemental Table S1; p ≤ 0.05). Average weekly food intake was not different among any of the surgical groups, however final body weight was significantly lower in ALL HFD 13 week mice compared with respective Sham control (Table 1; p = 0.016). Despite the large amount of subcutaneous adipose tissue removed, the mass of other non-excised adipose tissue, in general, did not change (Supplemental Table S1). However, adipocyte compensation (proliferation) can occur without significant increases in mass, thus we also measured adipocyte size and distribution. Adipose tissue distribution was only examined at 13 weeks because this is the typical time point where adipocyte compensation is complete.25–33 Specifically, we measured distribution in intra-abdominal depots, visceral and epididymal, because of their high association with metabolic disease (Figure 1). Subcutaneous adipose tissue removal did not alter adipocyte number, average size or distribution in the visceral adipose depot. However, the epididymal adipose depot of mice with Bilateral inguinal removal had a significant decrease in total adipocyte number (Figure 1E; p = 0.02) that resulted from lower adipocyte numbers in all size bins, with significant decreases in the 45-54 ums and 55-64 um bins (Figure 1E; p ≤ 0.04).
Table 1.
Post Surgery Adipose Tissue Removal, Food Intake, and Body Weight. Adipose tissue removal accounted for ~ 20%, 40%, and 80% total subcutaneous adipose tissue. In general, food intake and body weight were not significantly different among surgery groups, with the exception of 13 week.
| Ctrl | Uni IngX | Bi IngX | All | p-value† | ||
|---|---|---|---|---|---|---|
| Adipose Tissue Removed (mg) | ||||||
| Chow | 5 wks | NA | 119.7 ± 11.4a | 219.4 ± 14.6b | 369.1 ± 21.9c | 0.0001 |
| HFD | 5 wks | NA | 104.0 ± 6.5a | 254.4 ± 24.8b | 401.5 ± 35.0c | 0.0001 |
| 13 wks | NA | 100.0 ± 6.7a | 211.7 ± 9.5b | 308.6 ± 24.6c | 0.0001 | |
| Average Weekly Food Intake (kcal) | ||||||
| Chow | 5 wks | 72.4 ± 2.5 | 76.7 ± 4.6 | 74.7 ± 1.8 | 75.4 ± 3.1 | 0.81 |
| HFD | 5 wks | 140.2 ± 3.3 | 143.9 ± 4.3 | 143.0 ± 3.6 | 146.0 ± 8.8 | 0.90 |
| 13 wks | 96.9 ± 2.5 | 95.7 ± 2.8 | 93.4 ± 1.9 | 94.3 ± 2.0 | 0.72 | |
| Final Body Weight (g) | ||||||
| Chow | 5 wks | 28.6 ± 0.5 | 29.2 ± 0.6 | 29.0 ± 0.7 | 28.2 ± 0.6 | 0.69 |
| HFD | 5 wks | 34.3 ± 1.5 | 34.7 ± 1.4 | 35.7 ± 1.6 | 33.0 ± 1.0 | 0.58 |
| 13 wks | 45.8 ± 1.0a | 43.4 ± 1.5a | 43.0 ± 1.0a | 42.1 ± 0.9b | 0.14 | |
†Single Factor ANOVA (factor: surgery group)
Values with a different letter are significantly different from each other (p ≤ 0.01)
Figure 1.
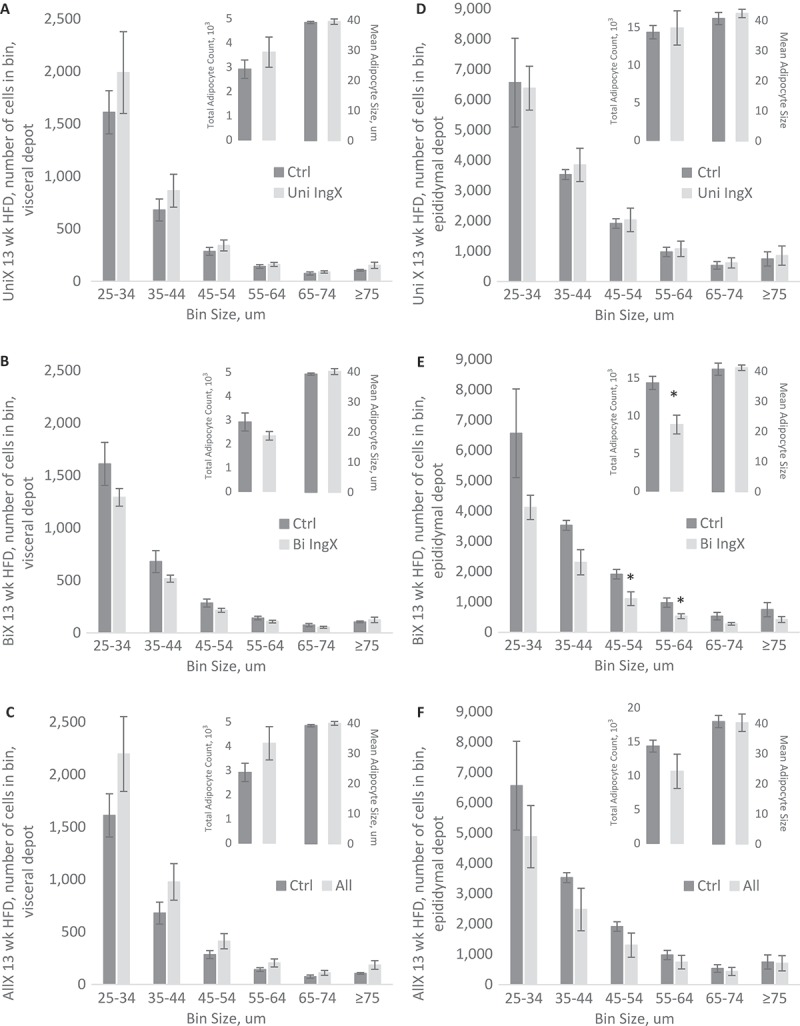
Adipocyte Cell Size and Abundance, 13 week HFD only: Intra-abdominal adipocyte size distribution. Specifically, adipocyte cell size as measured by adipocytes in specific cell size bin, total adipocyte number and mean adipocyte size. A-C) Visceral adipocyte distribution and mean were not altered by Unilateral, Bilateral or All adipose tissue removal. D-F) Unilateral and All removal did not alter distribution of Epididymal adipocytes, however Bilateral IngX did. Specifically, Bilateral IngX caused significant decreases in E) total adipocyte number (* p = 0.02) that resulted from lower adipocyte numbers in all size bins, with significant decreases in the 45-54 um and 55-64 um bins (* p ≤ 0.04).
Glucose and insulin measurements
Here we sought to comprehensively examine if subcutaneous adipose tissue was protective by determining if progressive removal would lead to an incremental decline in glucose tolerance. In general, surgery did not change fasting glucose or insulin concentration in chow or HFD fed mice (Table 2). In addition, adipose tissue removal in 5 week chow and HFD mice did not alter glucose tolerance. However, glucose intolerance was exacerbated in 13 week HFD mice with subcutaneous adipose tissue removed. Specifically, Bilateral removal of IWAT significantly increased glucose AUC compared with Sham Control (Figure 2C; p = 0.04). This difference was further exaggerated by the addition of dorsal adipose tissue removal causing the All removal group to have the largest significant difference in glucose AUC compared with Sham Control (Figure 2C; p = 0.0005). Insulin AUC was not altered by surgery in the 13 week HFD group (Figure 2C). The curves of the 13 week HFD glucose tolerance test and associated insulin response are available in Figure 1 of supplemental data.
Table 2.
Fasting Glucose and Insulin, Plasma Adipokines, and Liver TGs. Fasting glucose and insulin were not significantly different between surgery groups, except 5 week HFD bilateral inguinal removal had higher basal insulin levels. Resistin was lower in 5 week CHOW and 13 week HFD All removal groups. IL-6 was higher in 5 week CHOW Bi IngX and lower in 13 week HFD All groups compared to their respective controls. Liver TGs were lower in 13 week HFD All removal. All other circulating factors were not significantly different.
| Ctrl | Uni IngX | Bi IngX | All | p-value† | ||
|---|---|---|---|---|---|---|
| Fasting Glucose (mg/dl) | ||||||
| Chow | 5 wks | 112 ± 7.1 | 115 ± 9.8 | 120 ± 4.0 | 110 ± 6.7 | 0.79 |
| HFD | 5 wks | 122 ± 6.4 | 132 ± 4.5 | 137 ± 5.0 | 126 ± 9.1 | 0.38 |
| 13 wks | 133 ± 9.9 | 140 ± 6.9 | 134 ± 8.1 | 137 ± 5.9 | 0.92 | |
| Fasting Insulin (ng/dl) | ||||||
| Chow | 5 wks | 0.5 ± 0.06 | 0.6 ± 0.07 | 0.5 ± 0.04 | 0.5 ± 0.05 | 0.68 |
| HFD | 5 wks | 2.7 ± 0.44 | 3.5 ± 0.41 | 4.7 ± 0.68* | 3.1 ± 0.49 | 0.09 |
| 13 wks | 3.5 ± 0.54 | 2.6 ± 0.56 | 2.6 ± 0.52 | 2.6 ± 0.30 | 0.44 | |
| Leptin (pg/ml) | ||||||
| Chow | 5 wks | 723 ± 177 | 1,273 ± 561 | 1,329 ± 247 | 646 ± 51 | 0.32 |
| HFD | 5 wks | 16,548 ± 2,023 | 15,966 ± 1,508 | 22,550 ± 3,719 | 14,112 ± 5,077 | 0.37 |
| 13 wks | 26,106 ± 4,956 | 23,625 ± 1,408 | 25,859 ± 5,715 | 16,742 ± 5,736 | 0.50 | |
| Resistin (pg/ml) | ||||||
| Chow | 5 wks | 2,038 ± 93 | 1,949 ± 177 | 1,998 ± 95 | 1,625 ± 99** | 0.10 |
| HFD | 5 wks | 2,719 ± 339 | 3,228 ± 519 | 3,018 ± 489 | 2,379 ± 276 | 0.53 |
| 13 wks | 2,016 ± 382 | 1,446 ± 339 | 1,761 ± 215 | 1,053 ± 212* | 0.16 | |
| PAI1 tot (pg/ml) | ||||||
| Chow | 5 wks | 1,000 ± 319 | 1,559 ± 214 | 1,773 ± 384 | 1,488 ± 565 | 0.57 |
| HFD | 5 wks | 2,331 ± 296 | 2,696 ± 348 | 4,733 ± 1,311 | 2,201 ± 436 | 0.09 |
| 13 wks | 5,045 ± 1,610 | 4,914 ± 901 | 5,631 ± 1,703 | 3,567 ± 691 | 0.72 | |
| IL-6 (pg/ml) | ||||||
| Chow | 5 wks | 2.4 ± 0.7 | 2.6 ± 0.4 | 4.7 ± 0.7* | 4.4 ± 1.0 | 0.06 |
| HFD | 5 wks | 7.5 ± 0.4 | 9.5 ± 2.7 | 7.1 ± 1.4 | 6.6 ± 3.8 | 0.80 |
| 13 wks | 7.8 ± 0.9 | 8.5 ± 2.3 | 6.3 ± 0.7 | 4.3 ± 0.6** | 0.20 | |
| Liver TG (mg/g) | ||||||
| Chow | 5 wks | 21.0 ± 1.1 | 21.5 ± 1.1 | 20.7 ± 1.5 | 25.6 ± 1.6 | 0.13 |
| HFD | 5 wks | 133.8 ± 20.6 | 126.7 ± 11.2 | 132.5 ± 21.9 | 99.9 ± 15.4 | 0.62 |
| 13 wks | 293.7 ± 13.4 | 291.4 ± 27.2 | 304.7 ± 19.1 | 254.3 ± 7.7* | 0.36 | |
†Single Factor ANOVA (factor: surgery group)
*post hoc p < 0.05 compared with control group, ** p < 0.01
Figure 2.
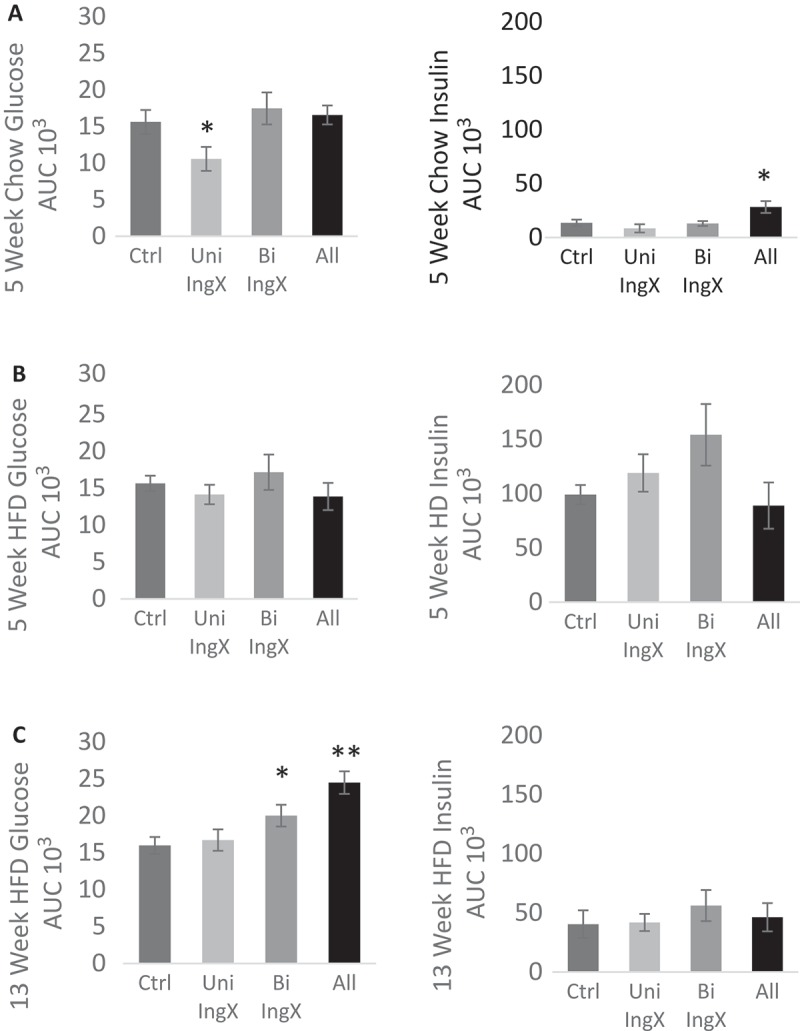
Glucose and Insulin Response: One week prior to termination. A 1.5 g/kg bolus of dextrose was injected (ip) and glucose measurements were made at 0, 15, 30, 45, 60, and 120 minutes. Insulin measurements were made at 0, 15, and 120 minutes. Area under the curve (AUC) represents the total glucose/insulin excursion from 0–120 minutes. A-B) Adipose tissue removal in 5 week chow and HFD mice did not alter glucose tolerance. C) Glucose intolerance was exacerbated in 13 week HFD mice with subcutaneous adipose tissue removed. Specifically, Bilateral removal of IWAT significantly increased glucose AUC compared with Sham Control (p = 0.04). This difference was further exaggerated by the addition of dorsal adipose tissue removal causing the All removal group to have the largest significant difference in glucose AUC compared with Sham Control (p = 0.0005). In general, Insulin AUC was not altered by subcutaneous adipose tissue removal.
Circulating factors (adipokines and cytokines)
Circulating adipokines and cytokines were measured to determine if glucose dysregulation following fat removal was associated with alterations in circulating factors (Table 2). In general, leptin, resistin, plasminogen activator inhibitor-1 (PAI1) and interleukin-6 (IL-6) were not affected by fat removal. Hence, despite the removal of large amounts of subcutaneous adipose tissue circulating adipocytokines did not change. This may be indicative of increased release of adipocytokines from non-excised adipose depots.
Liver and skeletal muscle triglycerides
Subcutaneous adipose tissue is proposed to be “protective” by way of functioning as a “metabolic sink”, thus we reasoned that fat removal might increase lipids in other tissues. Therefore, we measured liver and femoral muscle triglyceride concentration. Subcutaneous adipose tissue removal was not associated with increases in liver triglyceride concentration, in fact it was reduced with All removal in 13 week HFD (Table 2). In opposition, subcutaneous adipose tissue removal was associated with a significant increase in muscle triglyceride concentration. This occurred in the femoral muscle of 5 week HFD mice (Figure 3B, One-way ANOVA surgery effect; P = 0.036). Specifically, Unilateral (both removed and non-removed), Bilateral INGx and All removal caused a ~ 2 fold increase in femoral muscle triglycerides, however only the femoral muscle of the removed side in the Unilateral inguinal surgery was significantly greater (~ 3 fold) than the respective control (Figure 3B; p = 0.01). Femoral muscle triglyceride concentration from mice fed HFD for 13 weeks was not different among groups, with the exception of the muscle from the non-removed IWAT side from the Unilateral IngX. The muscle next to the non-excised adipose depot had significantly lower triglyceride concentration than its removed counterpart (Figure 3C; p = 0.005).
Figure 3.
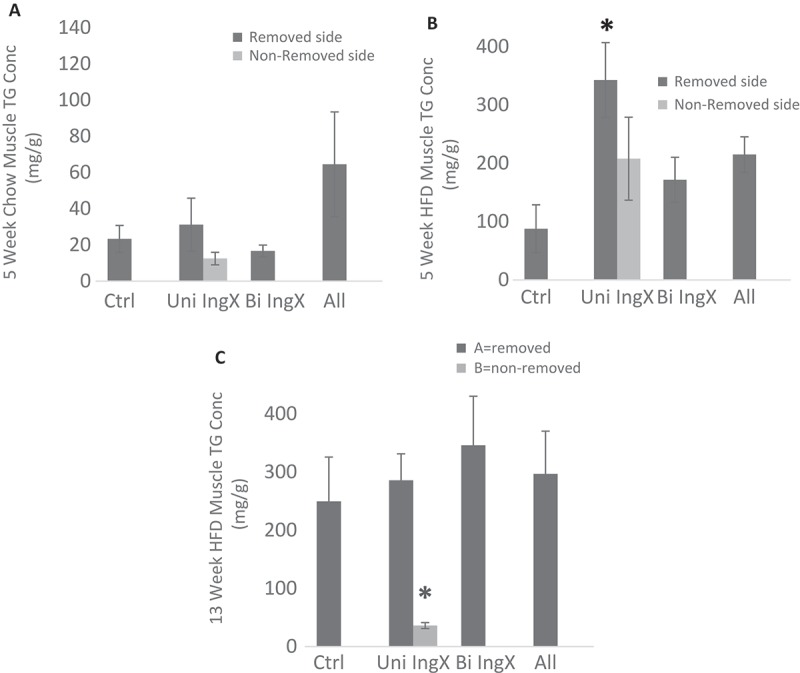
Femoral Muscle Triglyceride Concentration. Intramuscular triglycerides were measured in mg/g. For unilateral inguinal removal, muscles were measured separately for removed and non-removed side. Subcutaneous adipose tissue removal was associated with a significant increase in femoral muscle triglyceride concentration. B) This occurred in the femoral muscle of 5 week HFD mice (One-way ANOVA surgery effect; P = 0.036). Specifically, Unilateral (both removed and non-removed), Bilateral INGx and All removal caused a ~ 2 fold increase in femoral muscle triglycerides, however only the femoral muscle of the removed side in the Unilateral inguinal surgery was significantly greater (~ 3 fold) than the respective control (p = 0.01). C) Femoral muscle triglyceride concentration from mice fed HFD for 13 weeks was not different among groups, with the exception of the muscle from the non-removed IWAT side from the Unilateral IngX. The muscle next to the non-excised adipose depot had significantly lower triglyceride concentration than its removed counterpart (p = 0.005). A) 5 Week chow mice did not differ from controls.
Muscle insulin sensitivity
Subcutaneous adipose tissue removal in 13 week HFD mice exacerbated systemic glucose intolerance. Since muscle is a primary site of insulin-dependent glucose disposal, we examined femoral muscle insulin sensitivity to determine if it contributed to elevated systemic glucose. The means of graphs in Figure 4 represent the ratio pAkt/Total-Akt of insulin or saline injected mice following a 4 hour fast. In general, HFD reduced insulin-stimulated pAkt/Akt ratio compared with chow (p = 0.007, 5 week chow vs HFD insulin-injected controls). Although subcutaneous adipose tissue removal did decrease insulin sensitivity in some groups, a progressive reduction in insulin-stimulated pAkt was not seen with increases in subcutaneous adipose tissue removed at 5 or 13 weeks. Unexpectedly, the 13 week HFD All group had a significant increase in pAkt/Akt compared with respective controls (Figure 4C; p = 0.0001) making it the only surgical group to have any pAkt/Akt response to the insulin injection. Instead, effects of adipose tissue removal on pAkt/Akt measures predominately occurred in saline-injected mice. Adipose tissue removal caused a significant decrease in pAkt/Akt of the femoral muscle of saline-injected (basal) 13 week HFD mice (Figure 4C, One-way ANOVA surgery effect; p = 0.005). Specifically, the Unilateral (non-fat removed side) and Bilateral IWAT removal as well as the All group had significantly lower pAkt/Akt compared with control (Figure 4C; p = 0.004, p = 0.002, p = 0.003). Hence, the more adipose tissue removed the greater the significance when compared with the sham control.
Figure 4.
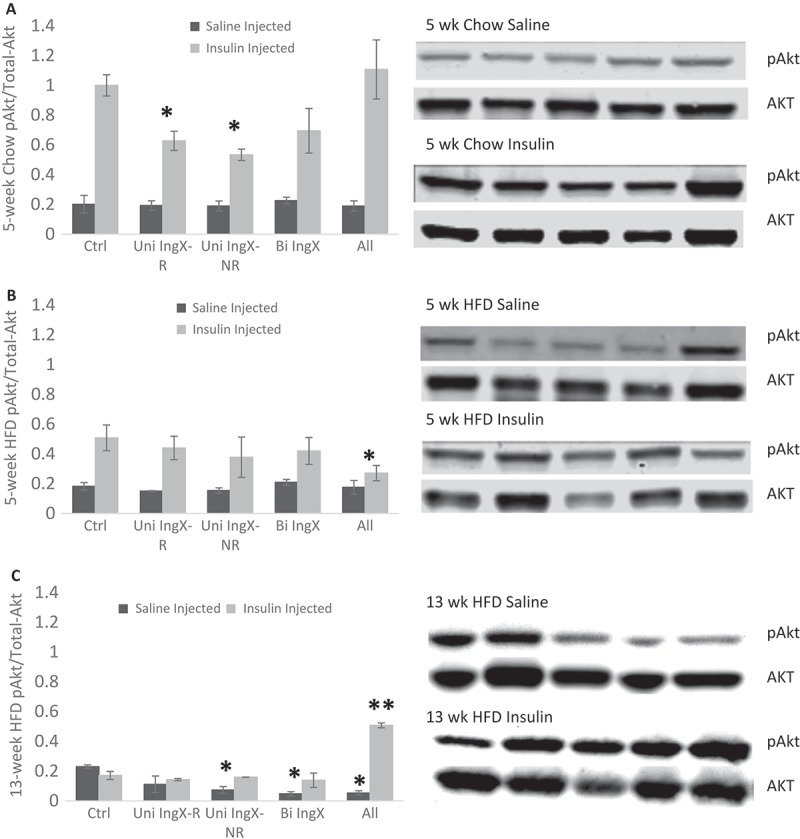
Femoral Muscle Insulin Sensitivity. The ratio of phosphorylated Akt to total Akt was used to measure muscle insulin sensitivity. For unilateral inguinal removal, muscles were measured separately for removed and non-removed side. Corresponding western blots are shown next to each graph. A-C) Subcutaneous adipose tissue removal did decrease insulin sensitivity in some groups, but a progressive reduction in insulin-stimulated pAkt did not occur at 5 or 13 weeks. C) The 13 week HFD All group had a significant increase in insulin stimulated pAkt/Akt compared with respective controls (p = 0.0001) making it the only surgical group to have any pAkt/Akt response to the insulin injection. Instead, effects of adipose tissue removal on pAkt/Akt measures predominately occurred in saline-injected mice. C) Adipose tissue removal caused a significant decrease in pAkt/Akt of the femoral muscle of saline-injected (basal) 13 week HFD mice (One-way ANOVA surgery effect; p = 0.005). Specifically, the Unilateral (non-fat removed side) and Bilateral IWAT removal as well as the All group had significantly lower pAkt/Akt compared with control (p = 0.004, p = 0.002, p = 0.003).
Discussion
Fat distribution is a major determinant of metabolic health. In particular, it is well established that central adiposity (intra- abdominal/visceral adipose tissue accumulation) is a risk factor for adverse metabolic outcomes, such as cardiovascular disease and type 2 diabetes.9,34 Yet, adipose tissue accumulated within lower body subcutaneous depots is not considered a risk for metabolic dysregulation. In opposition to central adiposity, accumulation of adipose tissue in the thighs, buttocks and hips is associated with protection from obesity risks such as impaired glucose tolerance and dyslipidemia.10 It is postulated that lower body subcutaneous adipose tissue functions as a “metabolic sink”. In support of this, we previously demonstrated that Bilateral removal of inguinal white adipose tissue (IWAT) resulted in glucose intolerance and decreased muscle insulin sensitivity.11 In the present study, we extend previous research to examine if progressive peripheral adipose tissue removal would produce dose-dependent deterioration in glucose tolerance and dose-dependent increases in non-adipose tissue lipid accumulation. The results of this study demonstrate that 20%-80% removal of subcutaneous adipose tissue in 13 week HFD mice induced a dose-dependent increase in glucose intolerance with an associated decrease in basal non-insulin stimulated femoral muscle pAkt/Akt. We postulate that these surgery-mediated outcomes demonstrate subcutaneous adipose tissue is protective via two distinct actions.
We previously demonstrated that lower body subcutaneous adipose tissue serves to protect muscle from excessive triglyceride deposition and ultimately helps to preserve whole body glucose homeostasis.11 We concluded that systemic glucose intolerance following inguinal adipose tissue removal resulted from an associated decrease in femoral muscle insulin sensitivity. In the present study, we utilized dose-dependent removal of subcutaneous adipose tissue to investigate if incremental adipose tissue removal resulted in cumulative metabolic dysregulation. Unilateral, Bilateral and All subcutaneous adipose tissue removal resulted in ~ 20%, 40% or 80% decrease in total subcutaneous depots. The present study supports and extends our previous observations11 that removal of subcutaneous adipose tissue disrupted systemic glucose regulation. This was best demonstrated in 13 week HFD mice, where increasing fat removal was associated with progressive worsening of glucose tolerance compared with 13 week HFD controls.
We next examined whether the metabolic sink concept could explain the progressive decline in glucose tolerance associated with incremental adipose tissue removal. In doing so, we first excluded several additional factors known to play a role in systemic glucose regulation. Specifically, incremental removal of subcutaneous adipose tissue in 13 week HFD mice was not associated with progressive alterations in food intake, adipose depot compensation, adipokines, cytokines or liver triglycerides. This is somewhat surprising with leptin concentration. Specifically, it is well characterized that leptin expression and release higher in subcutaneous depots compared with intra-abdominal depots.35–39 This indicates that large removal of subcutaneous adipose tissue, without substantial compensation of other adipose depots, may lead to a significant decrease in systemic leptin concentration. This, however, did not occur. One possible explanation is that subcutaneous adipose tissue removal causes leptin resistance. Indeed, others demonstrate that leptin resistance occurs in response to leptin withdrawal, especially following high dose leptin treatment.40 Therefore if subcutaneous adipose tissue is a fundamental contributor of circulating leptin perhaps its removal leads to a leptin resistance. This, however, remains to be elucidated. In total these measures demonstrate that the progressive increase in systemic glucose intolerance induced by adipose tissue removal was likely not due to factors such as 1) incremental increases in total dietary intake of carbohydrates, 2) compensatory growth of other adipose depots that are associated with metabolic disease, or 3) cumulative deposition of liver triglycerides which could additively contribute to exacerbation of glucose intolerance.
Our previous experiment demonstrated that subcutaneous fat removal caused ectopic fat accumulation in proximal muscle.11 Hence, removal of the “metabolic sink” resulted in reduced subcutaneous adipose tissue storage capacity.41 Previously we demonstrated an increase in femoral muscle triglyceride as early as 5 weeks post-Bilateral IWAT removal in both chow and HFD mice.11 Therefore, we concluded that the metabolic sink concept predicts that removal of adipose tissue will lead to ectopic fat accumulation. In the present study we systematically examined this in both the liver and muscle. Lipid accumulation did occur in the femoral muscle, however, it did not occur progressively as we had predicted. This indicates that muscle lipid accumulation, alone, does not explain the progressive reduction in systemic glucose tolerance or account for proportional amount of adipose tissue removed. Despite this, we do demonstrate that adipose depot removal-induced muscle triglyceride deposition is specific to the side of adipose tissue excision. In Uni IngX mice, the femoral muscle connected with adipose tissue does not accumulate lipids like the femoral muscle with the adipose tissue removed. This difference may be due to adipose depot released factors that modify muscle metabolism. Specifically, adiponectin is well characterized to regulate lipid metabolism in skeletal muscle by increasing beta-oxidation, catabolism of VLDL-TG, and myocyte mitochondrial biogenesis.42–45 This remains to be examined in this fat removal model. A caveat should be noted that the current study was limited in that we did not measure lipids in other targets that might affect glucose tolerance tissue such as other muscle tissues, heart, and circulation.
HFD-induced muscle triglyceride deposition increases serves as a marker for excess lipid supply and reduced utilization. Triglyceride accumulation is often associated with defects in muscle insulin signaling46,47 subsequently leading to insulin resistance.47–49 We postulated that subcutaneous adipose tissue removal-induced exacerbation of systemic glucose intolerance would be linked to insulin resistance in femoral muscle. Therefore, pAkt/Akt was measured to assess insulin sensitivity,50–52 both insulin-stimulated and non-insulin-stimulated. We previously demonstrated in 5 week HFD mice that the systemic glucose intolerance induced by subcutaneous adipose tissue removal was associated with reduced muscle insulin sensitivity.11 We therefore postulated that this association would also occur in 13 week HFD mice and be commensurate to the amount of subcutaneous adipose tissue removed. However insulin-stimulated pAkt/Akt did not progressively decrease among surgery groups following 13 weeks of HFD. The similarity among pAkt/Akt of insulin-stimulated mice was likely due to the lack of insulin response in the HFD control group at 13 weeks, making the assessment of a further reduction difficult. Unlike the other surgery groups and sham control, femoral muscle insulin sensitivity was increased in the All group. We postulate this heightened response to insulin may occur because of the additional bilateral removal of the dorsal subcutaneous adipose, but this is yet to be elucidated. Although surgery did not decrease insulin-stimulated pAkt/Akt, there was a suppressed pAkt/Akt response in the non-insulin stimulated (saline-injected) 13 week HFD mice. Here, increases in fat removal resulted in incremental decreases in basal insulin response. Some studies suggest that increases in basal pAkt in muscle are associated with muscle insulin resistance.53 Others support that diminished basal pAkt54 or decreased basal glucose uptake55 in muscle is associated with metabolic dysregulation independent of the insulin interaction. We speculate that these basal decreases in pAkt/Akt, in part, may be related to HFD-induced decreases in muscle contraction mediated AMPK56,57 because AMPK is demonstrated to activate the insulin signaling pathway independent of insulin binding.58–61
Taken together our data demonstrates that subcutaneous adipose tissue is protective. The current study, however, supports that the alterations in glucose tolerance associated with subcutaneous adipose tissue removal cannot fully be attributed to muscle insulin action. Hence, we postulate that the subcutaneous adipose tissue protects in multiple ways. The current data supports that the subcutaneous depot protects systemic glucose homeostasis while also inhibiting obesity-induced muscle pathophysiology. We predict systemic glucose intolerance following adipose tissue removal likely results from the lack of a “metabolic sink”, thus increases in fat removal result in decreased uptake and storage of glucose and/or lipids. However, previous studies investigating adipose tissue glucose disposal62,63 support that increases in circulating glucose are likely not an outcome of decreased glucose uptake by adipose tissue. Rather, we predict, that subcutaneous adipose tissue removal instigates increases in circulating glucose by way of increased circulating lipids. Specifically, progressive adipose tissue removal decreases storage of lipids, which leads to an increase in circulating lipids and reduces the use for glucose utilization.12,23,41 This postulate remains to be elucidated. Protective effects of subcutaneous adipose tissue towards proximal femoral muscle are likely a product of ectopic lipid storage, specifically types of lipids that may be stored. Follow up experiments should include characterization of lipids stored within muscle.
In conclusion, emerging research supports that visceral adiposity may be a consequence of dysregulated lipid storage within the subcutaneous adipose depot. This seems particularly intuitive because body fat is primarily comprised of subcutaneous adipose tissue. Hence, obesity-induced pathophysiology, indeed, may be due to limitations in the ability of the “protective metabolic sink” to store surplus lipids consequently leading to ectopic deposition into insulin sensitive tissues. Our data supports that subcutaneous adipose tissue plays a fundamental role in systemic glucose homeostasis and muscle metabolism.
Materials and methods
Mice and housing
Male C57BL/6 mice were purchased at 3 months of age from Jackson Laboratory (Bar Harbor, Maine) and were allowed to acclimate for one week. Mice were individually housed under controlled conditions (12:12 light-dark cycle, 50–60% humidity, and 25° C) and initially had access to ad libitum standard chow diet (chow:Harlan Teklad LM485, Madison, WI) with unlimited water. Chow diet was 3.1 kcal/g with 18% kcal from fat (6% by weight of diet). Following surgery, they either remained on standard chow diet or were given a high-fat, western style diet with 21% milk fat and 34% sucrose by weight, 4.6 kcal/g with 42% kcal from fat (Envigo TD.08811). Weekly body mass and food intake were monitored and recorded. Procedures were reviewed and approved by the Colorado State University Institutional Animal Care and Use Committee.
Surgery
Subcutaneous adipose tissue is located between the muscle and skin, predominately on top of the hind legs (inguinal depot) and upper back (dorsal depot). Surgeries were performed while mice were anesthetized with isoflurane and fat was accessed through a small mid-ventral incision. Sham surgery consisted of mid-ventral abdominal incision through skin only without adipose tissue removed. Lipectomy groups had ~ 80% fat excised from each depot removed, which accounted for ~ 20%, 40%, and 80% of total SAT for Uni IngX, Bi IngX, and All, respectively. Skin was closed with wound clips. A subcutaneous injection of meloxicam analgesic (0.025mg/10 g body weight) was given immediately after surgery was completed.
Glucose tolerance test
Pre-surgery (one week prior to adipose tissue removal surgery) and terminal (one week prior to termination) glucose tolerance tests (GTTs) were performed on mice. Mice were fasted, but allowed water, for 6 hours after lights on. Blood was collected from the tail vein and glucose concentration was determined using a Freestyle Lite Glucometer (Abbott, Abbott Park, IL). After fasting blood glucose was collected (time point 0) mice received a 1.5 g/kg dextrose injection in the intraperitoneal cavity and blood glucose was measured from tail vein blood samples at 15, 30, 45, 60 and 120 minutes post-injection. Additional blood was collected at time point 0, 15 and 120 minutes for insulin concentrations. Insulin concentrations were assessed using an Ultra-Sensitive Mouse Insulin Elisa Kit (Crystal Chem, Downers Grove, IL).
Termination
Final body weights were collected and mice were fasted for 4 hours before terminal collection. First, following isoflurane anesthetization, systemic blood was collected via decapitation and serum was separated and stored at – 80°C. Liver was removed and snap-frozen in liquid nitrogen and stored at – 80°C. Inguinal (IWAT), epididymal (EWAT), perirenal (PWAT), dorsal (DWAT), and visceral (VWAT) white adipose tissue, as well as inter-scapular brown adipose (BAT), were collected, weighed, snap-frozen, and stored at – 80°C. Subcutaneous lymph nodes were removed from IWAT and visceral lymph nodes were removed from VWAT prior to being frozen. Femoral muscles were also collected and snap-frozen and stored at – 80°C.
Plasma measurements
Systemic serum at termination was analyzed for insulin, leptin, resistin, tumor necrosis factor α (TNFα), monocyte chemotactic protein-1 (MCP-1), interleukin 6 (IL-6) and plasminogen activator inhibitor-1 (PAI-1 total) concentrations, determined using commercial kits (EMD Millipore Corporation, Billerica, MA) and analyzed on a Luminex instrument (LX200; Millipore, Austin, TX).
Tissue lipid measurements
Skeletal muscle and liver lipids were extracted using the procedure of Bligh and Dyer.64 Muscle and liver triglyceride concentration (Sigma Chemical Co, St. Louis, MO) were determined enzymatically using commercially available kits.
Adipocyte distribution
A sample of EWAT or VWAT was fixed in osmium tetroxide according to the method of Hirsch and Gallain.65 Fixation was completed in a warm water bath for at least 24 hours. Cell number and size distribution were determined by Coulter Counter analysis (Beckman Coulter, Fullerton, CA), as suspended particles are passed through an aperture in the counter to provide a histogram in per unit volume of suspension.
Protein concentration
Following a four-hour fast, mice were either injected (ip) with saline or insulin (1 mU/g; Lilly USA, LLC, Indianapolis, IN) and then terminated ~ 15 minutes later. Muscle insulin sensitivity was determined by the ratio of phosphoralated Akt (Ser 473) ((Abcam) Anti-Akt1 (phosphor S473) antibody [EP21094] ab81283, rabbit monoclonal) to total Akt. Protein ((Abcam) Anti-Akt1 antibody [9A4] ab89402, mouse monoclonal). Measurements were made using gel-based Western Blot procedures using both Odyssey Clx (Licor) and Chemiluminescence. Proteins were extracted from muscle tissue and separated based on size via SDS-PAGE. The divided proteins were transferred onto a PVDF membrane and the membrane is blocked from non-specific binding. Proteins of interest are identified with immunoassay using primary antibodies and visualized with secondary antibodies ((LiCor) IRDye 680RD Goat anti-Rabbit 926–68,171 and (LiCor) IRDye 800CW Goat anti-Mouse 827–08364). Quantification was done in Image Studio Lite (Licor) and ImageJ software.66
Statistical analysis
Adipocyte cell size in bins representing distribution was analyzed by repeated measures ANOVA with surgery type as between group factors. Total adipocyte count and mean size were analyzed with t-test. Area under the curve for glucose tolerance test and insulin response, muscle triglyceride concentration and information in tables were analyzed using an ANOVA. Surgery group had four factors (Control Sham, Uni IngX. Bi IngX, All). Last, pAKT/AKT was analyzed with a two-way ANOVA with diet (chow vs. HFD) and surgery (Control Sham, Uni IngX. Bi IngX, All) as factors. LSD was utilized as the ANOVA post-hoc analysis. Whenever possible, analyses were done separately for femoral muscle on side with fat removed and not-removed. Statistically significant differences among groups were recognized as having a p-value ≤ 0.05.
Funding Statement
This work was supported by the National Institute of Diabetes and Digestive and Kidney Diseases [R03DK099425].
Disclosure statement
No potential conflict of interest was reported by the authors.
Supplementary material
Supplementary data for this article can be accessed here.
References
- 1.Ogden CL, Carroll MD.. Prevalence of overweight, obesity, and extreme obesity among adults: United States, trends 1960–1962 through 2007–2008. National Center for Health Statistics. 2010;6(1):1–6. [Google Scholar]
- 2.Kopelman PG. Obesity as a medical problem. Nature. 2000;404(6778):635–643. [DOI] [PubMed] [Google Scholar]
- 3.Brown CD, Higgins M, Donato KA, Rohde FC, Garrison R, Obarzanek E, Ernst ND, Horan M. Body mass index and the prevalence of hypertension and dyslipidemia. Obes Res. 2000;8(9):605–619. [DOI] [PubMed] [Google Scholar]
- 4.Sims EA. Are there persons who are obese, but metabolically healthy? Metabolism. 2001;50(12):1499–1504. [DOI] [PubMed] [Google Scholar]
- 5.Reaven GM. Importance of identifying the overweight patient who will benefit the most by losing weight. Ann Intern Med. 2003;138(5):420–423. [DOI] [PubMed] [Google Scholar]
- 6.Ferrannini E, Natali A, Bell P, Cavallo-Perin P, Lalic N, Mingrone G. Insulin resistance and hypersecretion in obesity. European Group for the Study of Insulin Resistance (EGIR). J Clin Invest. 1997;100(5):1166–1173. [DOI] [PMC free article] [PubMed] [Google Scholar]
- 7.Voulgari C, Tentolouris N, Dilaveris P, Tousoulis D, Katsilambros N, Stefanadis C. Increased heart failure risk in normal-weight people with metabolic syndrome compared with metabolically healthy obese individuals. J Am Coll Cardiol. 2011;58(13):1343–1350. [DOI] [PubMed] [Google Scholar]
- 8.Succurro E, Marini MA, Frontoni S, Hribal ML, Andreozzi F, Lauro R, Perticone F, Sesti G. Insulin secretion in metabolically obese, but normal weight, and in metabolically healthy but obese individuals. Obesity (Silver Spring). 2008;16(8):1881–1886. [DOI] [PubMed] [Google Scholar]
- 9.Björntorp P. Metabolic implications of body fat distribution. Diabetes Care. 1991;14(12):1132–1143. [DOI] [PubMed] [Google Scholar]
- 10.Manolopoulos KN, Karpe F, Frayn KN. Gluteofemoral body fat as a determinant of metabolic health. Int J Obes (Lond). 2010;34(6):949–959. [DOI] [PubMed] [Google Scholar]
- 11.Cox-York K, Wei Y, Wang D, Pagliassotti MJ, Foster MT. Lower body adipose tissue removal decreases glucose tolerance and insulin sensitivity in mice with exposure to high fat diet. Adipocyte. 2015;4(1):32–43. [DOI] [PMC free article] [PubMed] [Google Scholar]
- 12.Frayn KN. Adipose tissue as a buffer for daily lipid flux. Diabetologia. 2002;45(9):1201–1210. [DOI] [PubMed] [Google Scholar]
- 13.Snijder MB, Dekker JM, Visser M, Yudkin JS, Stehouwer CDA, Bouter LM, Heine RJ, Nijpels G, Seidell JC. Larger thigh and hip circumferences are associated with better glucose tolerance: the Hoorn study. Obes Res. 2003;11(1):104–111. [DOI] [PubMed] [Google Scholar]
- 14.Montague CT, Prins JB, Sanders L, Digby JE, O’Rahilly S. Depot-and sex-specific differences in human leptin mRNA expression: implications for the control of regional fat distribution. Diabetes. 1997;46(3):342–347. [DOI] [PubMed] [Google Scholar]
- 15.Fisher F, McTernan PG, Valsamakis G, Chetty R, Harte AL, Anwar AJ, Starcynski J, Crocker J, Barnett AH, McTernan CL, et al. Differences in adiponectin protein expression: effect of fat depots and type 2 diabetic status. Hormone Metab Res. 2002;34(11/12):650–654. [DOI] [PubMed] [Google Scholar]
- 16.Panagiotakos DB, Pitsavos C, Yannakoulia M, Chrysohoou C, Stefanadis C. The implication of obesity and central fat on markers of chronic inflammation: the ATTICA study. Atherosclerosis. 2005;183(2):308–315. [DOI] [PubMed] [Google Scholar]
- 17.Ibrahim MM. Subcutaneous and visceral adipose tissue: structural and functional differences. Obes Rev. 2010;11(1):11–18. [DOI] [PubMed] [Google Scholar]
- 18.Mohammed BS, Cohen S, Reeds D, Young VL, Klein S. Long-term effects of large-volume liposuction on metabolic risk factors for coronary heart disease. Obesity (Silver Spring). 2008;16(12):2648–2651. [DOI] [PMC free article] [PubMed] [Google Scholar]
- 19.Hong YG, Kim HT, Seo SW, Chang CH, Rhee EJ, Lee WY. Impact of large-volume liposuction on serum lipids in orientals: a pilot study. Aesthetic Plast Surg. 2006;30(3):327–332. [DOI] [PubMed] [Google Scholar]
- 20.Hernandez TL, Kittelson JM, Law CK, Ketch LL, Stob NR, Lindstrom RC, Scherzinger A, Stamm ER, Eckel RH. Fat redistribution following suction lipectomy: defense of body fat and patterns of restoration. Obesity (Silver Spring). 2011;19(7):1388–1395. [DOI] [PubMed] [Google Scholar]
- 21.Gonzalez-Ortiz M, Robles-Cervantes JA, Cárdenas-Camarena L, Bustos-Saldaña R, Martínez-Abundis E. The effects of surgically removing subcutaneous fat on the metabolic profile and insulin sensitivity in obese women after large-volume liposuction treatment. Horm Metab Res. 2002;34(8):446–449. [DOI] [PubMed] [Google Scholar]
- 22.Giese SY, Bulan EJ, Commons GW, Spear SL, Yanovski JA. Improvements in cardiovascular risk profile with large-volume liposuction: a pilot study. Plast Reconstr Surg. 2001;108(2): 510–519. discussion 520-1. [DOI] [PubMed] [Google Scholar]
- 23.Hernandez TL, Bessesen DH, Cox-York KA, Erickson CB, Law CK, Anderson MK, Wang H, Jackman MR, Van Pelt RE. Femoral lipectomy increases postprandial lipemia in women. Am J Physiol Endocrinol Metab. 2015;309(1):E63–71. [DOI] [PMC free article] [PubMed] [Google Scholar]
- 24.Weber RV, Buckley MC, Fried SK, Kral JG. Subcutaneous lipectomy causes a metabolic syndrome in hamsters. Am J Physiol Regul Integr Comp Physiol. 2000;279(3):R936–43. [DOI] [PubMed] [Google Scholar]
- 25.Mauer MM, Harris RB, Bartness TJ. The regulation of total body fat: lessons learned from lipectomy studies. Neurosci Biobehav Rev. 2001;25(1):15–28. [DOI] [PubMed] [Google Scholar]
- 26.Mauer MM, Bartness TJ. Fat pad-specific compensatory mass increases after varying degrees of lipectomy in Siberian hamsters. Am J Physiol. 1997;273(6 Pt 2):R2117–23. [DOI] [PubMed] [Google Scholar]
- 27.Mauer MM, Bartness TJ. Temporal changes in fat pad mass and cellularity after lipectomy in Siberian hamsters. Physiol Behav. 1997;62(5):1029–1036. [DOI] [PubMed] [Google Scholar]
- 28.Mauer MM, Bartness TJ. Short-day-like body weight changes do not prevent fat pad compensation after lipectomy in Siberian hamsters. Am J Physiol. 1997;272(1 Pt 2):R68–77. [DOI] [PubMed] [Google Scholar]
- 29.Mauer MM, Bartness TJ. Photoperiod-dependent fat pad mass and cellularity changes after partial lipectomy in Siberian hamsters. Am J Physiol. 1996;270(2 Pt 2):R383–92. [DOI] [PubMed] [Google Scholar]
- 30.Mauer MM, Bartness TJ. A role for testosterone in the maintenance of seasonally appropriate body mass but not in lipectomy-induced body fat compensation in Siberian hamsters. Obes Res. 1995;3(1):31–41. [DOI] [PubMed] [Google Scholar]
- 31.Mauer MM, Bartness TJ. Body fat regulation after partial lipectomy in Siberian hamsters is photoperiod dependent and fat pad specific. Am J Physiol. 1994;266(3 Pt 2):R870–8. [DOI] [PubMed] [Google Scholar]
- 32.Hamilton JM, Wade GN. Lipectomy does not impair fattening induced by short photoperiods or high-fat diets in female Syrian hamsters. Physiol Behav. 1988;43(1):85–92. [DOI] [PubMed] [Google Scholar]
- 33.Dark J, Forger NG, Stern JS, Zucker I. Recovery of lipid mass after removal of adipose tissue in ground squirrels. Am J Physiol. 1985;249(1 Pt 2):R73–8. [DOI] [PubMed] [Google Scholar]
- 34.Kissebah AH, Krakower GR. Regional adiposity and morbidity. Physiol Rev. 1994;74(4):761–811. [DOI] [PubMed] [Google Scholar]
- 35.Van Harmelen V, Reynisdottir S, Eriksson P, Thörne A, Hoffstedt J, Lönnqvist F, Arner P. Leptin secretion from subcutaneous and visceral adipose tissue in women. Diabetes. 1998;47(6):913–917. [DOI] [PubMed] [Google Scholar]
- 36.Taksali SE, Caprio S, Dziura J, Dufour S, Calí AMG, Goodman TR, Papademetris X, Burgert TS, Pierpont BM, Savoye M, et al. High visceral and low abdominal subcutaneous fat stores in the obese adolescent: a determinant of an adverse metabolic phenotype. Diabetes. 2008;57(2):367–371. [DOI] [PubMed] [Google Scholar]
- 37.Montague CT, Prins JB, Sanders L, Digby JE, O’Rahilly S. Depot- and sex-specific differences in human leptin mRNA expression: implications for the control of regional fat distribution. Diabetes. 1997;46(3):342–347. [DOI] [PubMed] [Google Scholar]
- 38.Cnop M, Landchild MJ, Vidal J, Havel PJ, Knowles NG, Carr DR, Wang F, Hull RL, Boyko EJ, Retzlaff BM, et al. The concurrent accumulation of intra-abdominal and subcutaneous fat explains the association between insulin resistance and plasma leptin concentrations: distinct metabolic effects of two fat compartments. Diabetes. 2002;51(4):1005–1015. [DOI] [PubMed] [Google Scholar]
- 39.Yang X, Smith U. Adipose tissue distribution and risk of metabolic disease: does thiazolidinedione-induced adipose tissue redistribution provide a clue to the answer? Diabetologia. 2007;50(6):1127–1139. [DOI] [PubMed] [Google Scholar]
- 40.Montez JM, Soukas A, Asilmaz E, Fayzikhodjaeva G, Fantuzzi G, Friedman JM. Acute leptin deficiency, leptin resistance, and the physiologic response to leptin withdrawal. Proc Natl Acad Sci U S A. 2005;102(7):2537–2542. [DOI] [PMC free article] [PubMed] [Google Scholar]
- 41.Weber RV, Buckley MC, Fried SK, Kral JG. Subcutaneous lipectomy causes a metabolic syndrome in hamsters. Am J Physiol Regulatory, Integr Comp Physiol. 2000;279(3):R936–R943. [DOI] [PubMed] [Google Scholar]
- 42.Qiao L, Kinney B, Yoo HS, Lee B, Schaack J, Shao J. Adiponectin increases skeletal muscle mitochondrial biogenesis by suppressing mitogen-activated protein kinase phosphatase-1. Diabetes. 2012;61(6):1463–1470. [DOI] [PMC free article] [PubMed] [Google Scholar]
- 43.Goto T, Teraminami A, Lee J-Y, Ohyama K, Funakoshi K, Kim Y-I, Hirai S, Uemura T, Yu R, Takahashi N, et al. Tiliroside, a glycosidic flavonoid, ameliorates obesity-induced metabolic disorders via activation of adiponectin signaling followed by enhancement of fatty acid oxidation in liver and skeletal muscle in obese-diabetic mice. J Nutr Biochem. 2012;23(7):768–776. [DOI] [PubMed] [Google Scholar]
- 44.Yoon MJ, Lee GY, Chung -J-J, Ahn YH, Hong SH, Kim JB. Adiponectin increases fatty acid oxidation in skeletal muscle cells by sequential activation of AMP-activated protein kinase, p38 mitogen-activated protein kinase, and peroxisome proliferator-activated receptor alpha. Diabetes. 2006;55(9):2562–2570. [DOI] [PubMed] [Google Scholar]
- 45.Blüher M, Bullen JW, Lee JH, Kralisch S, Fasshauer M, Klöting N, Niebauer J, Schön MR, Williams CJ, Mantzoros CS. Circulating adiponectin and expression of adiponectin receptors in human skeletal muscle: associations with metabolic parameters and insulin resistance and regulation by physical training. J Clin Endocrinol Metab. 2006;91(6):2310–2316. [DOI] [PubMed] [Google Scholar]
- 46.Kruszynska YT, Worrall DS, Ofrecio J, Frias JP, Macaraeg G, Olefsky JM. fatty acid-induced insulin resistance: decreased muscle PI3K activation but unchanged Akt phosphorylation. J Clin Endocrinol Metabolism. 2002;87(1):226–234. [DOI] [PubMed] [Google Scholar]
- 47.Storlien LH, Jenkins AB, Chisholm DJ, Pascoe WS, Khouri S, Kraegen EW. Influence of dietary fat composition on development of insulin resistance in rats: relationship to muscle triglyceride and ω-3 fatty acids in muscle phospholipid. Diabetes. 1991;40(2):280–289. [DOI] [PubMed] [Google Scholar]
- 48.Kraegen EW, Clark PW, Jenkins AB, Daley EA, Chisholm DJ, Storlien LH. Development of muscle insulin resistance after liver insulin resistance in high-fat–fed rats. Diabetes. 1991;40(11):1397–1403. [DOI] [PubMed] [Google Scholar]
- 49.Pan DA, Lillioja S, Kriketos AD, Milner MR, Baur LA, Bogardus C, Jenkins AB, Storlien LH. Skeletal muscle triglyceride levels are inversely related to insulin action. Diabetes. 1997;46(6):983–988. [DOI] [PubMed] [Google Scholar]
- 50.Krook A, Roth RA, Jiang XJ, Zierath JR, Wallberg-Henriksson H. Insulin-stimulated Akt kinase activity is reduced in skeletal muscle from NIDDM subjects. Diabetes. 1998;47(8):1281–1286. [DOI] [PubMed] [Google Scholar]
- 51.Cho H, Mu J, Kim JK, Thorvaldsen JL, Chu Q, Crenshaw EB, Kaestner KH, Bartolomei MS, Shulman GI, Birnbaum MJ. Insulin resistance and a diabetes mellitus-like syndrome in mice lacking the Protein Kinase Akt2 (PKBβ). Science. 2001;292(5522):1728–1731. [DOI] [PubMed] [Google Scholar]
- 52.Saltiel AR, Kahn CR. Insulin signalling and the regulation of glucose and lipid metabolism. Nature. 2001;414(6865):799–806. [DOI] [PubMed] [Google Scholar]
- 53.Liu H-Y, Hong T, Wen G-B, Han J, Zuo D, Liu Z, Cao W. Increased basal level of Akt-dependent insulin signaling may be responsible for the development of insulin resistance. Am J Physiol Endocrinol Metab. 2009;297(4):E898–906. [DOI] [PMC free article] [PubMed] [Google Scholar]
- 54.Sajan MP, Acevedo-Duncan ME, Standaert ML, Ivey RA, Lee M, Farese RV. Akt-dependent phosphorylation of hepatic FoxO1 is compartmentalized on a WD40/ProF scaffold and is selectively inhibited by aPKC in early phases of diet-induced obesity. Diabetes. 2014;63(8):2690–2701. [DOI] [PMC free article] [PubMed] [Google Scholar]
- 55.Cuendet GS, Loten EG, Jeanrenaud B, Renold AE. Decreased basal, noninsulin-stimulated glucose uptake and metabolism by skeletal soleus muscle isolated from obese-hyperglycemic (ob/ob) mice. J Clin Invest. 1976;58(5):1078–1088. [DOI] [PMC free article] [PubMed] [Google Scholar]
- 56.Lindholm CR, Ertel RL, Bauwens JD, Schmuck EG, Mulligan JD, Saupe KW. A high-fat diet decreases AMPK activity in multiple tissues in the absence of hyperglycemia or systemic inflammation in rats. J Physiol Biochem. 2013;69(2):165–175. [DOI] [PMC free article] [PubMed] [Google Scholar]
- 57.O’Neill HM. AMPK and exercise: glucose uptake and insulin sensitivity. Diabetes Metab J. 2013;37(1):1–21. [DOI] [PMC free article] [PubMed] [Google Scholar]
- 58.Bertrand L, Ginion A, Beauloye C, Hebert AD, Guigas B, Hue L, Vanoverschelde J-L. AMPK activation restores the stimulation of glucose uptake in an in vitro model of insulin-resistant cardiomyocytes via the activation of protein kinase B. Am J Physiol Heart Circ Physiol. 2006;291(1):H239–50. [DOI] [PubMed] [Google Scholar]
- 59.Levine YC, Li GK, Michel T. Agonist-modulated regulation of AMP-activated protein kinase (AMPK) in endothelial cells. Evidence for an AMPK -> Rac1 -> Akt -> endothelial nitric-oxide synthase pathway. J Biol Chem. 2007;282(28):20351–20364. [DOI] [PubMed] [Google Scholar]
- 60.Jakobsen SN, Hardie DG, Morrice N, Tornqvist HE. 5ʹ-AMP-activated protein kinase phosphorylates IRS-1 on Ser-789 in mouse C2C12 myotubes in response to 5-aminoimidazole-4-carboxamide riboside. J Biol Chem. 2001;276(50):46912–46916. [DOI] [PubMed] [Google Scholar]
- 61.Jessen N, Pold R, Buhl ES, Jensen LS, Schmitz O, Lund S. Effects of AICAR and exercise on insulin-stimulated glucose uptake, signaling, and GLUT-4 content in rat muscles. J Appl Physiol. (1985)2003;94(4):1373–1379. [DOI] [PubMed] [Google Scholar]
- 62.Virtanen KA, Lönnroth P, Parkkola R, Peltoniemi P, Asola M, Viljanen T, Tolvanen T, Knuuti J, Rönnemaa T, Huupponen R, et al. Glucose uptake and perfusion in subcutaneous and visceral adipose tissue during insulin stimulation in nonobese and obese humans. J Clin Endocrinol Metabolism. 2002;87(8):3902–3910. [DOI] [PubMed] [Google Scholar]
- 63.Kraegen EW, James DE, Jenkins AB, Chisholm DJ. Dose-response curves for in vivo insulin sensitivity in individual tissues in rats. Am J Physiol. 1985;248(3 Pt 1):E353–62. [DOI] [PubMed] [Google Scholar]
- 64.Bligh EG, Dyer WJ. A rapid method of total lipid extraction and purification. Can J Biochem Physiol. 1959;37(8):911–917. [DOI] [PubMed] [Google Scholar]
- 65.Hirsch J, Gallian E. Methods for the determination of adipose cell size in man and animals. J Lipid Res. 1968;9(1):110–119. [PubMed] [Google Scholar]
- 66.Schneider CA, Rasband WS, Eliceiri KW. NIH Image to ImageJ: 25 years of image analysis. Nat Methods. 2012;9(7):671–675. [DOI] [PMC free article] [PubMed] [Google Scholar]
Associated Data
This section collects any data citations, data availability statements, or supplementary materials included in this article.