Abstract
BACKGROUND:
Current R2*-MRI techniques for measuring hepatic iron content (HIC) use various acquisition types and fitting models.
PURPOSE:
To evaluate accuracy and precision of R2*-HIC acquisition and fitting methods.
STUDY TYPE:
Signal simulations, phantom study, and prospective in-vivo cohort.
POPULATION:
132 patients (58/74 male/female, mean age 17.7y).
FIELD STRENGTH/SEQUENCE:
2D-multi-echo gradient-echo (GRE) and ultra-short echo time (UTE) acquisitions at 1.5T.
ASSESSMENT:
Synthetic MR signals were created to mimic published GRE and UTE methods, using different R2* values (25–2000s−1) and signal-to-noise ratios (SNR). Phantoms with varying iron concentrations were scanned at 1.5T. In-vivo data were analyzed from 132 patients acquired at 1.5T. R2* was estimated by fitting using three signal models. Accuracy and precision of R2* measurements for UTE acquisition parameters (SNR, echo spacing (ΔTE), maximum echo time (TEmax)) and fitting methods were compared for simulated, phantom, and in-vivo datasets.
STATISTICAL TESTS:
R2* accuracy was determined from the relative error and by linear regression analysis. Precision was evaluated using coefficient of variation (CoV) analysis.
RESULTS:
In simulations, all models had high R2* accuracy (error<5%) and precision (CoV<10%) for all SNRs, shorter ∆TE (≤0.5ms) and longer TEmax (≥10.1ms); except the constant offset model overestimated R2* at the lowest SNR. In phantoms and in-vivo, all models produced similar R2* values for different SNRs and shorter ∆TEs (slopes: 0.99–1.06, R2>0.99, P<0.001). In all experiments, R2* results degraded for high R2* values with longer ∆TE (≥1ms). In-vivo, shorter and longer TEmax gave similar R2* results (slopes: 1.02–1.06, R2>0.99, P<0.001) for the noise subtraction model for 25≤R2*≤2000s−1. However, both quadratic and constant offset models, using shorter TEmax (≤4.7ms) overestimated R2* and yielded high CoVs up to ~170% for low R2* (<250s−1).
DATA CONCLUSION:
UTE with TEmax ≥ 10.1ms and ΔTE ≤ 0.5ms yields accurate R2* estimates over the entire clinical HIC range. Mono-exponential fitting with noise subtraction is the most robust signal model to changes in UTE parameters and achieves the highest R2* accuracy and precision.
Keywords: hepatic iron overload, R2* quantification, ultrashort echo time, signal models
INTRODUCTION
Hepatic iron overload is a severe complication in patients with increased gastrointestinal absorption of dietary iron or those receiving chronic blood transfusions.1–5 Measuring and monitoring hepatic iron content (HIC) is thus necessary to guide treatment for removing excess iron. In recent years, magnetic resonance imaging (MRI) has become accepted as a reliable tool to estimate HIC.6 One standard method to estimate HIC with MRI is to quantify the effective transverse relaxation rate (R2*) of liver tissue using a multi-echo gradient echo (GRE) sequence. Published calibration studies show excellent linear correlation between HIC by biopsy and R2* measured by GRE.7–10 However, in cases of high and massive iron overload (HICs > 15 and 25 mg/g Fe dry weight liver tissue, respectively), precision of GRE-based HIC is limited and R2* estimation may fail, as the signal decays too rapidly to be reliably measured by conventional GRE imaging with shortest possible echo times of ~1.0 ms.7
Recently, independent groups have shown that ultrashort echo time (UTE) imaging with TE as short as 0.1–0.19 ms can increase the accuracy of R2* measurements in cases of high and massive iron overload,11,12 and hence may extend the clinically measurable R2*-MRI based HIC range. However, these groups use different UTE acquisition sequences, imaging parameters and R2* fitting models,11,12 and thus may produce different R2* values and ultimately different R2*-HIC calibrations, similar to the inconsistencies observed between previous GRE calibration studies.7–10 The purpose of this study is, therefore, to evaluate accuracy and precision of R2* acquisition and fitting methods of (a) previously published R2*-GRE biopsy calibration studies, and (b) currently investigated R2*-UTE methods, through simulations and measurements in phantoms and patients with hepatic iron overload.
METHODS
Simulations
Simulations were performed for the following published GRE and UTE acquisition and fitting methods: GRE-A,7 GRE-B,8 GRE-C,13 UTE-A,11 and UTE-B.12 GRE-A acquires multiple single-echo GRE measurements from a single axial mid-hepatic slice and fits R2* using a mono-exponential model with constant offset.7 GRE-B acquires a multi-echo GRE sequence with bipolar readout gradients from a single axial central slice of the liver and fits R2* using a mono-exponential model with noise subtraction.8 GRE-C also uses a multi-echo GRE, it fits R2* using a quadratic mono-exponential model.13 UTE-A is implemented as a 2D multi-echo UTE with 5 interleaved echo trains with ΔTE shifts of 0.25 ms to create denser sampling, and it fits R2* using a quadratic mono-exponential model.11 UTE-B acquires a 3D UTE sequence with 7 single-echoes and fits R2* using a mono-exponential model with constant offset.12 The acquisition parameters and signal models for all these methods are summarized in Table 1. Note that these 5 sequences have different acquisition times and echo time distributions. The simulation objective is to evaluate the precision and accuracy as a function of R2* among the published, calibrated GRE and UTE R2* methods. No emphasis on acquisition time is therefore made in the comparisons.
Table 1.
Summary of published R2* Acquisition Methods and Signal Models
| Method | TEmin (ms) | TEmax (ms) | ∆TE (ms) | TR (ms) /FA(deg) | Slice thickness (mm) | FOV (mm) | Matrix | # Echoes | TA (min) | Signal Model | Reference |
|---|---|---|---|---|---|---|---|---|---|---|---|
| GRE-A | 0.8 | 4.8 | 0.25 | 25/20 | 15 | 480 | 64×64 | 16 | 0:26 | Mono-exponential with constant offset |
Wood 20057 |
| GRE-B | 1.1 | 17.3 | 0.82 | 200/25 | 10 | 350–450 | 128×104 | 20 | 0:20 | Mono-exponential with noise subtraction |
Hankins 20098 |
| GRE-C | 0.93 | 15.66 | 1.34 | 20/20 | 10 | 320–384 | 128×96 | 12 | 0:15 | Quadratic mono-exponential |
Feng 201313 |
| UTE-A | 0.1 | 20.9 | 0.25/0.8 | 52.5/20 | 10 | 350–500 | 192×192 | 60 | 1:40 | Quadratic mono-exponential |
Krafft 201711 |
| UTE-B | 0.19 | 2.0 | Variable (0.04 – 1.0) | 5/4 | 15 | 310 | 88×88 | 7 | 0:35 | Mono-exponential with constant offset |
Doyle 201712 |
GRE, gradient echo; UTE, ultra-short echo time; TEmin, minimium echo time; TEmax, maximum echo time; ΔTE, echo spacing; TR, repetition time; FA, flip angle; FOV, field of view; TA, acquisition time; S(t), measured signal; N, noise; S0, signal at the start of the decay; Scorr(t), corrected signal after noise subtraction.
An analytical model was derived following an approach for optimized precision of T1 relaxation measurements,14 to estimate the precision of fitted R2* values15,16 ( see also the Supplement for an analysis of the impact of key acquisition parameters on the precision of R2* measurements). The precision of R2* estimates calculated with different acquisition methods was compared by performing simulations in Maple (Maplesoft, Waterloo, ON) for different signal-to-noise ratio (SNR) conditions. SNR was defined as the ratio of the true signal intensity S(TE=0) to the noise standard deviation. For each acquisition type, independent of the signal model, the achievable precision, expressed as the coefficient of variation (CoV) = (standard deviation (SD) of R2*)/(mean of R2*), was calculated from the Fisher information matrix of the model function (see Supplement for derivation).14 For each acquisition type, independent of the signal model, the maximal achievable precision, expressed as the coefficient of variation (CoV) = (standard deviation (SD) of R2*)/(mean of R2*), was calculated from the Fisher information matrix of the model function (see Supplement for derivation).14 To compare the accuracy of R2* measurements, Monte Carlo simulations were performed using MATLAB (MathWorks, Natick, MA) for the acquisition and signal models listed in Table 1 by varying SNR levels. Monte Carlo simulations were performed for 40 R2* values from 25 to 2000 s−1 mimicking the range of iron overloaded liver tissue. Assuming normal distributed R2* values in liver tissue, 10,000 R2* samples were drawn from a Gaussian distribution [mean = nominal R2*, full width half maximum = 5% of the nominal R2*] for each nominal R2* value, and a complex MR signal curve was generated using the reported TEs for each sequence type. Complex Gaussian noise was added to each synthetic signal to achieve the target SNR. The magnitude signal was subsequently fitted with the respective signal models to estimate R2*.
The above two steps served to identify the most suited sequence amongst the 5 analyzed acquisition methods that demonstrated highest accuracy and precision over the widest range of R2* values. For this sequence, further Monte Carlo simulations were performed to evaluate the performance of the reported R2* signal models—constant offset,7,12 noise subtraction,8,17 and quadratic11,13—by varying the following sequence parameters: SNR (25, 50, 75 and 100), ∆TE (echo spacing: 0.25, 0.5, 1.0 and 1.8 ms), and TEmax (maximum TE: 2.1, 4.7, 10.1 and 20.9 ms).
Phantom Study
Ten phantoms (volume = 1 L) were made from 2% agar–water mixtures, doped with various amounts of bionized nonferrite particles (range of Fe concentration: 0.5 – 220 μg/ml) to obtain a wide range of R2* values,17 and scanned with a 1.5T scanner (Magnetom Avanto, Siemens Healthineers, Malvern, PA) using the following UTE-A acquisition parameters (see Table 1):TR/TE1, 52.5/0.1 ms; echo spacing, 1.8 ms; 12 echoes per interleave; 5 interleaves; 192 radial lines; flip angle, 20°; slice thickness, 10 mm; pixel bandwidth, 780 Hz/pixel; field of view (FOV) 420 mm and scan time, 60 seconds. For the UTE-A acquisition, two spatial saturation bands were placed parallel to the imaging slice (gap between saturation band and imaging slice, 10 mm; saturation band thickness, 100 mm) to eliminate out-of-slice signal contributions, and chemically selective saturation radiofrequency pulses were applied to reduce radial streaking artifacts. Images were acquired at different SNR by changing the number of averages (NA). SNR is calculated as the ratio of the mean signal intensity measured in the phantom to the SD of background noise. To investigate the impact of ∆TE and TEmax, images at certain TEs were removed from the UTE-A acquisition for analysis. Quantitative R2* maps were calculated in MATLAB from UTE-A data for the different signal models listed in Table 1 as a function of SNR, ∆TE, and TEmax, similar to as performed in simulations. Circular regions of interest (ROIs) were drawn for each phantom bottle, and the mean (±SD) R2* values for different signal models and acquisition parameters were calculated and compared.
In vivo Study
DICOM and raw data were collected from patients who previously received more than 12 erythrocyte transfusions and provided consent, and enrolled in a prospective institutional review board–approved study on iron overload assessment (www.clinicaltrials.gov, NCT01572922). A total of 132 eligible patients (58 male and 74 female; mean [±SD] age, 17.7± 11.5 years; range, 1.6–53.6 years) underwent a total of 137 MRI scans on a 1.5T scanner (Magnetom Avanto, Siemens Healthineers, Malvern, PA) from July 2012 to June 2017. Of these 43 were sedated (18 male and 25 female; mean [±SD] age, 7.6± 5.8 years) for the MRI scan. Primary diagnoses included sickle cell disease (n=73), β-thalassemia major (n=16), cancer (n=27), and other diseases (e.g., bone marrow failure syndromes, histiocytosis, pyruvate kinase deficiency) (n=16).
A single transverse slice of the liver at the location of the main portal vein was scanned in all patients with the free-breathing UTE-A sequence which had identical parameters as the phantom study (see Table 1). The FOV for all acquisitions ranged from 350 to 500 mm depending on patient body size. To acquire images with high SNR, the UTE-A sequence was run with 3 averages instead of 1 as reported in Table 1. Quantitative R2* maps were calculated in Matlab by fitting the signal decay on a pixel-by-pixel basis to different signal models given in Table 1. R2* maps were also calculated for different signal models by varying the SNR, ΔTE, and TEmax of the UTE-A sequence (see Figure 1) as done in simulations and phantom experiments. For obtaining different SNR levels, images were reconstructed with 1 and 2 averages by extracting data from the saved raw data files. ΔTE and TEmax were varied by removing images with certain TEs from the entire echo train. Mean (±SD) R2* values were measured by manual selection of an ROI covering the whole liver cross-section and exclusion of blood vessels based on histogram analysis.18,19 For each patient, the same ROI mask was used to calculate mean liver R2* values for different signal models and acquisition parameters. For each fit, the mean R2* values calculated by changing different UTE-A acquisition parameters were compared to those obtained with the 3-average UTE-A reference sequence.
FIG. 1.
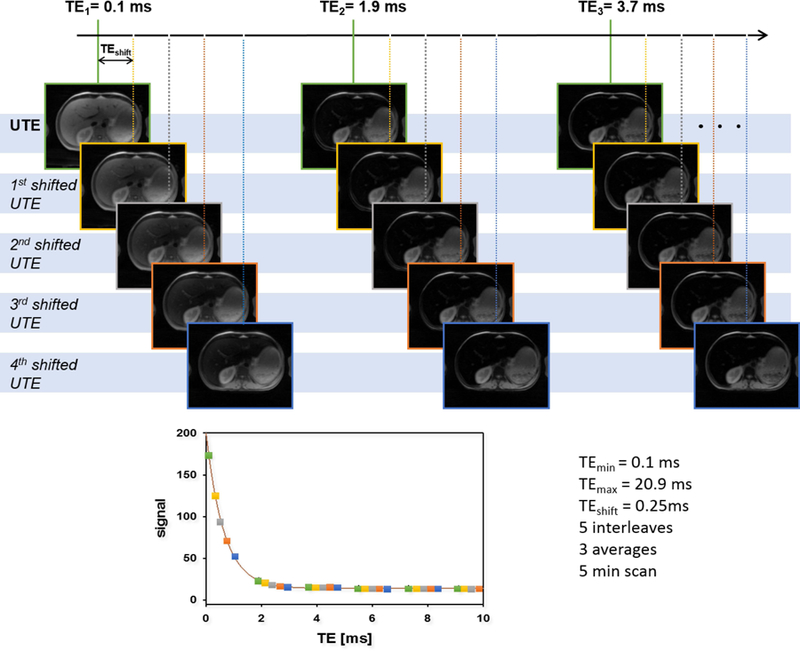
Schematic description of the UTE-A acquisition with respective measurement parameters in vivo. The full data set is acquired in 5 interleaves, each interleave containing 12 echoes and shifted by ΔTEshift = 0.25 ms from each other. The entire scan has been repeated 3 times to increase SNR. This results in a typical signal decay as shown in the bottom. Images acquired in each interleave are represented by a distinct color (green, yellow, grey, orange and blue). To study the impact of ΔTE on accuracy and precision, every other echo (yellow & orange) has been removed. For investigation of the impact of TEmax, the last echoes have been sequentially removed to create echo trains with lengths of 60 (all data, TEmax = 20.9 ms), 30 (TEmax = 10.1 ms), 15 (TEmax = 4.7 ms) and 7 (TEmax = 2.1 ms). Finally, for SNR related simulations all 60 echoes and number of averages (NA) = 1, 2, 3 were used.
Statistical Analysis
The precision in R2* estimation was evaluated using the coefficient of variation (CoV) plotted against true R2* values. The accuracy in R2* estimation was evaluated by calculating the relative error (in %) and by using linear regression analysis against reference R2* values. For all statistical tests, p-values < 0.05 were considered significant.
RESULTS
Simulations
Precision of the R2* estimates for all GRE acquisition methods (Fig. 2) showed an increase in CoV for R2* values >1000 s−1 except for GRE-A, which displayed lower precision for R2* values <250 s−1 compared to other GRE methods. Both UTE acquisitions demonstrated high precision for R2* values >1000 s−1. UTE-A consistently produced high precision at all R2* values above 50 s−1, whereas UTE-B exhibited an increase in CoV at decreasing R2* values below 1000 s−1. With decreasing SNR, there was substantial loss of precision for all acquisition methods except for UTE-A.
FIG. 2.
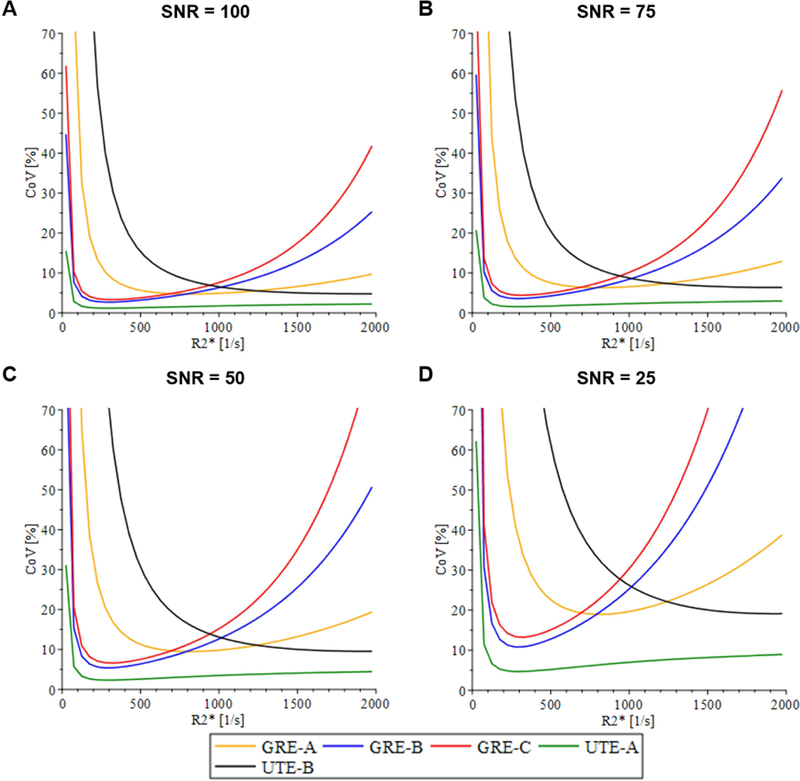
Coefficient of variance (CoV) plots for acquisition methods listed in Table 1, independent of the signal model under different signal-to-noise ratio (SNR) conditions. For high R2* values (>1000 s−1), all GRE acquisition methods had low precision whereas UTE acquisition methods had high precision. This demonstrates that TEmin affects precision for the high R2* range. In the low R2* range, acquisitions that used longer TEmax (GRE-B, GRE-C, UTE-A) had higher precision than did GRE-A and UTE-B, which used relatively much shorter TEmax. This indicates that TEmax affects precision for low R2* values. As SNR decreased, all acquisitions showed a decrease in precision, indicating that SNR affects the overall precision.
The accuracy of R2* estimates from reported acquisition methods with their respective fit models was variable (Fig. 3). GRE-A and GRE-C overestimated whereas GRE-B underestimated for R2* values >1000 s−1, with error increasing with decreasing SNR. The UTE-A model using long TEmax of 20.9 ms was accurate over the entire R2* range for all simulated SNR, whereas UTE-B was accurate for R2* values >1000 s−1, and accuracy decreased for lower R2* values below 1000 s−1. Further, R2* overestimation with UTE-B increased with decreasing SNR (up to ~8%), whereas UTE-A was not affected (relative errors <1%).
FIG. 3.
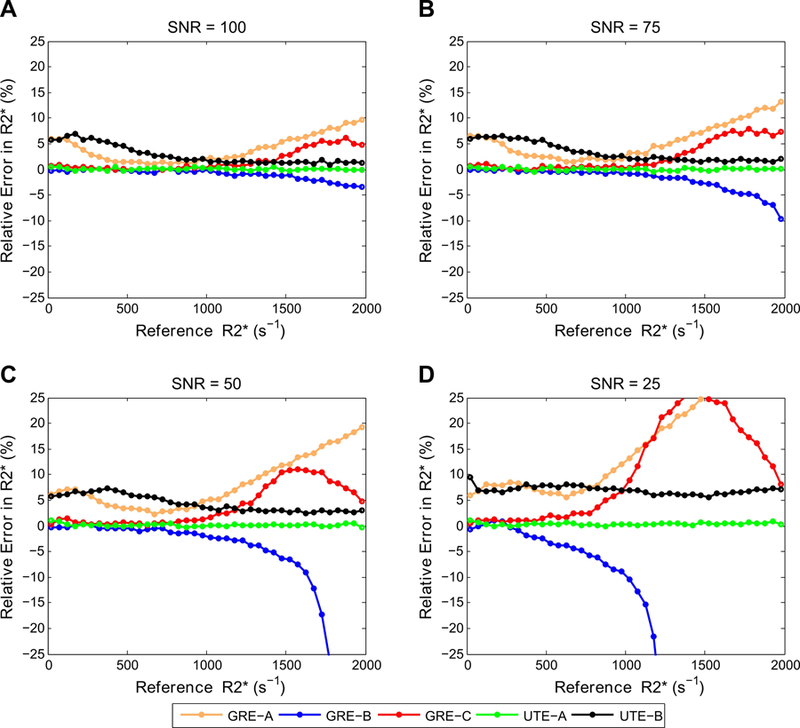
Comparison of relative error in R2* measurements for GRE and UTE methods listed in Table 1, using their respective fit models. For high R2* values, GRE-A and GRE-C overestimated whereas GRE-B underestimated R2* values, with underestimation or overestimation increasing with decreasing SNR. UTE-A showed the highest accuracy over the entire R2* range for all SNRs, whereas UTE-B was accurate only for high R2* and SNR.
Figures 4 and 5 show R2* accuracy and precision calculations for the 3 signal models (constant offset, noise subtraction, and quadratic mono-exponential) by varying UTE acquisition parameters. In both figures, R2* values calculated with the UTE-A acquisition were taken as reference for all signal models for comparison, because this method had the highest precision and accuracy in R2* measurements over the entire clinical R2* range of 25 – 2000 s−1 (see Figs. 2 and 3). Figure 4 shows that the noise subtraction and quadratic models had high accuracy for all SNRs whereas the constant offset model slightly overestimated R2* (< 5%) for high SNRs (≥75); for the lowest SNR of 25, the constant offset model overestimated up to ~10%. All models showed similar precision for all SNRs, except that the CoV increased up to 10% for the lowest SNR (Fig. 5). All signal models had similar accuracy and precision for shorter ∆TEs (0.25, 0.5 ms); however, accuracy and precision reduced for R2* values above 1000 s−1 using larger ∆TEs (≥1ms). For the noise subtraction and quadratic models, decreasing TEmax did not affect the accuracy of R2* estimates but increased the CoV for R2* values <500 s−1. The effect of TEmax was different in the constant offset model: for shorter TEmax, there was overestimation and high CoV for R2* values below 500 s−1, and for longer TEmax there was overestimation for R2* values above 500 s−1 (Fig. 4).
FIG. 4.
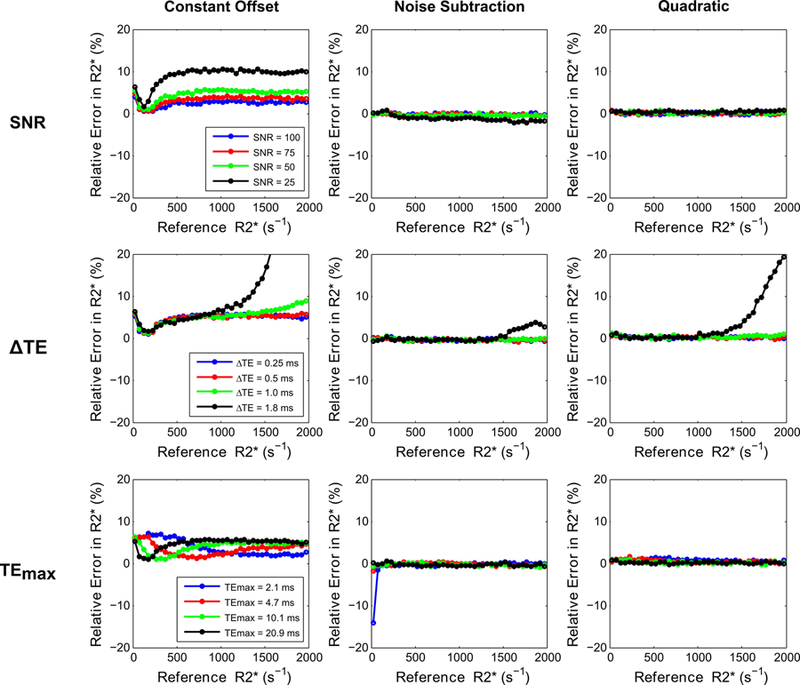
Comparison of relative error in R2* measurements (i.e., accuracy) for 3 signal models by varying UTE-A acquisition parameters as a function of SNR (top row), ∆TE (middle row), and TEmax (bottom row). SNR was held at 50 for varying ∆TE and TEmax. Noise subtraction and quadratic models showed high accuracy for varying acquisition parameters, except for high R2* values obtained for the longest ∆TE of 1.8 ms. The constant offset model overestimated R2* for the lowest SNR and for high R2* values obtained using longer ∆TEs (≥1ms), and R2* results were dependent on TEmax.
FIG. 5.
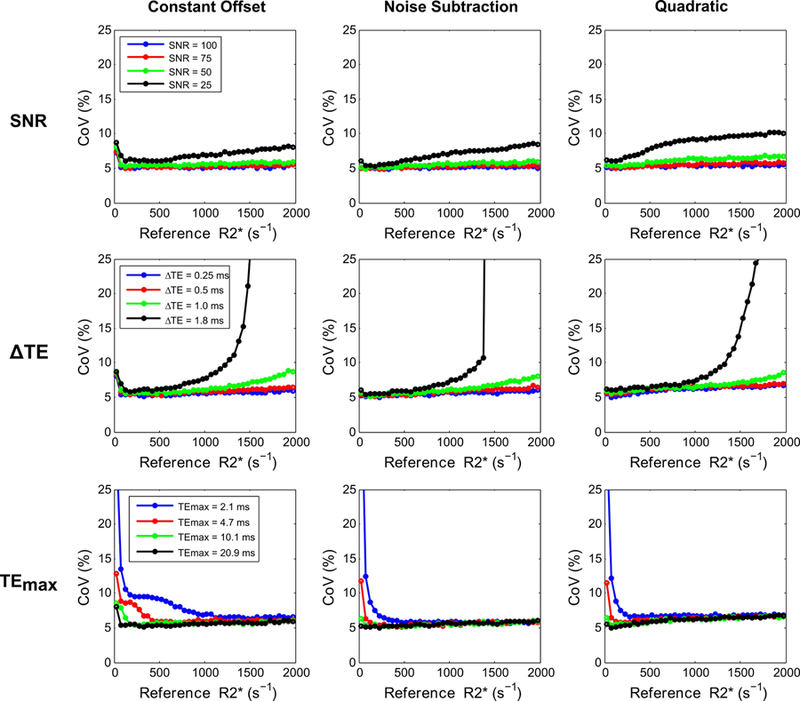
Comparison of CoV in R2* measurements (i.e., precision) for 3 signal models by varying UTE acquisition parameters as a function of SNR (top row), ∆TE (middle row), and TEmax (bottom row). SNR was held at 50 while varying ∆TE and TEmax. All models showed low precision for the lowest SNR, for high R2* values obtained using longer ∆TEs (≥1ms), and for low R2* values obtained using shorter TEmax (2.1, 4.7 ms).
Phantom Study
The SNR in phantoms for the UTE-A acquisition ranged from 44 to 173 corresponding to the highest and lowest iron concentrations, respectively. All signal models produced similar R2* results (Fig. 6) for different NAs and shorter ∆TEs (0.25, 0.5 ms). However, using longer ∆TEs ≥1 ms caused either R2* underestimation or overestimation for all models at the highest iron concentration. Use of shorter or longer TEmax produced similar R2* results for the noise subtraction model at all iron concentrations. However, using shorter TEmax (2.1, 4.7 ms) resulted in R2* overestimation and high SDs for both the quadratic (relative errors up to ~130% and CoVs up to ~45%) and constant offset (relative errors up to ~1600% and CoVs up to ~130%) models at low iron concentrations (R2* < 150 s−1).
FIG. 6.
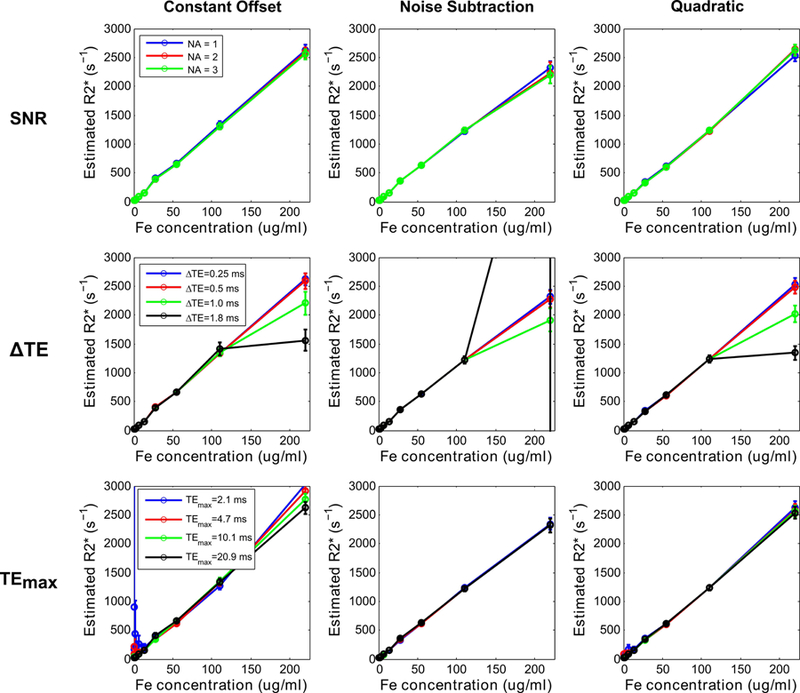
Mean R2* values (error bars denote standard deviation) obtained using 3 signal models plotted against iron concentrations in phantoms. UTE-A acquisition was taken as the reference, and parameters: SNR (top row), ∆TE (middle row), and TEmax (bottom row) were varied. SNR was compared by varying the number of averages (NA). All models produced similar R2* values for different NA and underestimated or overestimated R2* for the highest iron concentration obtained using longer ∆TEs (≥1ms). For low iron concentrations and shorter TEmax (2.1, 4.7ms), the constant offset model substantially overestimated R2* values, the quadratic model only slightly overestimated, whereas the noise subtraction model still produced accurate results.
In vivo Study
Figures 7 and 8 show the mean and CoV of R2* values for different fits and acquisition parameters plotted against reference R2* values. All signal models using UTE-A with 1 and 2 averages produced similar mean R2* values as that by 3-average UTE-A acquisition (Table 2, slopes: 0.99–1.05, R2>0.99, P <0.001), except that the CoV was slightly higher for 1-average UTE-A acquisition. For all models, mean R2* values and CoVs were similar between acquisitions with ΔTEs of 0.25 and 0.5 ms. Increasing ΔTE to 1 ms still produced similar mean R2* results for all models (Table 2, slopes: 1.01–1.07, R2: 0.98–0.99, P <0.001) but increased the CoV in R2* measurements to up to ~80% for R2* values above 1000 s−1 (Fig. 8). For a ΔTE of 1.8 ms (minimum echo spacing possible with no interleaves in UTE-A acquisition), the constant offset and quadratic models systematically overestimated R2* values and yielded high CoVs for cases of high iron (R2*>1000 s−1), whereas the noise subtraction model underestimated R2* values. In accordance with the phantom experiments, the noise subtraction model produced comparable mean R2* results (Table 2, slopes: 1.02–1.06, R2: >0.99, P <0.001) for short and long TEmax over the entire R2* range. However, for both the quadratic and constant offset models, using shorter TEmax (2.1, 4.7 ms) overestimated R2* and yielded high CoVs up to ~170% for cases of mild iron (R2*<250 s−1).
FIG. 7.
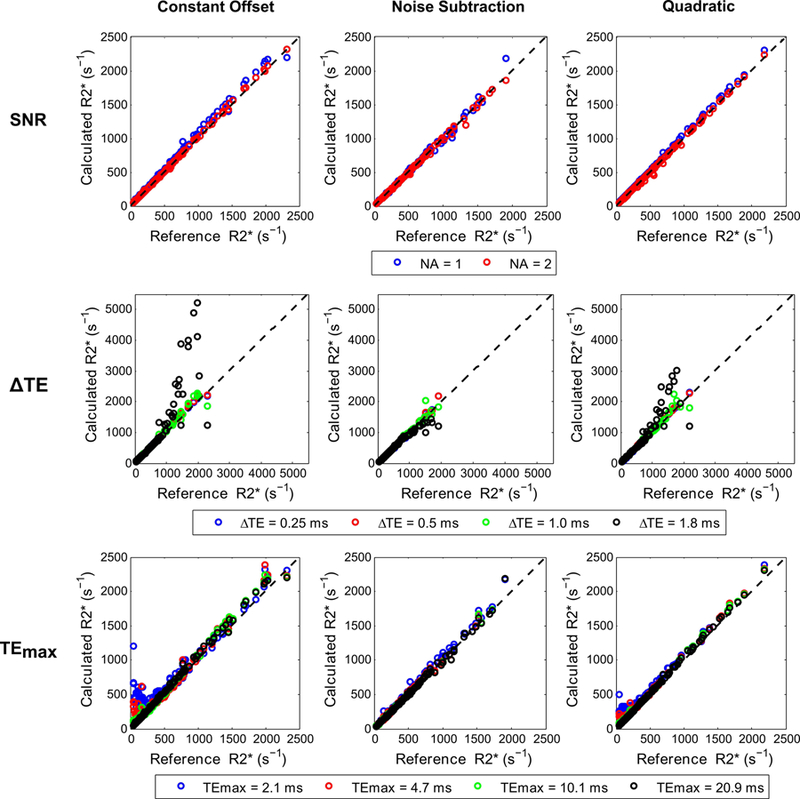
Mean R2* values calculated with different fits by varying UTE-A parameters for in vivo data. For each fit, the mean R2* values calculated by varying SNR (top row), ∆TE (middle row), and TEmax (bottom row) were compared with those obtained using the 3-average UTE-A acquisition as reference. SNR was compared by varying the number of averages (NA). All models produced similar R2* values for different NA and shorter ∆TEs (0.25, 0.5 ms), but underestimated or overestimated R2* for longer ∆TEs (≥1ms) in cases of high iron overload (R2*>1000 s−1). By using shorter TEmax (2.1, 4.7ms), the constant offset and quadratic models overestimated R2* in cases of mild iron overload (R2*<250 s−1) whereas the noise subtraction model still produced accurate results. Results of linear regression analysis (slope, intercept, and R2) between calculated and reference R2* values for each fit are shown in Table 2.
FIG. 8.
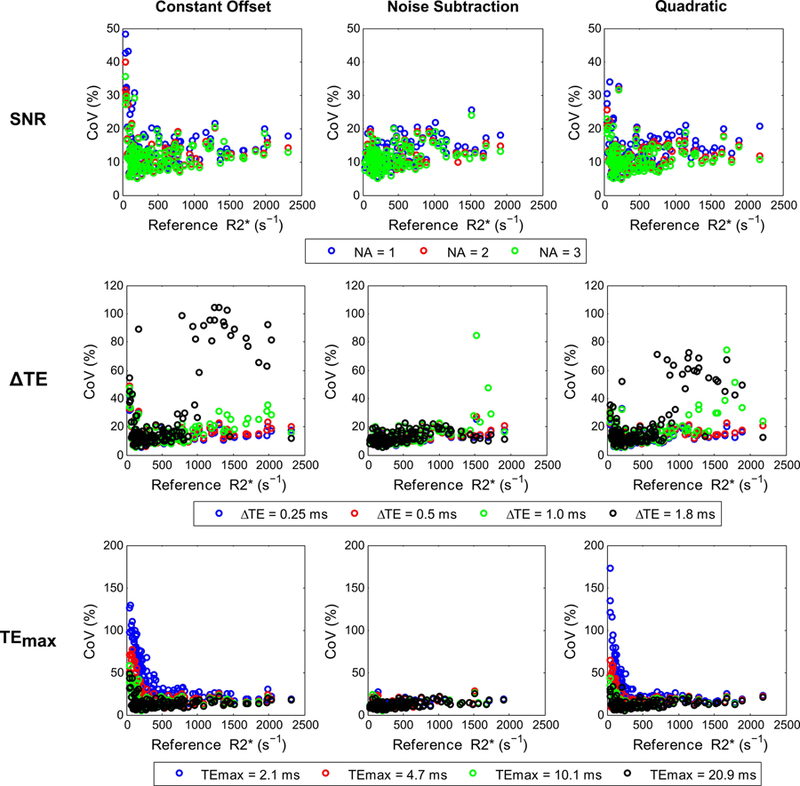
Comparison of CoV in R2* values calculated with different fits by varying UTE-A acquisition parameters: SNR (top row), ∆TE (middle row), and TEmax (bottom row). For each fit, the CoV of R2* values are plotted against reference R2* values calculated with the 3-average UTE-A acquisition. SNR was compared by varying the number of averages (NA). The CoV in R2* values was similar for NA = 2, 3 but was slightly higher for NA = 1 for all model fits. Similarly, the CoV was similar for shorter ∆TEs (0.25, 0.5 ms) but higher for longer ∆TEs (≥1ms) in cases of high iron overload (R2*>1000 s−1). Using longer TEmax (10.1, 20.9 ms) yielded similar CoV in R2* values for all models, but using shorter TEmax (2.1, 4.7ms) yielded high CoV in R2* values for constant offset and quadratic models for cases of mild iron overload (R2*<250 s−1) whereas the noise subtraction model produced CoV similar to that using longer TEmax.
Table 2.
Linear Regression Analysis between Calculated and Reference R2* Values (in s−1) for Different Signal Models and UTE-A Acquisition Parameters for In Vivo Data.
| Signal Model | Parameters | SNR | ΔTE (ms) | TEmax (ms) | |||||||
|---|---|---|---|---|---|---|---|---|---|---|---|
| NA = 1 | NA = 2 | 0.25 | 0.5 | 1.0 | 1.8 | 2.1 | 4.7 | 10.1 | 20.9 | ||
| Constant Offset | Slope | 1.05 | 1.02 | 1.05 | 1.06 | 1.07 | 1.8 | 0.87 | 1.01 | 1.06 | 1.05 |
| Intercept | 2.5 | −1.9 | 2.5 | −0.28 | −1.6 | −207 | 216 | 53 | 0.31 | 2.5 | |
| R2 | >0.99 | >0.99 | >0.99 | >0.99 | 0.99 | 0.80 | 0.90 | 0.97 | >0.99 | >0.99 | |
| Noise Subtraction | Slope | 1.02 | 0.99 | 1.02 | 1.03 | 1.01 | 0.84 | 1.06 | 1.02 | 1.02 | 1.02 |
| Intercept | −4.8 | 1.5 | −4.8 | −6.2 | −0.47 | 51 | −1.1 | 0.25 | –4.5 | −4.8 | |
| R2 | >0.99 | >0.99 | >0.99 | >0.99 | 0.99 | 0.96 | >0.99 | >0.99 | >0.99 | >0.99 | |
| Quadratic | Slope | 1.05 | 1.01 | 1.05 | 1.04 | 1.04 | 1.29 | 0.99 | 1.03 | 1.05 | 1.05 |
| Intercept | −4.2 | −5.1 | −4.2 | −3.2 | −1.9 | −64 | 80 | 23 | −1.0 | −4.2 | |
| R2 | >0.99 | >0.99 | >0.99 | >0.99 | 0.98 | 0.87 | 0.98 | >0.99 | >0.99 | >0.99 | |
SNR, signal-to-noise ratio; NA, number of averages; ΔTE, echo spacing; TEmax, maximum echo time. P-value < 0.001 for all comparisons.
DISCUSSION
In this study, the precision and accuracy of the main published biopsy calibrated R2* acquisition and fitting methods, were assessed and compared with recently published UTE methods via simulations, phantoms, and in vivo data. While there are other R2* acquisition methods and fitting algorithms currently tested (e.g. 3D-GRE and fat-corrected complex fitting), we focused on the calibration methods only, since these are the standard methods used in clinical practice where HIC in mg Fe/g tissue rather than R2* values are reported and used by hematologists for excess iron removal therapy (e.g., chelation). Our findings indicate that the UTE with a longer TEmax (≥ 10.1 ms) and echo spacing of ∆TE ≤ 0.5 ms is the best among the investigated acquisition methods for reliable R2* assessment over the entire clinical HIC range (0.2 to 60 mg/g Fe of dry weight liver tissue), and can be achieved within a reasonable scan time of only 1 to 1.5 minutes for 3 to 5 interleaves, respectively. Of all R2* fitting models, the noise subtraction model was most robust to changes in UTE acquisition parameters and had higher accuracy and precision in R2* measurements than the other fitting models.
The standard sequence used in published R2*-MRI versus HIC by biopsy calibrations is a multi-echo GRE. However, previous studies and our numerical simulations show that current GRE techniques lose precision for R2*>1000 s−1 (i.e., HIC >25 mg Fe/g at 1.5T),7,8 except for GRE-A at high SNR. This is because GRE-A used multiple single-echo GRE acquisitions with larger voxel size that yielded relatively short TE1 and ∆TEs than those by other GRE methods. However, GRE-A does not collect images with longer TEs (TEmax=4.8 ms) which leads to low precision for R2* values <250 s−1 compared to other GRE methods. At low SNRs, all GRE acquisitions tested showed diminished precision for R2* values even above 500 s−1 (i.e., HIC >15 mg Fe/g). This limitation of conventional GRE imaging was more pronounced at 3T, as R2* is approximately double that at 1.5T, which limits the maximal clinically measurable HIC to 12.5 mg Fe/g or even lower.
Limitations associated with GRE techniques at high HIC values or low SNR conditions may be overcome by using multi-echo UTE sequences.11,12 Of the 2 published UTE acquisitions proposed for HIC assessment, our simulations showed that UTE-A provides high accuracy and precision over the entire R2* range, whereas UTE-B was accurate and precise only at high R2* values (>1000 s−1), apparently due to the use of a much shorter TEmax. This means that UTE-B must be used in conjunction with a regular GRE sequence to cover the full clinical range of R2* values with adequate accuracy and precision. Such a 2-tier imaging approach is viable in current clinical practice. A patient referred for iron assessment may always receive the GRE-based assessment first, thereby building on the vast diagnostic experience collected over the past decade. A UTE-B scan would then serve as a backup for failed GRE scans. However, for consistency, workflow optimization and to reduce patient burden, a single test covering the entire clinical range of R2* values, such as UTE-A, is desirable.
As for R2* fitting, our UTE simulations showed high accuracy and precision of R2* measurements for all SNRs and signal models, except that the constant offset model overestimated R2* by ~10% at the lowest SNR levels, which is consistent with findings from previous studies.13,20 In phantoms and in vivo, all signal models produced similar R2* values for different number of averages indicating that UTE with 1-average is sufficient to obtain accurate results for 25 < R2*< 2000 s−1. In all experiments, the use of shorter ∆TEs (0.25, 0.5 ms) gave similar accuracy and precision; however, R2* accuracy and precision worsened at high R2* values above 1000 s−1 for longer ∆TEs ≥1ms due to inadequate temporal sampling of the rapid signal decay. In phantoms and in vivo, using shorter or longer TEmax produced similar R2* results for the noise subtraction model across the entire R2* range. However, using a shorter TEmax led to R2* overestimation and high SDs for both the quadratic and constant offset models in the low R2* range (<250 s−1). This is because both quadratic and constant offset models fit a mono-exponential decay with an additional parameter to account for noise floor. However, in cases of normal or mild iron overload, there is a gradual signal decay and with a shorter TEmax the signal does not hit the noise floor; thus, fitting a constant parameter for noise can yield inaccurate R2* values. In contrast, the noise subtraction model fits a pure mono-exponential decay after subtracting the background noise from the signal, and hence the results do not seem to be affected despite using shorter TEmax in cases of normal or low iron.
Another important advantage of UTE imaging is that it can be performed under free breathing, as it is intrinsically less sensitive to motion because of radial sampling.11 A recent study validated that free-breathing UTE outperforms free-breathing GRE in sedated and breath-hold non-compliant patients, which makes it a viable alternative to breath-hold GRE for accurate R2* quantification even under conditions of non-massive iron overload.21 Hence, UTE imaging can extend the measurable R2*-based HIC range and eliminate the need for breath-holding when assessing hepatic iron overload by R2*-MRI. This will increase the clinical suitability of UTE acquisition for assessing iron overload in pediatric populations and patients who are unable to hold their breath.
There are some limitations in this study. First, the acquisition time was longer for our reference sequence, UTE-A (100 s) than UTE-B (35 s), mainly because UTE-B acquires multiple single-echo acquisitions leading to a much shorter overall echo train length compared to UTE-A (7 vs. 60 echoes, respectively). However, we showed that a longer echo train length, as used in UTE-A, is necessary for accurately measuring low to moderate R2* values (<500 s−1). Accurate measurements of short R2* values are needed for therapeutic decisions, e.g. consideration for chelation therapy (< 3.2 mg Fe/g) or maintenance of an optimal chelation range (3.2 mg Fe/g – 7mg Fe/g).22 Hence, to sample longer TEmax, we recommend that UTE-B could be implemented as a multi-echo acquisition, which would, however, increase the scan time of UTE-B and bring it closer to acquisition times of UTE-A.
Second, UTE-A is a 2D sequence providing data from a single transverse liver slice only. For whole liver coverage, multiple slices of the liver could be measured by either repeating the UTE-A sequence at multiple slice locations or implementing a 3D UTE sequence such as UTE-B. However, both strategies will substantially increase the total scan time. The value of whole liver coverage for HIC assessment is unknown, considering that all existing R2*-HIC calibrations were derived for single-slice acquisitions,7,8 and iron removal therapies in patients seem to be successfully guided by those HIC values.23
Third, the UTE-A sequence uses fat suppression pulses to reduce streaking artifacts arising from the bright subcutaneous fat; otherwise the streaking artifacts can distort the signal in the liver and cause R2* bias.11 Recent GRE studies have shown that application of fat suppression pulses in iron overloaded cases, even without fat, can lead to R2* underestimation.17,24 However, Krafft et al. reported that there were only minor differences in R2* values due to application of fat suppression pulses in UTE imaging.11
Fourth, the optimal sequence among the 5 acquisition methods investigated was identified based on simulations only. Ideally, all simulations would need to be validated experimentally. But this was not possible in this study because we did not have access to all sequences as some of these were implemented on different vendor platforms.
Further, this study investigated only 3 validated R2* fitting algorithms based on magnitude data. While handling noise in complex-based signal models is more straightforward than magnitude-based,25 the complex-based methods require additional B0 field estimation, and are also not yet validated against biopsy HIC measurements. A potential drawback of the magnitude-based signal models investigated in this study is that they do not account for the presence of fat, which is a confounding factor for R2* estimation. Complex-based multispectral fat water models have been proposed for simultaneous quantification of fat and iron.25 However, a recent study showed that the fat-corrected complex based non-linear least squares (NLSQ) methods substantially overestimated both R2* and fat fractions in severely iron overloaded patients (R2*>500 s−1) when compared to liver biopsy results as reference standard.26 In another study, investigators applied complex fitting only without fat correction for R2* > 500 s−1 to avoid instability and bias.27 Due to these ambiguities, and also, as all of ourUTE phantom and in vivo data were acquired with fat-suppression, we did not investigate fat-corrected complex-based methods in this study. However, the presented simulations may be an ideal framework to carry out these investigations (i.e., magnitude vs. complex-based fits, fat-uncorrected vs. fat-corrected fits) in future studies
Lastly, the signal models investigated in this study do not account for the presence of inflammation, and fibrosis or cirrhosis, which might confound R2* estimation. Only future prospective patient studies with biopsy evaluation could evaluate the impact of these potentially confounding factors.
In summary, in this study we have developed a simulation approach for evaluating accuracy and precision which can also be applied to any acquisition technique and signal model in order to select the most appropriate methods for R2* assessment. These simulations allow to study the impact of TEmin, TEmax, ΔTE and SNR on the precision and accuracy of the fit. Our study demonstrates that UTE acquisition might offer a one-stop solution for R2* quantification instead of GRE, by extending the measurable R2* range, and removing the necessity for breath-holding. We found in simulations, phantom investigations and through the analysis of 137 exams of iron overloaded patients, that the free breathing UTE-A in combination with the noise subtraction model is a very suited approach that strikes a balance between measurement time, precision and accuracy, workflow and patient comfort.
Supplementary Material
Acknowledgements:
The authors thank Gail Fortner, RN, for patient enrollment and Chris Goode, RT, for MRI data collection. The authors also thank Dr. Vani Shanker for scientific editing.
Grant Support:
This study was supported by grant 5 R01 DK088988 from the National Institute of Diabetes and Digestive and Kidney Diseases of the National Institutes of Health and by ALSAC (the fund-raising organization of St. Jude Children’s Research Hospital).
Footnotes
Disclosure:
This work will be presented in part at the 2018 Annual Meeting of the International Society of Magnetic Resonance in Medicine in Paris, France.
REFERENCES
- 1.Olynyk JK, St Pierre TG, Britton RS, Brunt EM, Bacon BR. Duration of hepatic iron exposure increases the risk of significant fibrosis in hereditary hemochromatosis: a new role for magnetic resonance imaging. The American journal of gastroenterology 2005;100(4):837–841. [DOI] [PubMed] [Google Scholar]
- 2.Olivieri NF. Progression of iron overload in sickle cell disease. Seminars in hematology 2001;38(1 Suppl 1):57–62. [DOI] [PubMed] [Google Scholar]
- 3.Prati D, Maggioni M, Milani S, et al. Clinical and histological characterization of liver disease in patients with transfusion-dependent beta-thalassemia. A multicenter study of 117 cases. Haematologica 2004;89(10):1179–1186. [PubMed] [Google Scholar]
- 4.Eng J, Fish JD. Insidious iron burden in pediatric patients with acute lymphoblastic leukemia. Pediatric blood & cancer 2011;56(3):368–371. [DOI] [PubMed] [Google Scholar]
- 5.Nottage K, Gurney JG, Smeltzer M, Castellanos M, Hudson MM, Hankins JS. Trends in transfusion burden among long-term survivors of childhood hematological malignancies. Leukemia & lymphoma 2013;54(8):1719–1723. [DOI] [PMC free article] [PubMed] [Google Scholar]
- 6.Henninger B Demystifying liver iron concentration measurements with MRI. European radiology 2018. [DOI] [PubMed]
- 7.Wood JC, Enriquez C, Ghugre N, et al. MRI R2 and R2* mapping accurately estimates hepatic iron concentration in transfusion-dependent thalassemia and sickle cell disease patients. Blood 2005;106(4):1460–1465. [DOI] [PMC free article] [PubMed] [Google Scholar]
- 8.Hankins JS, McCarville MB, Loeffler RB, et al. R2* magnetic resonance imaging of the liver in patients with iron overload. Blood 2009;113(20):4853–4855. [DOI] [PMC free article] [PubMed] [Google Scholar]
- 9.Garbowski MW, Carpenter JP, Smith G, et al. Biopsy-based calibration of T2* magnetic resonance for estimation of liver iron concentration and comparison with R2 Ferriscan. Journal of cardiovascular magnetic resonance : official journal of the Society for Cardiovascular Magnetic Resonance 2014;16:40. [DOI] [PMC free article] [PubMed] [Google Scholar]
- 10.Henninger B, Zoller H, Rauch S, et al. R2* relaxometry for the quantification of hepatic iron overload: biopsy-based calibration and comparison with the literature. RoFo : Fortschritte auf dem Gebiete der Rontgenstrahlen und der Nuklearmedizin 2015;187(6):472–479. [DOI] [PubMed] [Google Scholar]
- 11.Krafft AJ, Loeffler RB, Song R, et al. Quantitative ultrashort echo time imaging for assessment of massive iron overload at 1.5 and 3 Tesla. Magnetic resonance in medicine 2017;78(5):1839–1851. [DOI] [PMC free article] [PubMed] [Google Scholar]
- 12.Doyle EK, Toy K, Valdez B, Chia JM, Coates T, Wood JC. Ultra-short echo time images quantify high liver iron. Magnetic resonance in medicine 2018;79(3):1579–1585. [DOI] [PMC free article] [PubMed] [Google Scholar]
- 13.Feng Y, He T, Gatehouse PD, et al. Improved MRI R2 * relaxometry of iron-loaded liver with noise correction. Magnetic resonance in medicine 2013;70(6):1765–1774. [DOI] [PubMed] [Google Scholar]
- 14.Ogg RJ, Kingsley PB. Optimized precision of inversion-recovery T1 measurements for constrained scan time. Magnetic resonance in medicine 2004;51(3):625–630. [DOI] [PubMed] [Google Scholar]
- 15.Marquardt DW. An Algorithm for Least-Squares Estimation of Nonlinear Parameters. Journal of the Society for Industrial and Applied Mathematics 1963;11(2):431–441. [Google Scholar]
- 16.Press WH, Teukolsky SA, Vetterling WT, Flannery BP. Numerical Recipes 3rd Edition: The Art of Scientific Computing: Cambridge University Press: 2007. 1256 p. [Google Scholar]
- 17.Krafft AJ, Loeffler RB, Song R, et al. Does fat suppression via chemically selective saturation affect R2*-MRI for transfusional iron overload assessment? A clinical evaluation at 1.5T and 3T. Magnetic resonance in medicine 2016;76(2):591–601. [DOI] [PMC free article] [PubMed] [Google Scholar]
- 18.McCarville MB, Hillenbrand CM, Loeffler RB, et al. Comparison of whole liver and small region-of-interest measurements of MRI liver R2* in children with iron overload. Pediatric radiology 2010;40(8):1360–1367. [DOI] [PMC free article] [PubMed] [Google Scholar]
- 19.Deng J, Rigsby CK, Schoeneman S, Boylan E. A semiautomatic postprocessing of liver R2* measurement for assessment of liver iron overload. Magnetic resonance imaging 2012;30(6):799–806. [DOI] [PubMed] [Google Scholar]
- 20.Yokoo T, Yuan Q, Senegas J, Wiethoff AJ, Pedrosa I. Quantitative R2* MRI of the liver with rician noise models for evaluation of hepatic iron overload: Simulation, phantom, and early clinical experience. Journal of magnetic resonance imaging : JMRI 2015;42(6):1544–1559. [DOI] [PubMed] [Google Scholar]
- 21.Tipirneni-Sajja A, Krafft AJ, McCarville MB, et al. Radial Ultrashort TE Imaging Removes the Need for Breath-Holding in Hepatic Iron Overload Quantification by R2* MRI. AJR American journal of roentgenology 2017;209(1):187–194. [DOI] [PMC free article] [PubMed] [Google Scholar]
- 22.Olivieri NF, Brittenham GM. Iron-chelating therapy and the treatment of thalassemia. Blood 1997;89(3):739–761. [PubMed] [Google Scholar]
- 23.Wood JC, Zhang P, Rienhoff H, Abi-Saab W, Neufeld E. R2 and R2* are equally effective in evaluating chronic response to iron chelation. American journal of hematology 2014;89(5):505–508. [DOI] [PubMed] [Google Scholar]
- 24.Meloni A, Tyszka JM, Pepe A, Wood JC. Effect of inversion recovery fat suppression on hepatic R2* quantitation in transfusional siderosis. AJR American journal of roentgenology 2015;204(3):625–629. [DOI] [PMC free article] [PubMed] [Google Scholar]
- 25.Hernando D, Kramer JH, Reeder SB. Multipeak fat-corrected complex R2* relaxometry: theory, optimization, and clinical validation. Magnetic resonance in medicine 2013;70(5):1319–1331. [DOI] [PMC free article] [PubMed] [Google Scholar]
- 26.Tipirneni-Sajja A, Krafft AJ, Taylor BA, et al. Simultaneous Iron and Fat Quantification Using an Auto Regressive Moving Average Model at 1.5T and 3T. Proceedings 25th Scientific Meeting, International Society for Magnetic Resonance in Medicine Honolulu, Hawaii; 2017 p. 326. [Google Scholar]
- 27.Hernando D, Zhao R, Taviani V, et al. Liver R2* as a Biomarker of Liver Iron Concentration: Interim Results from a Multi-Center, Multi-Vendor Reproducibility Study at 1.5T and 3T. Proceedings 26th Scientific Meeting, International Society for Magnetic Resonance in Medicine Paris, France; 2018. [Google Scholar]
Associated Data
This section collects any data citations, data availability statements, or supplementary materials included in this article.


