

Abstract
Background
Dampness and mould in buildings have been associated with adverse respiratory symptoms, asthma and respiratory infections of inhabitants. Moisture damage is a very common problem in private houses, workplaces and public buildings such as schools.
Objectives
To determine the effectiveness of repairing buildings damaged by dampness and mould in order to reduce or prevent respiratory tract symptoms, infections and symptoms of asthma.
Search methods
We searched CENTRAL (2014, Issue 10), MEDLINE (1951 to November week 1, 2014), EMBASE (1974 to November 2014), CINAHL (1982 to November 2014), Science Citation Index (1973 to November 2014), Biosis Previews (1989 to June 2011), NIOSHTIC (1930 to March 2014) and CISDOC (1974 to March 2014).
Selection criteria
Randomised controlled trials (RCTs), cluster‐RCTs (cRCTs), interrupted time series studies and controlled before‐after (CBA) studies of the effects of remediating dampness and mould in a building on respiratory symptoms, infections and asthma.
Data collection and analysis
Two authors independently extracted data and assessed the risk of bias in the included studies.
Main results
We included 12 studies (8028 participants): two RCTs (294 participants), one cRCT (4407 participants) and nine CBA studies (3327 participants). The interventions varied from thorough renovation to cleaning only.
Repairing houses decreased asthma‐related symptoms in adults (among others, wheezing (odds ratio (OR) 0.64; 95% confidence interval (CI) 0.55 to 0.75) and respiratory infections (among others, rhinitis (OR 0.57; 95% CI 0.49 to 0.66), two studies, moderate‐quality evidence). For children, we did not find a difference between repaired houses and receiving information only, in the number of asthma days or emergency department visits because of asthma (one study, moderate‐quality evidence).
One CBA study showed very low‐quality evidence that after repairing a mould‐damaged office building, asthma‐related and other respiratory symptoms decreased. In another CBA study, there was no difference in symptoms between full or partial repair of houses.
For children in schools, the evidence of an effect of mould remediation on respiratory symptoms was inconsistent and out of many symptom measures only respiratory infections might have decreased after the intervention. For staff in schools, there was very low‐quality evidence that asthma‐related and other respiratory symptoms in mould‐damaged schools were similar to those of staff in non‐damaged schools, both before and after intervention.
Authors' conclusions
We found moderate to very low‐quality evidence that repairing mould‐damaged houses and offices decreases asthma‐related symptoms and respiratory infections compared to no intervention in adults. There is very low‐quality evidence that although repairing schools did not significantly change respiratory symptoms in staff, pupils' visits to physicians due to a common cold were less frequent after remediation of the school. Better research, preferably with a cRCT design and with more validated outcome measures, is needed.
Keywords: Adult, Child, Humans, Biofouling, Fungi, Asthma, Asthma/prevention & control, Controlled Before‐After Studies, Environmental Restoration and Remediation, Environmental Restoration and Remediation/methods, Housing, Housing/standards, Humidity, Humidity/adverse effects, Randomized Controlled Trials as Topic, Respiratory Sounds, Respiratory Tract Infections, Respiratory Tract Infections/prevention & control, Schools, Schools/standards, Sick Building Syndrome, Sick Building Syndrome/complications, Sick Building Syndrome/prevention & control
Plain language summary
Interventions for preventing or reducing respiratory tract infections and asthma symptoms in mould‐damaged buildings
Review question
Our aim was to find out if repairing buildings damaged by dampness and mould reduces or prevents respiratory symptoms and asthma.
Background
Moisture damage is a very common problem in private houses, workplaces and public buildings globally. It has been associated with asthma and respiratory symptoms of the inhabitants.
Study characteristics
We included 12 studies with 8028 participants. Three were randomised controlled trials (RCTs) and nine were non‐RCTs with a control group. The repairs aimed to remove mould and dampness from family houses, schools or, in one study, an office building.
Key results
Repair of houses compared to no repair
Repairing houses to remove mould reduced asthma‐related symptoms and respiratory infections compared to doing nothing. It also decreased the use of asthma medication in asthmatics. The repair of an office damaged by mould also reduced asthma and respiratory symptoms compared to an office that was not repaired. Full or partial repair did not result in a difference in symptoms. However, the evidence was of low to very low quality.
Repair of houses compared to information for the inhabitants
There was moderate‐quality evidence that there was no clear benefit from repair of houses on asthma symptoms among asthmatic children.
Repair of schools compared to schools without problems
Out of many symptom measures only pupils' visits to physicians due to a common cold were less frequent after the building was repaired. For other respiratory symptoms of the pupils, the results were inconsistent.
For adults working in the schools, there was no clear evidence that the repair was beneficial.
Quality of evidence
The quality of evidence varied from very low to moderate quality. Many different symptoms were measured and studies were set up differently, therefore it was difficult to draw hard conclusions. Better research is needed, preferably with a cluster‐randomised design and with better measurement of the symptoms.
Background
Description of the condition
Respiratory symptoms and diseases are related to exposure to mould in damp buildings (Bornehag 2001; Bornehag 2004; IoM 2004a; WHO 2009). According to these reviews, dampness and mould in buildings are associated with adverse respiratory symptoms. Bornehag 2001 lists 51 studies, in most of which a relationship exists between self reported dampness and asthma, coughing and wheezing (odds ratios (OR) ranging from 1.4 to 2.2). Bornehag 2004 found 15 studies, 13 of which showed a relationship between asthma or wheezing and dampness. The third review from the USA found sufficient evidence of a relationship between dampness or mould exposure and upper respiratory tract symptoms, coughing, wheezing and exacerbations of asthma (IoM 2004a). A more recent review also came to similar conclusions (Mendell 2011).
The reviews found limited evidence that dyspnoea (defined as shortness of breath) is associated with dampness, or that lower respiratory tract infections (LRTIs) are related to dampness or mould exposure. However, a recent meta‐analysis (Fisk 2007), which was based on the Institute of Medicine (IoM) review, yielded ORs that ranged from 1.34 to 1.75 for upper respiratory tract symptoms, coughing, wheezing, current asthma, asthma diagnosed at some stage and asthma development. With the exception of asthma development, the lower limit of the confidence interval (CI) exceeded 1.2. Interpretations across the world differ between the causal relationship of these exposures and health effects but the reviews agree that a need exists for increased public awareness and health measures to reduce dampness in buildings.
Exposure to damp buildings occurs in three different ways. First, people are exposed in their residences. It has been estimated that two‐thirds of one‐family houses and 60% of apartments are damaged by dampness during their intended period of use in Finland (Koivisto 1996; Nevalainen 1998; Partanen 1995). Second, workers are exposed at their workplaces. Third, children can be affected if they are exposed at school or at daycare centres.
Description of the intervention
The intervention in this review is remediation of damp buildings. Controlled trials have been carried out in schools: Savilahti 2000 studied children in two elementary schools and found that after renovation of moisture‐damaged buildings, the prevalence of respiratory symptoms decreased and was no longer significantly different from the control group. Another study dealing with mould‐damaged school buildings compared the effectiveness of different kinds of renovations (Meklin 2002). One school was repaired thoroughly, one partially and one was left unrepaired. A school without mould problems was used as a control. The health improvements correlated with the degree of renovations: if no repairs were conducted, no improvement in health was observed. The longer pupils had been exposed to mould, the smaller the improvement in health observed after repairs.
In addition, follow‐up studies of before‐after comparisons in schools (Åhman 2000) and among workers (Sudakin 1998) report success in reducing symptoms. Similar studies have been performed on people working in contaminated buildings (Jarvis 2001). However, not all interventions seem to be successful (Rudblad 2002).
Although most trial authors studied self reported symptoms, there is some evidence that lung function measurements are also influenced by the interventions (Ebbehøj 2002).
How the intervention might work
Moulds and other micro‐organisms do not grow without dampness, so when a building is damp, it will also contain microbes (IoM 2004b). Dampness is the driving factor and yet health effects are mostly considered to be associated with microbial exposure, even though the specific causative agent is still unknown. In addition, analysis and measurement of mould exposure is difficult, whereas moisture damage due to dampness of buildings can be investigated more readily. Remediation of the buildings aims to remove damaged material (that usually also contains mould) and repair the causes of dampness (leaking roof or pipes, faults in construction, etc.). Interventions in this review included cleaning, repairing all relevant causes of moisture damage, removing damaged materials and replacing them with new ones, or effectively drying construction materials that could not be replaced (for example, concrete). In addition, if general remediation (for example, improving ventilation or other improvements to indoor air) was reported, this was taken into account in the evaluation, in which case the change in mould and moisture was noted.
Why it is important to do this review
We do not know of any previous reviews that summarise results of intervention studies in damp buildings. However, the World Health Organization (WHO) recommends that dampness and mould‐related problems should be prevented and should be renovated when they occur because they increase the risk of hazardous exposure to microbes and chemicals (WHO 2009). We wanted to conduct a systematic review of the effects of repairing buildings damaged by dampness and mould on the prevention of recurrent acute respiratory tract symptoms, respiratory tract infections (RTIs) and asthma. RTI related to mould exposure is an important issue among children. In adults, the highest OR was for upper respiratory tract symptoms, followed by coughing, wheezing and current asthma (Fisk 2007). The association between recurrent acute RTIs and mould exposure is not clear; no causal relationship has been shown in studies. At work, asthma and asthma‐like symptoms are important concerns. In 2007 in Finland, exposure to mould in the workplace was the most often reported cause of occupational asthma (37%) (Karjalainen 2007). If building repairs can be justified by evidence‐based data as having positive health effects, the number of buildings repaired will increase, improving the health of those exposed.
Objectives
To determine the effectiveness of repairing buildings damaged by dampness and mould in order to reduce or prevent respiratory tract symptoms, infections and symptoms of asthma.
Methods
Criteria for considering studies for this review
Types of studies
Randomised controlled trials (RCTs), cluster‐RCTs (cRCTs), controlled before‐after (CBA) studies and interrupted time series (ITS) studies.
We anticipated that the availability of RCTs for this topic would be limited, due to the fact that these interventions are very different from clinical interventions. Remediation of moisture‐damaged buildings is not implemented at an individual level; instead, the intervention is applied to a building and the health consequences for all individuals are followed. For example, schools have been repaired either thoroughly, partially or left without repairs, and the health of pupils has been observed. This makes individual randomisation impossible. In principle, this can be partly overcome by randomisation at the building level, as in a cluster‐RCT. Randomisation of buildings is difficult because damage usually occurs in isolated buildings and it is very difficult to gather enough buildings to make randomisation possible. Therefore, we also included the following non‐randomised designs in our review: CBA studies and ITS studies.
CBA studies (also called prospective cohort studies) are easier to perform, taking into account that the intervention is carried out at group level and that they still have reasonable validity. We have defined controlled before‐after studies as studies in which measurements of the outcome are available both before and after the implementation of the intervention and for both the intervention and control group. We defined a control group as a group that is similar to the intervention group but has not undergone an intervention or an alternative intervention. In addition, we included controlled before‐after studies with a non‐exposed control group. Here, the hypothesis is that after the intervention, the outcome in the intervention group will have decreased to the same level as in the non‐exposed control group ‐ a so‐called equivalence study design.
ITS studies are studies with or without a control group in which the outcome has been measured at least three times before the intervention and at least three times after the intervention. The intervention is applied at a specific well‐defined moment in time and is supposed to have either an immediate effect measured as an immediate change in outcome rates post‐intervention compared to an extrapolation of the pre‐intervention time trend, or a long‐term effect, measured as a change of the time trend of the outcome rates from pre‐intervention to post‐intervention. The respiratory health outcome is measured several times before and after the intervention, therefore it is possible to take time trends into account and thus make up for the lack of a control group.
We also collected uncontrolled before‐after studies and case studies to use not as evidence of effectiveness but to compare with the results of higher‐quality studies in the Discussion section.
Types of participants
The review focused on studies of children (inhabitants of buildings, pupils of schools or children in daycare centres) and adults (inhabitants of buildings or employees) in buildings that had been damaged by water or moulds. We only accepted studies where the exposure was verified by samples taken from the air, dust or building materials, by specialist inspection or by participants' self reported observations of dampness through questionnaires or interviews (Koskinen 1999a).
Types of interventions
We included all interventions that involved repairs to buildings with moisture or mould damage. We categorised them according to the amount of repairs that had been carried out, that is either thoroughly repaired or partially repaired buildings. We compared these to cases of no intervention or, if data were available, among different categories of interventions.
Types of outcome measures
Primary outcomes
We included studies that reported data (incidence or prevalence) on acute RTIs, allergic alveolitis, asthma, asthma‐like symptoms or other respiratory symptoms as outcome measures, based on medical measurements, medical records or self reported symptoms. We grouped outcomes in the studies into one of the following four categories.
Respiratory symptoms: any of these respiratory symptoms reported by means of a questionnaire (sore throat, eye irritation, nasal congestion, runny nose or sneezing).
Respiratory infections: acute respiratory infections (influenza‐like symptoms, rhinitis, influenza, common cold, tonsillitis, otitis, bronchitis, sinusitis, conjunctivitis or pneumonia) based on medical records or as self reported diseases.
Allergic alveolitis (as physician's diagnosis) (Lacasse 2003).
-
Asthma‐related outcomes or asthma‐related symptoms by means of:
physician's diagnosis as reported by patients or their parents (of the children) (Toren 1993; Toren 2006); or
asthma symptoms measured by a validated questionnaire (Burney 1989); or
prescription of medication for asthma; or
diagnostic tests for asthma (hyper‐responsiveness of the airways, bronchodilator response, variation in peak expiratory flow (PEF) measurements, increased exhaled nitric oxide (NO)) (Pellegrino 2005); or
self reported respiratory symptoms (coughing, wheezing, chest tightness or shortness of breath).
We included outcome measurements at any follow‐up time after the intervention.
Search methods for identification of studies
Electronic searches
For this November 2014 update we searched the Cochrane Central Register of Controlled Trials (CENTRAL 2014, Issue 10) (accessed 18 November 2014), which includes the Cochrane Acute Respiratory Infection Group's Specialised Register, the Cochrane Occupational Health Field's Specialised Register and Economic Evaluations, MEDLINE (April 2011 to November week 1, 2014), EMBASE (May 2011 to November 2014), CINAHL (May 2011 to November 2014), Science Citation Index (2011 to November 2014), NIOSHTIC (1930 to March 2014) and CISDOC (1974 to March 2014). We did not repeat the search in Biosis Previews as we did not have access to this database any more and it did not result in any relevant studies in the previous search. We did not apply any language or publication restrictions.
For our original 2011 review we searched the Cochrane Central Register of Controlled Trials (CENTRAL 2011, Issue 2) (accessed 15 June 2011), which includes the Cochrane Acute Respiratory Infection Group's Specialised Register, the Cochrane Occupational Health Field's Specialised Register and Economic Evaluations, MEDLINE (1951 to June week 1, 2011), EMBASE (1974 to June 2011), CINAHL (1982 to June 2011), Science Citation Index (1973 to June 2011), Biosis Previews (1989 to June 2011), NIOSHTIC (1930 to November 2010) and CISDOC (1974 to November 2010).
We used the terms listed in Appendix 1 to search MEDLINE and CENTRAL. We adapted these terms to search EMBASE (Appendix 2), CINAHL (Appendix 3), Science Citation Index (Appendix 4), Biosis Previews (Appendix 5), NIOSHTIC (Appendix 6) and CISDOC (Appendix 7). We did not use a filter for study type for this 2014 update.
Searching other resources
We searched the databases of the World Health Organization (WHO) and the UK National Health Service. We screened the reference lists of all relevant papers for additional studies and we contacted trial authors of published trials and other experts in the field for information on unpublished trials (Lefebvre 2011).
Data collection and analysis
Selection of studies
Two review authors (RS, MJ) independently screened the identified titles and abstracts to choose potential studies using both the inclusion and exclusion criteria. We obtained the full text of articles that appeared to meet the inclusion criteria. We resolved disagreements by discussion and consulted a third review author (JV) if disagreements persisted.
Data extraction and management
We did not apply blinding of studies as we expected to recognise the studies. Two review authors (RS and JU) independently extracted data into data extraction forms. The form included essential study characteristics of the design, the participants and interventions, primary, secondary and intermediate outcomes, and results. We also noted any adverse events and the sponsorship of the study.
Assessment of risk of bias in included studies
Two review authors (RS, JU) independently assessed the quality of the studies by using a consensus method if disagreements occurred. A third review author (JV) was consulted if disagreement persisted. We contacted the trial authors to provide additional information if information was missing for the evaluation of the methodological criteria.
We used the 'Risk of bias' tool recommended in the Cochrane Handbook for Systematic Reviews of Interventions to assess the methodological quality of the included RCTs and cRCTs (Higgins 2011).
We used a validated instrument to appraise controlled before‐after studies (Downs 1998). The instrument has been shown to have good reliability, internal consistency and validity. We only used the scales on internal validity to judge the risk of bias of the included studies. We analysed the studies separately according to the study design.
Measures of treatment effect
We plotted the results for RCTs and controlled before‐after studies as odds ratios (ORs) and their 95% confidence intervals (CIs) for dichotomous outcomes and means and standard deviations (SD) for continuous outcomes. For Hoppe 2012, as results were adjusted for multiple confounders in the analysis, we used the most adjusted natural logarithm of these ORs and their standard errors for input into RevMan 2014 using the generic inverse variance method.
Unit of analysis issues
Only one study employed a cRCT design and the trial authors adjusted for the cluster effect in their analyses. We used the raw data as reported by the authors for input into RevMan 2014 because the effect sizes were only slightly different after adjustment and the clusters were very small.
Meklin 2005a and Meklin 2005b measured health symptoms both in spring and autumn. To prevent reporting multiple similar outcomes, we took the average of these answers and used these to calculate the average number of respondents that answered positively to a question. This in turn was used as input for the number of events in RevMan 2014.
Dealing with missing data
We contacted trial authors to obtain missing data in their reports, which were needed for meta‐analysis. Shortt 2007 provided the numbers of people in the intervention and control groups. Howden‐Chapman 2007 and Savilahti 2000 sent extra data files. Hoppe 2012 could not provide the baseline data for the participants.
We calculated missing statistics, such as standard deviations (SDs) or correlation coefficients, from other available statistics such as the P values according to the Cochrane Handbook for Systematic Reviews of Interventions (Higgins 2011).
From Jarvis 2001, we could only extract data for the case definitions "building related symptoms" and "respiratory illness", but not for single symptoms, because the symptom rates of both the index and control group were not reported systematically before and after remediation of the building. Jarvis did not report the symptom rate in the control group after the intervention. Therefore, we assumed that it was similar to that before the intervention.
From Kercsmar 2006, we extracted data on the mean asthma symptom days from the figures in the article. Two review authors (RS, JV) independently did this and obtained the same results. After extraction, we transformed the data to natural logarithm values as used by the authors. From these values, we calculated the standard error (SE) from the 95% CI based on the formula SE=(upper limit ‐ lower limit)/3.92, according to the Cochrane Handbook for Systematic Reviews of Interventions (Higgins 2011). We then calculated the SD from the SE using the formula SE=SD/SQRT(N) for input into the data tables in RevMan 2014.
In the case of Åhman 2000, two review authors (RS, JV) independently extracted the percentages for the outcomes from the figures and obtained the same results.
Patovirta 2004a reported a prevalence of respiratory infections and spirometry results but we could not use them as both the results of the control group and the baseline values were missing. We calculated SDs from the P values given in the article as they were not provided for the grouped symptoms. We calculated the F value based on the P values, taking the square root from the F value to equal the t‐value. We then calculated the SDs based on the formula SE=MD/t according to the Cochrane Handbook for Systematic Reviews of Interventions (Higgins 2011).
Savilahti 2000 reported the mean number of children's visits to a physician due to different respiratory infections that the authors found in the patient records and 95% CIs, which we recalculated into SDs. We could not calculate similar data for the self reported data of the patients despite getting extra data files from the trial authors.
We calculated numbers from the table in the Shortt 2007 article, since the trial authors could not provide them due to loss of the original files. We corrected the numbers of the control and intervention groups that were erroneously reversed in the article.
Assessment of heterogeneity
We defined clinically homogeneous studies as those with similar populations (inhabitants of houses, adults in schools and school children), interventions (any remediation of the buildings) and outcomes (asthma‐related symptoms, respiratory infections, respiratory symptoms) measured at the same follow‐up point (one to three‐year follow‐up). We also tested for statistical heterogeneity by means of the Chi2 test as provided in the meta‐analysis graphs. If the I2 statistic value resulting from this test is greater than 50%, heterogeneity among studies is substantial.
Assessment of reporting biases
We intended to assess publication bias with a funnel plot but the number of studies for this was insufficient.
Data synthesis
We pooled studies with sufficient data, judged to be clinically homogeneous, using RevMan 2014. We used a random‐effects model when studies were statistically heterogeneous, otherwise we used a fixed‐effect model.
We have presented results separately for RCTs and controlled before‐after studies.
We used the GRADE approach as described in the Cochrane Handbook for Systematic Reviews of Interventions to present the quality of evidence (Higgins 2011). For RCTs we took high quality as the initial quality level and downgraded it to moderate, low or very low quality if there were one or more limitations according to the criteria 'risk of bias', 'consistency of results', 'directness of evidence', 'precision of results' or 'existence of publication bias'. For non‐randomised studies we took low quality as the level of departure and upgraded the level to moderate or high quality if the included studies had large effects or no obvious bias. We further downgraded the quality to very low‐quality evidence if the studies had limitations. The results of the grading of the evidence are shown in Table 1.
1. Grading of the evidence.
| Comparison | Outcome | Risk of bias | Inconsistency | Indirectness | Imprecision | Publication bias | Quality of the evidence |
| House remediation versus no remediation Adults | Asthma‐related symptoms | 2 RCTs (low risk of bias) and 1 CBA study (high risk of bias) | Inconsistent results between the high risk of bias study and the low risk of bias studies | ‐ | ‐ | ‐ | Moderate‐quality evidence |
| Asthma medication | 1 RCT (low risk of bias) | Perceived change in medication inconsistent with the reported use of medication | ‐ | ‐ | ‐ | Moderate‐quality evidence | |
| Respiratory infections | 2 RCTs (low risk of bias) and 1 CBA study (high risk of bias) | ‐ | ‐ | Wide CIs in the high risk of bias study | ‐ | Moderate‐quality evidence | |
| Completed house remediation versus remediation in progress Adults | Asthma‐related symptoms | 1 CBA study (high risk of bias) | ‐ | ‐ | ‐ | Very low‐quality evidence | |
| Office building remediation versus no exposure Adults | Asthma‐related symptoms | 1 CBA study (high risk of bias) | ‐ | ‐ | ‐ | ‐ | Very low‐quality evidence |
| Respiratory symptoms | 1 CBA study (high risk of bias) | ‐ | ‐ | ‐ | ‐ | Very low‐quality evidence | |
| House remediation versus information Children | Asthma‐related symptoms | 1 cRCT (low risk of bias) | ‐ | ‐ | In a mixed model a significant decrease at 10‐month follow‐up | ‐ | Moderate‐quality evidence |
| Number of acute care visits | 1 cRCT (low risk of bias) | ‐ | ‐ | A significant decrease only 6 to 12 months after remediation | ‐ | Moderate‐quality evidence | |
| House remediation versus no remediation Children | Asthma‐related symptoms | 1 CBA study (high risk of bias) | ‐ | ‐ | ? | ‐ | Very low‐quality evidence |
| Respiratory symptoms | 1 CBA study (high risk of bias) | ‐ | ‐ | ? | Very low‐quality evidence | ||
| School remediation versus no exposure Children | Asthma‐related symptoms | 2 CBA study (high risk of bias) | ‐ | ‐ | Wide CIs | ‐ | Very low‐quality evidence |
| Respiratory infections | 1 CBA study (high risk of bias) | ‐ | ‐ | ‐ | ‐ | Very low‐quality evidence | |
| Respiratory symptoms | 2 CBA study (high risk of bias) | ‐ | ‐ | ‐ | ‐ | Very low‐quality evidence | |
| School remediation versus no exposure Adults | Asthma‐related symptoms | 2 CBA studies (high risk of bias) | Inconsistent results | ‐ | Wide CIs | ‐ | Very low‐quality evidence |
| Respiratory infections | 1 CBA study (high risk of bias) | ‐ | ‐ | No control group data | ‐ | Very low‐quality evidence | |
| Respiratory symptoms | 2 CBA studies (high risk of bias) | Inconsistent results | ‐ | Wide CIs | ‐ | Very low‐quality evidence |
CI = confidence interval RCT = randomised controlled trial CBA = controlled before‐after study cRCT = cluster‐randomised controlled trial
Subgroup analysis and investigation of heterogeneity
We accepted studies in which exposure was assessed by measuring fungal spores in the air or using cultures obtained from settled dust or material samples, visual observations of mould growth, or signs of moisture damage. We intended to perform a subgroup analysis according to exposure grade but the number of studies for this was insufficient.
Sensitivity analysis
We intended to perform a sensitivity analysis but the high‐quality studies were too few in number.
Results
Description of studies
Results of the search
The original search retrieved a total of 6135 references from CENTRAL, MEDLINE, EMBASE, CINAHL, Science Citation Index, Biosis Previews, NIOSHTIC and CISDOC. Two review authors (MJ, RS) reviewed the retrieved results. We ran an updated search in June 2011 and retrieved a further 209 references. In all, 587 references dealt with the subject of the review. On the basis of the title and abstract, 19 seemed to fulfil the inclusion criteria and we read the full text. Two review authors (RS, JU) independently reviewed these results and seven articles fulfilled our inclusion criteria. We handsearched the reference lists of these articles and this yielded four academic dissertations (Immonen 2002; Koskinen 1999b; Patovirta 2005; Taskinen 2001) and one additional study. We included eight studies in the first version of our review.
For this 2014 update, we retrieved 3781 references, 24 of which were intervention articles reporting the effects of remediation of mould‐damaged buildings. Two review authors (RS, JV) independently reviewed the full papers and we considered two studies to fulfil the inclusion criteria (Eick 2011; Hoppe 2012). In addition, we found two articles dealing with two studies that were published previously (Meklin 2005a; Meklin 2005b). Therefore, we were able to include four new studies in our review, resulting in 12 included studies.
Included studies
Study design
Of the 12 studies, three were RCTs (one of which was a cRCT) and nine were CBA studies. We did not identify any ITS studies. In two studies the unit of randomisation was either the household (N = 1350) or the house (N = 100) (Howden‐Chapman 2007; Shortt 2007).
In one CBA study, symptoms of occupants of a large office building (N = 488) were compared before intervention and after reoccupation of the building (Jarvis 2001). The occupants of a non‐damaged building served as a control group.
In another CBA study, symptoms of inhabitants of flood‐damaged homes were studied (Hoppe 2012). The symptoms of residents of in progress homes (n = 23) were compared to those whose homes were remediated completely (48).
Eick 2011 included a pilot study and a main study. The pilot study compared different allergen‐reducing interventions with a control group but the main study did not have a control group. Therefore, we included only the pilot study in this review.
In five CBA studies, a specific group of pupils or teachers (N = 44, 397, 525, 622 and 749) of moisture‐damaged schools was followed and compared to the control group of a non‐damaged school (Åhman 2000; Meklin 2005a; Meklin 2005b; Patovirta 2004a; Savilahti 2000).
Year and geographical location
Four studies were performed before 2000 and eight after this time. Three studies were conducted in the USA, four in Finland, one in Sweden, one in Ireland, one in New Zealand and two in the UK.
Participants
The characteristics of the participants were not reported in detail in three studies (Jarvis 2001; Patovirta 2004a; Shortt 2007). The participants were all adults in the Patovirta 2004a and Hoppe 2012 studies. Shortt 2007 focused on elderly people but did not report the age or gender of the participants. Jarvis 2001 also gave no more details of the participants other than that they were adult employees. In five studies, the participants were only children (Eick 2011; Kercsmar 2006; Meklin 2005a; Meklin 2005b; Savilahti 2000). Three studies reported symptoms of both children and adults (Åhman 2000; Burr 2007; Howden‐Chapman 2005). The sample sizes varied from 24 to 4407 participants, with an average of 669 participants.
Exposure
In nine studies, water, mould or damp damage were determined on the basis of specialist inspections (Åhman 2000; Burr 2007; Eick 2011, Hoppe 2012; Jarvis 2001; Kercsmar 2006; Meklin 2005a; Meklin 2005b; Patovirta 2004a). In addition, four studies measured indoor humidity (Burr 2007; Eick 2011; Hoppe 2012; Kercsmar 2006) and seven studies took microbiological samples (Eick 2011; Jarvis 2001; Kercsmar 2006; Meklin 2005a; Meklin 2005b; Patovirta 2004a; Savilahti 2000). In two studies, the exposure to moulds was based on participants' own reports (Howden‐Chapman 2005; Shortt 2007). In the study by Kercsmar 2006, dust samples were obtained from a child's bedroom and, in addition to mould, measurements of dust mite, cockroach, mouse and rat urine allergens and endotoxin were also taken. In addition to relative humidity and airborne microbes, also coarse particles, fine particles, wall surface moisture, dust mite allergens, carbon dioxide and carbon monoxide were measured in the Eick 2011 study.
The effectiveness of remediation was verified with the same measures as the exposure before intervention in seven studies. In one study the post‐intervention measurements were not mentioned (Åhman 2000).
Interventions
The contents of the interventions are summarised in Table 2.
2. Contents of interventions aimed at eradicating indoor mould.
| Study | Type of intervention | Verification of mould damage | Control group | Notes | ||||
| Thorough remediation | Limited structural changes | Cleaning | Specialist observation |
Microbiological samples |
Self report | |||
| Burr 2007 | X | X | People in mould‐damaged houses (waiting list) |
|||||
| Eick 2011 | X (mechanical ventilation, laminate flooring, central heating, central vacuum cleaning) |
X | X | People in mould‐damaged houses, no intervention |
Mould or mould damage was observed in 55% of the homes before intervention Only the pilot study was included in the review |
|||
| Hoppe 2012 | X | X | X | People in mould‐damaged houses, remediation in progress |
||||
| Howden‐Chapman 2007 | X (insulation package) | X | People in mould‐damaged houses (waiting list) |
|||||
| Jarvis 2001 | X | X | X | People in a healthy building | ||||
| Kercsmar 2006 | X | X | X | People in mould‐damaged houses (waiting list) |
||||
| Meklin 2005a | X | X | X | X | People in a healthy school | |||
| Meklin 2005b | X | X | X | X | People in a healthy school | |||
| Patovirta 2004a | X | X | X | People in a healthy school | Intervention reported in a separate article | |||
| Savilahti 2000 | X | X | X | People in a healthy school | ||||
| Shortt 2007 | X (central heating) | X | People in mould‐damaged houses, no intervention |
|||||
| Åhman 2000 | X | X | People in a healthy school | |||||
In seven studies the repairs aimed to remediate the wet structures and prevent further mould damage (Åhman 2000; Hoppe 2012; Jarvis 2001; Kercsmar 2006; Meklin 2005aPatovirta 2004a; Savilahti 2000). In four studies, the repairs were not as extensive or technical improvements were made (Eick 2011; Howden‐Chapman 2007; Meklin 2005b; Shortt 2007). In one study, the house was only cleaned thoroughly with fungicides without removing damaged structures and a positive input fan was installed (Burr 2007).
The repairs made to the school buildings were not described in detail in all studies but water‐damaged material was removed and replaced with new material. Structural changes to prevent further water leakage were also carried out. One article describes two studies, one partial remediation of a school building (Meklin 2005b) and one complete remediation (Meklin 2005a). Kercsmar 2006 directed interventions at reducing water infiltration, removing water‐damaged building materials, making alterations to heating/ventilation/air conditioning, lead hazard control and environmental cleaning. General strategies included cleaning mould from hard surfaces, removing mould exposure pathways, stopping rainwater intrusion, exhausting water vapour from kitchens and bathrooms and repairing plumbing leaks. Specific interventions included repairing faulty cold‐air return to furnaces, eliminating sub‐slab heating duct systems, disconnecting and redirecting downspouts and reducing moisture in crawlspaces and basements.
Howden‐Chapman 2007 described an intervention that included installing ceiling insulation, preventing draught around windows and doors, fitting sisal‐containing paper beneath floor joists and a polythene moisture barrier on the ground beneath the house. Intervention integrity or compliance was checked by energy consumption from regional electricity and gas companies. In Shortt's study the main intervention was installing a heating system (Shortt 2007), in addition to minor improvements. Retrofitted, whole‐house mechanical ventilation with heat recovery system, laminate flooring, anti‐allergy bedclothes, a central vacuum cleaner and central heating were installed in the Eick 2011 study.
In the Jarvis 2001 study, the primary intervention proved to be insufficient, resulting in a second, more profound remediation. In the first intervention, they removed visibly mouldy gypsum board, made structural changes including the replacement of windows and installed a vapour‐air retarder. The second renovations included the removal of mouldy wallboard, installation of Heating Ventilation and Air‐conditioning (HVAC) insulation, the discarding of upholstered furniture, cleaning of interior surfaces and discarding of damaged books and archives.
Control group
In two RCT studies and in one CBA study the control group was composed of a waiting list in which mould‐exposed houses did not receive any remediation until the end of the intervention of the study group (Burr 2007; Eick 2011; Howden‐Chapman 2007). In the Burr 2007 study an anti‐mould kit was given one year later to the control group and in the Howden‐Chapman 2007 study the houses of the control group were insulated at the end of the study. In the Kercsmar 2006 study, families randomised to the control group were given information on how to improve home indoor air quality but were given no specific tangible resources, materials or advice to do so. At the end of the study, participants in the control group were given a vacuum cleaner and offered home remediation. Water‐damaged homes where remediation was completed were compared to homes where remediation was in progress in Hoppe 2012.
In five school studies, the control group consisted of pupils or teachers in non‐damaged schools, at which no intervention was targeted (Åhman 2000; Patovirta 2004a; Savilahti 2000; Meklin 2005b; Meklin 2005a). The studies were thus set up to show that repairing water‐damaged buildings leads to outcomes as in non‐exposed persons in normal buildings. We called these 'equivalence studies'. Jarvis 2001 used two control groups: occupants of a comparison building not known to have indoor air complaints and occupants who had relocated from the subject building one month earlier. However, the before and after evacuation results of the latter are not systematically reported. In the Shortt 2007 study, the control group was exposed to moulds but did not undergo an intervention.
Follow‐up
The follow‐up time varied from seven months to five years and in six studies was one year.
Health outcomes
All studies used self administered questionnaires to survey various health‐related issues. Items related to respiratory health composed the majority of the questions. Objective measurements were used in four studies: one measured peak expiratory flow (PEF) rate variability (Burr 2007); one checked the number, duration and main International Classification of Diseases (ICD)‐10 codes for hospital admissions (Howden‐Chapman 2007); one reported the number of respiratory infections and use of antibiotics from the patient records (Savilahti 2000); and two studies measured changes in lung function measurements (Kercsmar 2006; Patovirta 2004a). One outcome in the Jarvis 2001 study was hypersensitivity pneumonitis but no results of this are shown. The authors used the term hypersensitivity pneumonitis instead of allergic alveolitis. We did not identify any studies reporting the outcome "allergic alveolitis".
Excluded studies
Seven studies were excluded because they were prospective cohort studies without a control group (Bernstein 1983; Haverinen‐Shaughnessy 2004; Lloyd 2008; O'Sullivan 2012; Patovirta 2004b; Santilli 2003; Stubner 2000). Howden‐Chapman 2005 provided no information regarding respiratory health data but these are presented in another paper included in the review. Morgan 2004 focused on the exposure to dust mites, passive smoking, cockroaches, pets and rodents, as well as mould and it was impossible to extract the effects on respiratory health of mould remediation alone. Dotterud 2012 was also multi‐targeted and the authors themselves conclude: "As we did not find any difference between the cohorts regarding indoor dampness, the reduced incidence of asthma could not be ascribed to this interventional measure." Three studies did not report respiratory health outcomes (Butterfield 2010; Dhar 2012; Reynolds 2012). In one study there was no verified water damage or dampness in the buildings (Norback 2011), or no intervention (Zhang 2012).
Risk of bias in included studies
The risk of bias of the included studies is presented in Figure 1 and in Figure 2. The maximum internal validity score of the RCTs and cRCTs was nine out of 13 points. In three CBA studies it was seven points and in two it was five points. The reporting quality score was high, 10 to 11 points out of 11, in the RCT and cRCT studies and in one controlled before‐after study, two CBA studies scored nine points out of 11 and two CBA studies two to four points.
1.
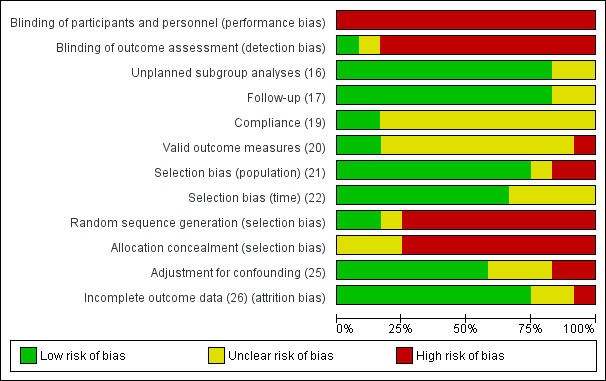
'Risk of bias' graph: review authors' judgements about each risk of bias item presented as percentages across all included studies.
2.
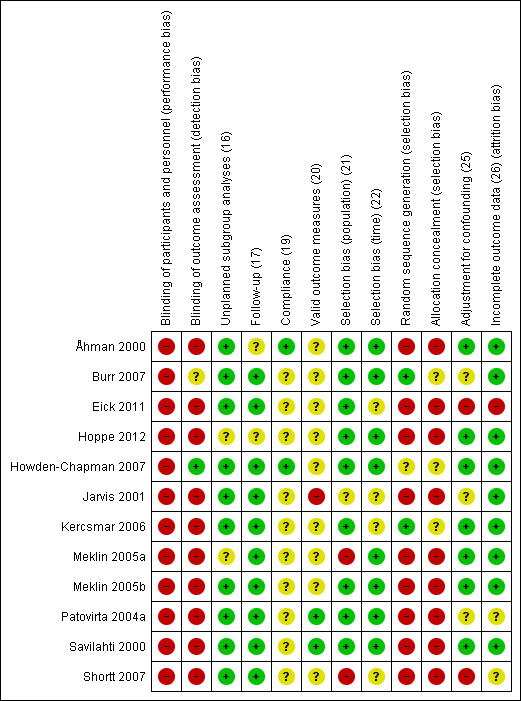
'Risk of bias' summary: review authors' judgements about each risk of bias item for each included study.
Allocation
A permuted block scheme was used in Kercsmar 2006. The other two RCT studies did not explain the method of allocation.
Blinding
The study participants were not blinded, with the exception of one study (Howden‐Chapman 2007), in which the outcome assessors were blinded. The independent building inspectors and the community interviewers were not told which households were in the intervention group. However, because the householders knew which houses belonged to the intervention group, some of them may have revealed it to the interviewers, which means concealment may have been questionable.
Incomplete outcome data
The number of participants lost to follow‐up was clearly reported in six studies but only three studies gave characteristics of the participants that dropped out or reasons for it (Burr 2007; Howden‐Chapman 2007; Kercsmar 2006).
Kercsmar 2006 used an intention‐to‐treat (ITT) analysis and reported the results as both "as‐treated" and "as‐randomised" analyses.
Selective reporting
The trial by Howden‐Chapman 2007 did not report the results of measured fungal activity, allergens or smoking in the paper included in this review. Multiple logistic regression was used to analyse the relation between symptoms and school in Åhman 2000. However, not all of these results were reported in the paper. In Patovirta 2004a, spirometry results were reported only at the end of mould repair in the index and control group, and the follow‐up data concern only the index group. Results of self reported health status were shown only from the index group. Evidently Jarvis 2001 used multiple regression analyses to adjust confounders but the results are not shown. In two studies the authors do not present the results adjusted to confounding variables but state that adjustment did not affect the results (Meklin 2005a; Meklin 2005b). The results of Meklin 2005a are published in another article but in addition to the data two years before and after intervention, there are data from surveys one year before and after remediation and also during remediation (Lignell 2007, see Meklin 2005a).
Other potential sources of bias
Especially in the non‐randomised studies there were important baseline differences between the intervention and control groups. Only three studies tried to adjust for these differences in their analyses (Table 3).
3. Quality rating of included studies.
| Study |
Reporting quality range 0 to 11 |
External validity range 0 to 3 |
Internal validity total range 0 to 13 |
Blinding participants |
Blinding outcomes |
Blinding allocation |
Randomised | Adjusted confounding | Adjusted lost follow‐up |
| Burr 2007 | 10 | 2 | 9 | 0 | 0 | 0 | 1 | 1 | 0 |
| Eick 2011 | — | — | — | — | — | — | — | — | — |
| Hoppe 2012 | — | — | — | — | — | — | — | — | — |
| Howden‐Chapman 2007 | 11 | 3 | 8 | 0 | 0 | 0 | 1 | 1 | 1 |
| Jarvis 2001 | 4 | 3 | 4 | 0 | 0 | 0 | 0 | 0 | 0 |
| Kercsmar 2006 | 11 | 1 | 8 | 0 | 0 | 0 | 1 | 0 | 1 |
| Meklin 2005a | — | — | — | — | — | — | — | — | — |
| Meklin 2005b | — | — | — | — | — | — | — | — | — |
| Patovirta 2004a | 7 | 1 | 7 | 0 | 0 | 0 | 0 | 0 | 1 |
| Savilahti 2000 | 11 | 3 | 7 | 0 | 0 | 0 | 0 | 0 | 1 |
| Shortt 2007 | 2 | 1 | 5 | 0 | 0 | 0 | 0 | 0 | 0 |
| Åhman 2000 | 9 | 3 | 7 | 0 | 0 | 0 | 0 | 1 | 1 |
0 = criterion not met 1 = criterion met
Effects of interventions
1A. Mould remediation versus no intervention in houses ‐ effects in adults
We identified three studies for this comparison (Burr 2007; Howden‐Chapman 2007; Shortt 2007). One included the removal of all visible mould, fungicide treatment in mould‐damaged houses and the installation of a positive input fan in damaged houses (Burr 2007). The other intervention was the installation of a standard retrofit insulation package (Howden‐Chapman 2007). One study reported changes in respiratory symptoms at six and 12 months after intervention (Burr 2007), and the other reported results only one year after the trial (Howden‐Chapman 2007). We rated these studies as high quality. The study Shortt 2007 is a controlled before‐after study evaluating the effect of energy efficiency measures, including a central heating system, on specific illnesses of the participants.
1.1. Asthma‐related outcomes or asthma‐related symptoms in randomised controlled trials (RCTs)
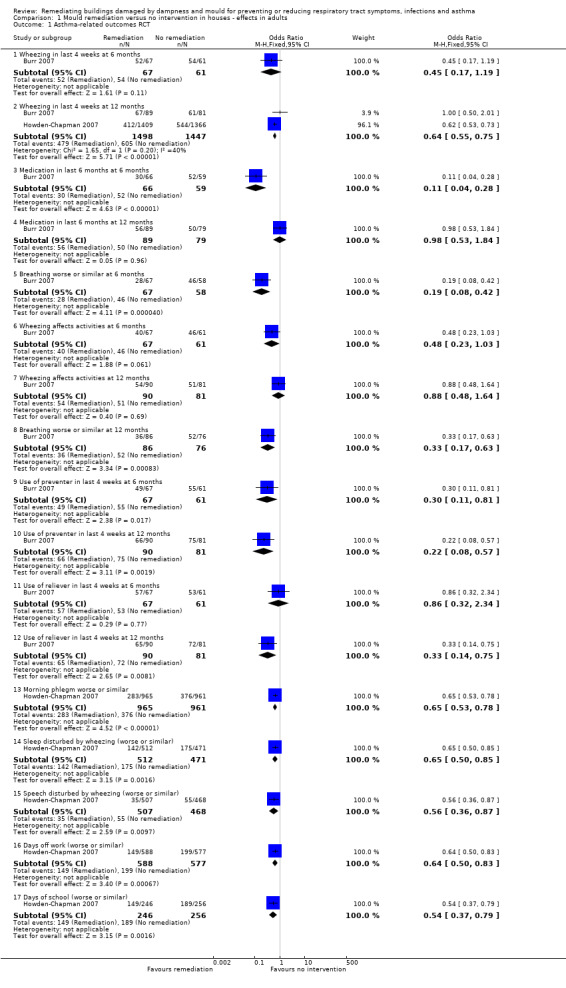
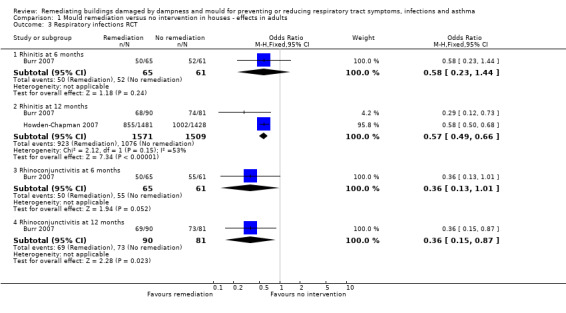
For the comparison of remediation versus no remediation, remediation improved asthma‐related symptoms (wheezing) compared to no intervention with an odds ratio (OR) of 0.45 (95% confidence interval (CI) 0.17 to 1.19) (Analysis 1.1), but this was not statistically significant at six months after remediation (Burr 2007). At 12‐month follow‐up, the pooled results of Burr 2007 and Howden‐Chapman 2007 showed a significant decrease in asthma symptoms (wheezing) with an OR of 0.64 (95% CI 0.55 to 0.75) (Analysis 1.1.2).
1.1. Analysis.
Comparison 1 Mould remediation versus no intervention in houses ‐ effects in adults, Outcome 1 Asthma‐related outcomes RCT.
Remediation led to a significant perceived change in asthma medication use at six months (OR 0.11; 95% CI 0.04 to 0.28) (Analysis 1.1.3) but not at 12‐month follow‐up (OR 0.98; 95% CI 0.53 to 1.84) (Analysis 1.1.4) when compared to no remediation (Burr 2007). In addition, use of preventive medication diminished significantly at both six and 12 months but use of relievers only at 12 months (Burr 2007). Breathing problems were significantly less at both six and 12 months follow‐up in the intervention group (OR 0.19; 95% CI 0.08 to 0.42 and OR 0.33; 95% CI 0.17 to 0.63, respectively) (Burr 2007).
Remediation decreased morning phlegm in the intervention group compared to the control group with an OR of 0.65 (95% CI 0.53 to 0.78) (Analysis 1.1.13) (Howden‐Chapman 2007). Sleep and speech disturbed by wheezing were also reported less in the intervention group compared to control with OR 0.65 (95% CI 0.50 to 0.85) (Analysis 1.1.14) and 0.56 (95% CI 0.36 to 0.87) (Analysis 1.1.15) (Howden‐Chapman 2007).
1.2. Asthma‐related outcomes in controlled before‐after (CBA) studies
Shortt 2007 found a decrease in reported asthma symptoms after the intervention but ORs were not significant either before or after the intervention: OR at baseline 1.44 (95% CI 0.45 to 4.62) and at follow‐up 0.57 (95% CI 0.10 to 3.25) (Analysis 1.2).
1.2. Analysis.
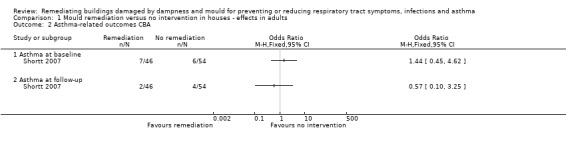
Comparison 1 Mould remediation versus no intervention in houses ‐ effects in adults, Outcome 2 Asthma‐related outcomes CBA.
We conclude that in the comparison of remediation versus no remediation there is moderate‐quality evidence (two low risk of bias studies and one high risk of bias study) that remediation decreases asthma‐related symptoms, compared to no intervention.
1.3 Respiratory infections in RCTs
Remediation decreased rhinitis symptoms at six‐month follow‐up more than no remediation with an OR of 0.58 (95% CI 0.23 to 1.44) (Burr 2007). However, there was evidence that remediation decreased rhinitis and colds or flu at 12‐month follow‐up more than no remediation, with a pooled OR of 0.57 (95% CI 0.49 to 0.66) (Burr 2007; Howden‐Chapman 2007) (Analysis 1.3).
1.3. Analysis.
Comparison 1 Mould remediation versus no intervention in houses ‐ effects in adults, Outcome 3 Respiratory infections RCT.
Rhinoconjunctivitis was also reported less frequently in the intervention group compared to the control group with no intervention at 12‐month follow‐up (OR 0.36; 95% CI 0.15 to 0.87) but not at six months follow‐up (OR 0.36; 95% CI 0.13 to 1.01) (Burr 2007).
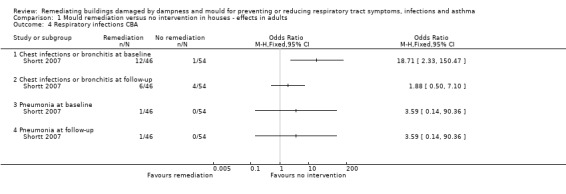
1.4 Respiratory infections in CBA studies
The number of chest infections decreased after remediation in Shortt 2007 when compared to no remediation. At baseline, the OR for chest infections was 18.71 (95% CI 2.33 to 150.47) and at follow‐up 1.88 (95% CI 0.50 to 7.10). There was only one case of pneumonia in the intervention group both at baseline and after intervention, whereas the control group had no cases of pneumonia (OR 3.59; 95% CI 0.14 to 90.36) (Analysis 1.4).
1.4. Analysis.
Comparison 1 Mould remediation versus no intervention in houses ‐ effects in adults, Outcome 4 Respiratory infections CBA.
We conclude that there is moderate‐quality evidence that the remediation of mould in houses decreases respiratory infections in asthma patients and in patients with respiratory symptoms compared to no remediation.
1B. Mould remediation versus no exposure in houses ‐ effects in children
In Eick 2011, the respiratory symptoms of asthmatic children after remediation of homes were compared to children in homes without remediation. The results of the pilot study are presented as medians of symptom scores in three different intervention groups and in the control group. The symptom scores before and after intervention are compared to each other, but not to the control group. In the group receiving mechanical ventilation with heat recovery, the authors report a statistically significant decrease in the symptom scores of cough during day, cough during night, total symptoms score and total asthma symptom score before and after intervention. In the group receiving laminate flooring there were no changes in symptom scores. In the group receiving central heating breathlessness during the day when exercising, cough during the day, runny nose, total symptoms score and total asthma symptom score decreased after intervention. In the control group there were no significant changes in symptom scores. These numbers could not be presented in data tables.
2. Mould remediation complete versus remediation in progress in houses ‐ effects in adults
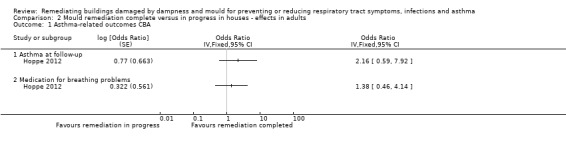
One study compared the results of completed remediation of flooded homes to those whose remediation was in progress (Hoppe 2012). Unfortunately, no baseline data were available for the prevalence of respiratory symptoms and disease before intervention. Therefore, we input the results to RevMan using the generic inverse variance method.
2.1 Asthma‐related outcomes in CBA studies
2.1.1 Asthma at follow‐up
For the comparison of complete remediation versus remediation in progress, we found evidence that asthma‐related outcomes did not decrease after intervention (OR 2.16; 95% CI 0.59 to 7.92) (Hoppe 2012) (Analysis 2.1).
2.1. Analysis.
Comparison 2 Mould remediation complete versus in progress in houses ‐ effects in adults, Outcome 1 Asthma‐related outcomes CBA.
2.1.2 Medication for breathing problems
For the comparison of complete remediation versus remediation in progress, we found evidence that medication for breathing problems did not decrease after intervention (OR 1.38; 95% CI 0.46 to 4.14) (Hoppe 2012) (Analysis 2.1).
2.2 Respiratory symptoms in CBA studies
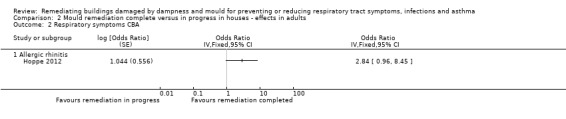
2.2.1 Allergic rhinitis
For the comparison of complete remediation versus remediation in progress, we found evidence that allergic rhinitis did not decrease after the intervention (OR 2.84; 95% CI 0.96 to 8.45) (Hoppe 2012) (Analysis 2.2).
2.2. Analysis.
Comparison 2 Mould remediation complete versus in progress in houses ‐ effects in adults, Outcome 2 Respiratory symptoms CBA.
3. Mould remediation versus no exposure in offices ‐ effects in adults
3.1. Asthma‐related outcomes or asthma‐related symptoms in CBA studies
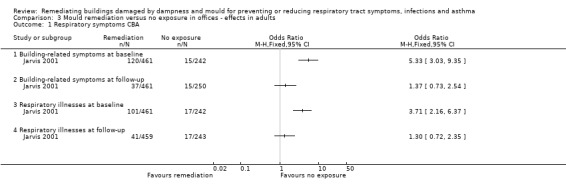
Remediation of an office decreased respiratory asthma‐related symptoms in the intervention group when compared to the non‐exposed control group (Jarvis 2001). At baseline there was a statistically significant difference in the prevalence of respiratory illness between the intervention building and control building (OR 3.71; 95% 2.16 to 6.37), which disappeared after remediation (OR 1.30; 95% 0.72 to 2.35). A case of respiratory illness was defined as an individual respondent who reported at least two out of three chest symptoms: coughing, wheezing or shortness of breath (Analysis 3.1).
3.1. Analysis.
Comparison 3 Mould remediation versus no exposure in offices ‐ effects in adults, Outcome 1 Respiratory symptoms CBA.
3.2 Respiratory symptoms in CBA studies
For the comparison of remediation versus no exposure, remediation decreased building‐related symptoms in the intervention group: at baseline there was a statistically significant difference in the prevalence of building‐related symptoms between the index building and the control building (OR 5.33; 95% CI 3.03 to 9.35), which disappeared after remediation (OR 1.37; 95% CI 0.73 to 2.54) (Jarvis 2001) (Analysis 3.1). Building‐related symptoms were defined as an individual respondent who reported symptoms in at least three of the following five symptom categories, while working in the building: nasal, throat, eyes, neuropsychological or headache.
For the comparison of remediation versus no exposure, we found very low‐quality evidence that asthma‐related symptoms and other respiratory symptoms are more common in occupants of a mould‐damaged office building before remediation. However, after remediation they were similar to those of a control group in a non‐damaged office building.
4. Mould remediation versus information only in houses ‐ effects in children
4.1 Asthma‐related outcomes or asthma‐related symptoms in RCTs
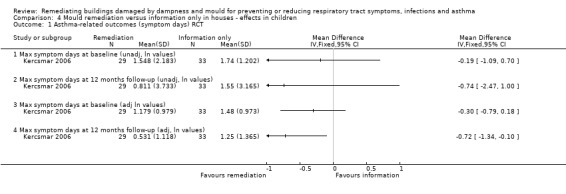
Comparison of the unadjusted ln transformed mean maximal asthma symptom days in the index and control group at baseline revealed no statistically significant differences (mean difference (MD) ‐0.19 (95% CI ‐1.09 to 0.70) at baseline and MD ‐0.74 (95% CI ‐2.47 to 1.00) at 12 months follow‐up) (Kercsmar 2006) (Analysis 4.1).
4.1. Analysis.
Comparison 4 Mould remediation versus information only in houses ‐ effects in children, Outcome 1 Asthma‐related outcomes (symptom days) RCT.
In the analysis adjusted for asthma severity and season of the year, participants in the remediation group reported fewer ln transformed symptom days at the last follow‐up compared to those in the control group (MD ‐0.72; 95% CI ‐1.34 to ‐0.10) (Analysis 4.1). However, this could still be due to baseline differences.
In a mixed model adjusted for baseline asthma severity and season of the year, the authors report that there was no significant difference in change from baseline between the intervention and the control group in the ln transformed mean asthma symptom days.
The number of study participants with one or more acute care visits decreased especially during the last part of the post‐remediation period (six to 12 months after remediation) when compared to the group that received information only, but in the as randomised comparison this difference was not statistically significant. When the whole follow‐up period was taken into account, there was no difference between the intervention and control group.
For the comparison of extensive remediation versus information only, we conclude that there is moderate‐quality evidence that the number of asthma symptom days in asthmatic children did not decrease significantly after remediation compared to the control group that received only cleaning information. However, the number of acute care visits decreased in the intervention group.
5. Mould remediation versus no exposure in schools ‐ effects on children
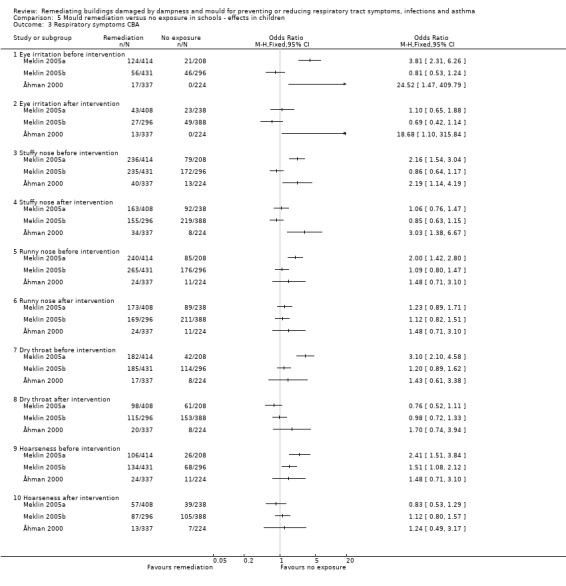
These results should be interpreted with caution, because most of the results were inconsistent. One study did not find differences in the prevalence of most reported respiratory symptoms between the intervention group and the control group either in the beginning or after the remediation of the school (Åhman 2000). The results of Meklin 2005b are mostly in line with those of Åhman 2000, while Meklin 2005a reports a significantly higher prevalence of symptoms before remediation than after remediation.
5.1 Asthma‐related outcomes or asthma‐related symptoms in CBA studies
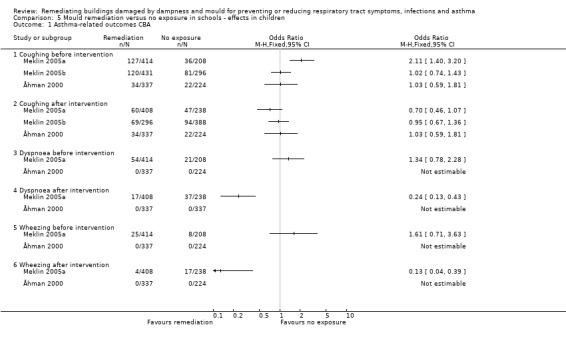
Even though asthma‐related symptoms seem to decrease after remediation in CBA studies compared to no exposure, the 95% CI indicated that there is still considerable uncertainty about this effect. The prevalence of coughing in the index and control group was the same at baseline and after remediation, and the difference between the intervention and control groups was not significant (OR 1.03; 95% CI 0.59 to 1.81) (Åhman 2000) (Analysis 5.1).
5.1. Analysis.
Comparison 5 Mould remediation versus no exposure in schools ‐ effects in children, Outcome 1 Asthma‐related outcomes CBA.
In Meklin 2005a, coughing was more common in the index group than in the non‐exposed group before the remediation (OR 2.11; 95% CI 1.40 to 3.20). After the complete remediation coughing was reported less in the index school than in the control school, the difference being almost statistically significant (OR 0.70; 95% CI 0.46 to 1.07). When the school was repaired partially, there was no difference in coughing either before or after remediation between the index school and the control school (OR 1.02; 95% CI 0.74 to1.43 and OR 0.95; 95% CI 0.67 to 1.36, respectively) (Meklin 2005b) (Analysis 5.1).
In Åhman 2000, none of the participants reported dyspnoea or wheezing before or after the remediation of the school building. In the full‐repair group in Meklin 2005a, as reported by Lignell 2007, the prevalence of dyspnoea and wheezing was not statistically different from the reference school before the intervention. Due to an increase in symptoms in the reference school and a decrease in the full‐repair school, both dyspnoea (RR 0.24 95% CI 0.13 to 0.43) and wheezing (RR 0.13 95% CI 0.04 to 0.39) were significantly lower in the repaired school after the intervention.
5.2 Respiratory infections in CBA studies
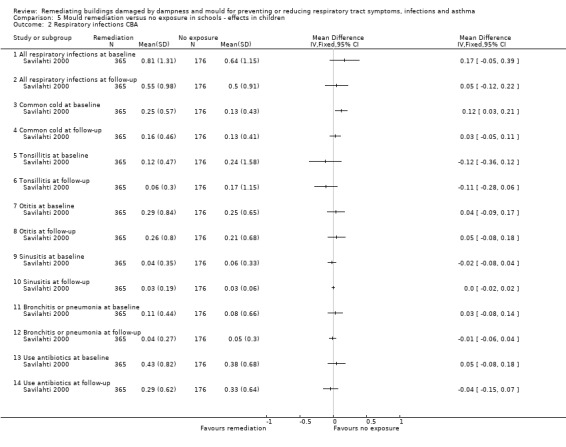
Visits to a physician due to a common cold were more frequent among the pupils of the mould‐damaged school before remediation than among those of a healthy school (MD 0.12; 95% CI 0.03 to 0.21), but after thorough reparations the difference was no longer significant (MD 0.03; 95% CI ‐0.05 to 0.11) (Savilahti 2000) (Analysis 5.2). The differences in the number of visits to a physician due to all respiratory infections between the index and control group were not significant at baseline or after remediation (MD 0.17; 95% CI ‐0.05 to 0.39 and MD 0.05; 95% CI ‐0.12 to 0.22). Based on data from patient records, we also found no significant effect of remediation on the number of visits due to tonsillitis, otitis, sinusitis, bronchitis or pneumonia or in the use of antibiotics. Based on the results of the questionnaires, the authors report a decrease in the incidence of respiratory symptoms, common colds and bronchitis in the renovated school when compared to the control school. These data were based on questionnaire results that we were not able to use.
5.2. Analysis.
Comparison 5 Mould remediation versus no exposure in schools ‐ effects in children, Outcome 2 Respiratory infections CBA.
5.3 Respiratory symptoms in CBA studies
For the comparison of remediation versus no exposure we found inconsistent results for the effects of remediation on respiratory symptoms in the intervention group compared to those in a healthy school before and after remediation (Åhman 2000; Meklin 2005a; Meklin 2005b) (Analysis 5.3).
5.3. Analysis.
Comparison 5 Mould remediation versus no exposure in schools ‐ effects in children, Outcome 3 Respiratory symptoms CBA.
The prevalence of eye irritation symptoms was higher in the index school than in the control school both before and after remediation in Åhman 2000 (OR 24.52; 95% CI 1.47 to 409.79 and OR 18.68; 95% CI 1.10 to 315.84). Using multiple logistic regression analysis of the symptoms, with adjustment for a recent common cold, atopy and "unrest in class", Åhman 2000 reported that a significantly elevated prevalence odds ratio for eye irritation decreased after remediation. In Meklin 2005a, eye symptoms were reported more often in the index school than in the control school before remediation (OR 3.81; 95% CI 2.31 to 6.26). After intervention, there was no difference between the index and control school (OR 1.10; 95% CI 0.65 to 1.88). In the study where the school was only partially repaired there was no difference between the intervention group and the control group either before or after remediation (OR 0.81; 95% CI 0.53 to 1.24 and OR 0.69; 95% CI 0.42 to 1.14, respectively) (Meklin 2005b).
In Åhman 2000, the prevalence of a stuffy nose among the pupils in the index school was higher than in the control school before remediation (OR 2.19; 95% CI 1.14 to 4.19). After remediation, the figures remained similar (OR 3.03; 95% CI 1.38 to 6.67) (Åhman 2000). In Meklin 2005a, stuffy nose was reported more often in the index school than in the control school before remediation (OR 2.16; 95% CI 1.54 to 3.04). After intervention, there was no difference between the index and control school (OR 1.06; 95% CI 0.76 to 1.47). In the study where the school was only partially repaired there was no difference between the intervention group and the control group either before or after remediation (OR 0.86; 95% CI 0.64 to1.17 and OR 0.85; 95% CI 0.63 to 1.15, respectively) (Meklin 2005b).
The intervention did not affect the occurrence of a runny nose: the OR for a runny nose was the same at both baseline and follow‐up (OR 1.48; 95% CI 0.71 to 3.10) in Åhman 2000. In another study runny nose was more common before complete remediation (OR 2.00; 95% CI 1.42 to 2.80), and the differences disappeared after the intervention when the remediation was complete (OR 1.23; 95% CI 0.89 to 1.71) (Meklin 2005a). When the school was only partially repaired, there was no difference between the intervention group and the control group either before or after remediation (OR 1.09; 95% CI 0.80 to 1.47 and OR 1.09; 95% CI 0.80 to 1.47, respectively) (Meklin 2005b).
The differences in the prevalence of dry throat between the index and control group were not significant at baseline or after remediation (OR 1.43; 95% CI 0.61 to 3.38) in Åhman 2000. In Meklin 2005a, dry throat was reported more often in the index school than in the control school before remediation (OR 3.10; 95% CI 2.10 to 4.58). After intervention, there was no difference between the index and control school (OR 0.76; 95% CI 0.52 to 1.11). In the study where the school was only partially repaired there was no difference between the intervention group and the control group either before or after remediation (OR 1.20; 95% CI 0.89 to 1.62 and OR 0.98; 95% CI 0.72 to 1.33, respectively) (Meklin 2005b).
The differences in the prevalence of hoarseness between the index and control group were not significant at baseline or after remediation (OR 1.48; 95% CI 0.71 to 3.10 and 1.24; 95% CI 0.49 to 3.17) in Åhman 2000. However, in another study hoarseness was more common before complete remediation (OR 2.41; 95% CI 1.51 to 3.84), and the differences disappeared after the intervention when the remediation was complete (OR 0.83; 95% CI 0.53 to 1.29) (Meklin 2005a). When the school was only partially repaired, there was no difference between the intervention group and the control group either before or after remediation (OR 1.51; 95% CI 1.08 to 2.12 and OR 1.12; 95% CI 0.80 to 1.57, respectively) (Meklin 2005b).
The inconsistency of the results means that we were not able to draw a conclusion about asthma‐related outcomes and respiratory symptoms. Concerning respiratory infections, there was very low‐quality evidence that visits to a physician due to a common cold were more frequent among the pupils of the mould‐damaged school than the healthy school, but after remediation the number of visits due to a common cold remained similar (Savilahti 2000).
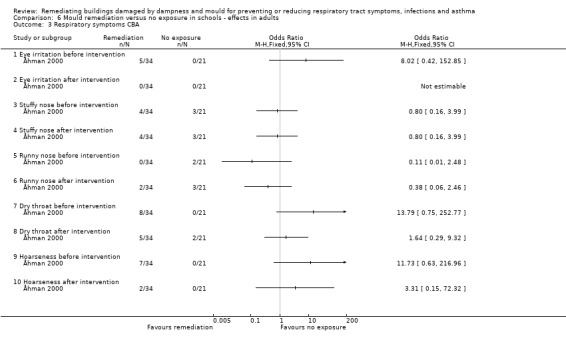
6. Mould remediation versus no exposure in schools ‐ effects on adults
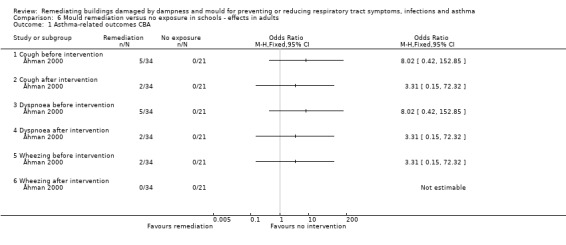
In the controlled before‐after studies of Patovirta 2004a and Åhman 2000, the respiratory health of teachers and other personnel was followed after extensive remediation in the schools. Follow‐up time in Patovirta 2004a was up to three years and in Åhman 2000 seven months.
6.1 Asthma‐related outcomes or asthma‐related symptoms in CBA studies
We found no evidence of an effect of the intervention in the comparison of remediation versus no exposure in adults. In the beginning there was no difference between the symptoms of the index and control group (MD 0.50; 95% CI ‐0.28 to 1.28) (Patovirta 2004a). There was also no significant difference after one or three years (MD 0.12; 95% CI ‐0.69 to 0.93 and 1.31; 95% CI 0.28 to 2.34, respectively). The outcome consisted of a sum of lower respiratory symptoms. These included coughing with phlegm, dyspnoea and wheezing, which can all be defined as asthma‐related symptoms.
In Åhman 2000, coughing was not significantly more common in the exposed group at baseline or after the intervention (OR 8.02; 95% CI 0.42 to 152.85 and OR 3.31; 95% CI 0.15 to 72.32) (Analysis 6.1). At baseline, five of the 34 members of the personnel in the index school reported dyspnoea, while in the control school no one had symptoms of dyspnoea. At follow‐up, two people reported dyspnoea in the index school but in the control group there were no complaints of dyspnoea. The odds ratio for dyspnoea was 8.02 (95% CI 0.42 to 152.85) at baseline, and at the follow‐up it was 3.31 (95% CI 0.15 to 72.32).
6.1. Analysis.
Comparison 6 Mould remediation versus no exposure in schools ‐ effects in adults, Outcome 1 Asthma‐related outcomes CBA.
At baseline two of the 34 members of the personnel in the index school reported wheezing, while in the control school no one suffered from these symptoms. At follow‐up there were no complaints of wheezing in either group. The odds ratio for wheezing was 3.31 (95% CI 0.15 to 72.32) in the beginning and at the follow‐up it was not estimable.
6.2 Respiratory infections in CBA studies
In Patovirta 2004a, the authors report a decreased incidence of self reported tonsillitis, infection of the middle ear, bronchitis, pneumonia and sinusitis in the index group after remediation at one and three‐year follow‐up, but no data for respiratory infections in the control group are shown (Analysis 6.2).
6.2. Analysis.
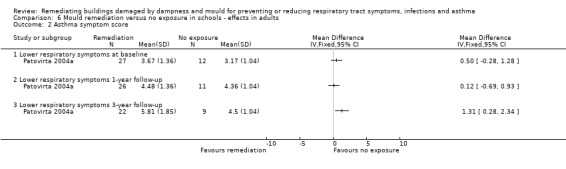
Comparison 6 Mould remediation versus no exposure in schools ‐ effects in adults, Outcome 2 Asthma symptom score.
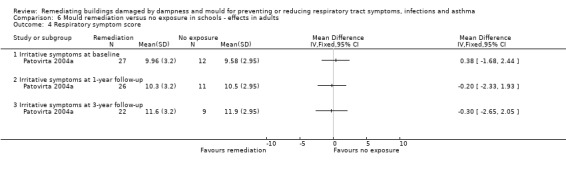
6.3 Respiratory symptoms in CBA studies
In Patovirta 2004a, irritative symptoms meant nasal bleeding, rhinitis, sore throat, hoarseness, coughing and eye irritation. The index group and control group did not differ from each other at baseline (MD 0.38; 95% CI ‐1.68 to 2.44) or after intervention at one and three‐year follow‐up (MD ‐0.20; 95% CI ‐2.33 to 1.93 and ‐0.30; 95% CI ‐2.65 to 2.05, respectively) (Analysis 6.4).
6.4. Analysis.
Comparison 6 Mould remediation versus no exposure in schools ‐ effects in adults, Outcome 4 Respiratory symptom score.
In Åhman 2000, no one reported eye symptoms in the control group at either baseline or follow‐up. There were also no eye symptoms in the index group after remediation (Analysis 6.3). The odds ratio for eye irritation was 8.02; 95% CI 0.42 to 152.85 in the beginning, and at the follow‐up it was not estimable.
6.3. Analysis.
Comparison 6 Mould remediation versus no exposure in schools ‐ effects in adults, Outcome 3 Respiratory symptoms CBA.
At baseline, the index group reported fewer stuffy nose symptoms than the control group, but the difference was not statistically significant (OR 0.80; 95% CI 0.16 to 3.99). The numbers did not change after remediation (OR 0.80; 95% CI 0.16 to 3.99) (Åhman 2000).
There were no reports of runny noses in the index group at baseline, but they increased after remediation. The odds ratio for a runny nose at baseline was 0.11 (95% CI 0.01 to 2.48) and 0.38 (95% CI 0.06 to 2.46) at follow‐up (Åhman 2000).
At baseline there were no complaints of dry throat in the control group. The odds ratio for dry throat in the mould‐damaged school when compared to a healthy school was 13.79 (95% CI 0.75 to 252.77) at the beginning and 1.64 (95% CI 0.29 to 9.32) after remediation (Åhman 2000).
Hoarseness was not significantly more common in the index group at baseline (OR 11.73; 95% CI 0.63 to 216.96) or after intervention (OR 3.31; 95% CI 0.15 to 72.32) (Åhman 2000).
Concerning remediation of mould in schools, we conclude that there is very low‐quality evidence that asthma‐related symptoms and other respiratory symptoms in adults working in a mould‐damaged school are similar to those working in a non‐damaged school, either before or after remediation of the building.
Economic outcomes
One study also included an economic evaluation in its report and concluded that a modest investment (GBP 700 excluding taxes) led to significant improvements in self reported health and a lower risk of children being absent from school or adults taking sick days (Howden‐Chapman 2007). A conservative cost‐benefit analysis of the intervention indicated that the tangible health and energy benefits outweighed the costs by a factor approaching two. Kercsmar 2006 also reports the costs of the intervention per household (USD 3458 ± 2795) but presents no cost‐benefit analysis. Shortt 2007 reports a significant fall in household fuel costs, from GBP 1113 per annum to GBP 751.56 (P value < 0.001) on average.
Discussion
Summary of main results
We found moderate‐quality evidence that remediation of mould in houses decreases asthma‐related symptoms and decreases respiratory infections, compared to no intervention. There was very low‐quality evidence that asthma‐related symptoms and other respiratory symptoms in school personnel in mould‐damaged schools are similar to those of personnel in non‐damaged schools either before or after profound remediation of moisture damage, but there is still considerable uncertainty about the size of this effect. The corresponding results of pupils' symptoms were inconsistent. However, we found very low‐quality evidence that visits to a physician due to a common cold among school children decreased after remediation, when compared to a healthy school.
Overall completeness and applicability of evidence
All the included studies are pragmatic trials that focus on showing that the remediation of mould and moisture damage in buildings decreases symptoms. The effect of mould remediation on health is difficult to study and this may explain why we found only few studies. All the interventions in the studies are used in current practice. There is a wide variation in the thoroughness of mould remediation, varying from complete rebuilding to improving heating and ventilation. In one trial partial remediation was compared to complete remediation of two schools (Meklin 2005a; Meklin 2005b). However, the pupils were older in the partially repaired school. All studies focused on respiratory symptoms, which is the main health effect implicated in mould infestation of buildings. Mould infestation is a problem in ordinary houses, apartment buildings, office buildings and schools, affecting both adults and children. All these types of buildings and participants were represented in the included studies.
We found four studies in which the authors had used an equivalence design, meaning that they tried to show that the symptoms after remediation decrease to a level similar to that of individuals in non‐damaged buildings. However, in most of these studies there was no difference between the symptoms of the index and control groups at baseline and thus no improvement could be seen after the remediation of moisture damage. A limited exposure time may explain the lack of an effect in the school studies. It is possible that the youngest pupils spend only a couple of hours per day at school and this may not be long enough to cause respiratory symptoms. It is also possible that the missing effects in children reflect inaccurate observation by parental respondents. In Savilahti, the patient records of the local health centre were also reviewed and a decrease in the number of visits due to a common cold was seen.
Quality of the evidence
Double‐blinding and placebo controls are difficult to include in the designs of studies on the effects of moisture remediation in damaged buildings. Nevertheless, single‐blinding was used in one study (Howden‐Chapman 2007). In the school studies, researchers have tried to overcome the problems of using a control group by comparing remediation to a group that was not exposed at all, which could be called an equivalence study. However, this introduces other possibilities of bias because moisture damage is usually obvious and well known and most studies use self reported respiratory symptoms. Before the intervention, there could be an over‐reporting of symptoms due to the attention given to the problem and after the intervention there could be a Hawthorne effect with a decreased reporting of respiratory symptoms. This would artificially increase the effect of the intervention. There is evidence of such effects in the school studies reported by Meklin 2005a.
The contents of interventions were very heterogeneous, which makes the generalisation of the results difficult. Also, the baseline situation, the degree of damage in the structures, should be reported. If there is large damage inside the walls, ceilings or floors, cleaning only the surfaces is not a proper method to repair the building and effects on residents' health may be modest. It is common that a mould problem can be found in the air‐conditioning system, but only two studies reported thorough cleaning of ventilation ducts (Meklin 2005a; Meklin 2005b).
Follow‐up time varied from seven months to five years. In practice it has been noticed that respiratory symptoms may continue for some months, half a year, or even years after the remediation of dampness and mould damages has been completed (Rudblad 2002). The longest follow‐up time, five years, was in a school study (Meklin 2005b). A problem in school studies is the change of the population: as the pupils grow older they will move to higher grades or leave the school. After five years the pupils answering the follow‐up survey may not be the same as those who answered the initial survey.
In studies with a no intervention control group, a placebo effect cannot be ruled out. However, some studies had objective outcomes that may be more reliable than the results of questionnaires. Kercsmar 2006 reports that pulmonary function data were only available for a limited number of study participants and does not present the data in her article. However, she reports that no significant improvement was seen in lung function measurements. Patovirta 2004a reports spirometry results at the end of mould removal but does not provide any data for these measures before intervention. Two studies found a decreased need for visits to physicians based on patient records (Howden‐Chapman 2007; Savilahti 2000), and there was also a trend toward fewer hospital admissions for respiratory conditions.
The baseline and post‐intervention evaluations were either performed by trained specialists, through microbiological analyses, or were based on participants' own reports. However, microbiological assessments from indoor air or materials are prone to many kinds of bias. Quantitative evaluation of the degree of moisture damage by observation is difficult and subjective. What makes the research on health effects of moulds challenging is that the specific agents causing respiratory symptoms in mould‐damaged buildings are still not known.
Respiratory symptoms were surveyed using various questionnaires. Jarvis 2001 used the questionnaire of the American Thoracic Society supplemented by some additional questions. The instrument in Kercsmar 2006 was the Children's Health Survey for Asthma. Only two studies used the same questionnaire (Örebro MM40) (Åhman 2000; Patovirta 2004a). Those used in other studies were not standardised. The prevalence of symptoms was difficult to compare because of different wording and definitions in the questionnaires. The terms may mean different things for different respondents; for example, for some, rhinitis may mean a viral disease, whereas others may consider it an allergic disease. In fact, these diseases may also be confused clinically. In addition, it has been shown that parental reporting of symptoms is increased by awareness of dampness or mould (Strachan 1988), and that psychosocial factors influence the reporting of symptoms on the MM40 (Lahtinen 2004).
We considered adjustment for confounding factors inadequate in most studies. In three studies, the characteristics of the participants in the intervention and control groups were not reported at all. This is very unfortunate, as there may be many biases that affect the results. For example, it has been shown that women report more subjective symptoms than men. The age, prevalence of atopy and number of smokers should also be reported in order to be able to compare the index and control groups.
Potential biases in the review process
We did not exclude studies because of language restrictions and we had easy access to the Finnish literature from which we found some additional references.
In order to be realistic and avoid missing valuable evidence we also included non‐randomised studies. The inclusion of non‐randomised studies with an equivalent design posed a particular challenge because the results are difficult to interpret. The studies were not of high quality and data were missing, without proper imputation. Most of these studies had non‐significant findings. We believe that this is a realistic interpretation of the evidence in spite of our assumptions and imputations.
Some original studies used more sophisticated analyses than those implemented in RevMan 2014. We could not import the results of the Savilahti 2000 questionnaire studies because they used a repeated measures analysis. They report a significantly higher risk of common cold and bronchitis in a mould‐damaged school when compared to a healthy school before remediation. After remediation, the difference was no longer significant. An improvement was seen for all respiratory diseases, except otitis media. Our interpretation of their results may have been too conservative.
The Åhman 2000 study presents the results in diagrams, from which we extracted the data to the RevMan data tables. Although our manual measurements from the diagrams may not have been sufficiently precise, the order of magnitude should be correct.
We chose to include a wide range of respiratory symptoms because effects are reported for all these symptoms. However, this creates the challenge of how to combine the results of studies that have various outcomes. We tried to overcome this by grouping the symptoms into categories that made some clinical sense, and this might have created an overly optimistic view of the results.
Agreements and disagreements with other studies or reviews
Four reviews have been published on the association of moulds with health effects (Bornehag 2001; Bornehag 2004; IoM 2004a; WHO 2009). The first one concludes: "Even if the mechanisms (of the effects of dampness on health) are unknown, there is sufficient evidence to take preventive measures against dampness in buildings". The second one underlines the importance of finding out and remediating the reasons for the humidity problem. The two other reviews are in line with these. One other review summarized the effectiveness of remediation of damaged houses from the perspective of respiratory health (Krieger 2010). The reviewers did not follow systematic methods and found only three controlled studies on remediation of houses, whereas this review included 12 studies.
Iossifova 2010 and Iossifova 2011 describe a follow‐up of the occupants of a water‐damaged 20‐story office building. No overall improvement in respiratory health was observed during 2002 to 2005. Based on these results the authors recommend relocation of the occupants during dampness remediation to prevent building‐related respiratory cases.
Four studies in this review aimed to improve poor housing conditions by installing a heating system (Shortt 2007), insulation (Howden‐Chapman 2007), removing mould (Burr 2007), or some other solution (Kercsmar 2006). One systematic review on the health effects of housing improvement has previously been published (Thomson 2001). It concluded that many studies showed health gains after the intervention, but the small study populations and the lack of controlling for confounders limited the generalisability of these findings. This also holds true for some non‐randomised studies in our review but three housing improvement studies were randomised controlled trial (RCT) or cluster‐RCT (cRCT) studies, which is the best design for controlling confounding factors.
We found several before‐after studies without a control group dealing with respiratory health and moisture remediation of the buildings. These were not included in this review but we summarised some of their relevant results.
Haverinen‐Shaughnessy 2008 reports seven case studies of buildings that underwent different degrees of moisture and mould damage remediation. They also report the health effects. The results show that successful remediation is difficult to perform. Only in one of the seven cases was remediation completely successful. Unfortunately, the response rate in this case was too low to be able to draw conclusions about changes in the health complaints. The authors conclude that although remediation had been partially successful, even though problems in other parts of the building remained, partial improvement in symptoms was detected in half of the cases and in half no improvement was observed at all.
Immonen 2002 studied four schools: one moisture‐damaged that had been recently renovated, one healthy school building and two schools in which moisture damage was observed but not renovated. This study was not included in the review, because there were no measurements of symptoms before the remediation. However, the study compared the prevalence of respiratory symptoms in 'damaged', 'non‐damaged' and 'renovated' school buildings. No changes could be observed in the prevalence of respiratory symptoms of children between these schools during a three‐year follow‐up. However, the authors point out that although the median concentration of total viable moulds decreased after repairs, there were still occasional spores of moisture‐indicative moulds. As a whole, the fungal concentrations in the indoor air of the damaged schools were low ‐ lower than in homes with moisture problems (Meklin 2002). This may explain the lack of differences between schools not only in Meklin 2002, but also in the school studies included in this review.
Positive effects of housing improvements to eliminate dampness and mould have been reported in non‐controlled studies. For example, a decrease in respiratory infections after mould remediation in four patients was reported by Lloyd 2008. The article describes two cases of children and a teenager who became medication and asthma‐free after remediation. One person with bouts of severe bronchitis was cured and one person's sinusitis problems ended. After remediation, a three‐year follow‐up study of pupils exposed to moulds in the school showed a decreased need for antibiotics (first and second follow‐up), less coughing with phlegm (second follow‐up), nocturnal coughing (first follow‐up) and asthma (second follow‐up) (Haverinen‐Shaughnessy 2004).
Krieger 2010 reviewed the literature on the control of asthma‐related indoor biological agents, one of them being mould. They located only three of the 12 studies that we included plus two additional case studies that did not fulfil our inclusion criteria. The authors conclude that the evidence in these studies, even though very limited, shows beneficial effects.
Authors' conclusions
Implications for practice.
Moderate‐quality evidence exists that the remediation of mould‐damaged houses decreases asthma‐related symptoms, the use of asthma medication in asthma patients and respiratory infections. There is also moderate‐quality evidence that remediation does not significantly decrease the number of symptom days or the number of acute care visits and hospitalisations in asthmatic children. We found very low‐quality evidence that after repairing a mould‐damaged office building asthma‐related and other respiratory symptoms decreased. There is very low‐quality evidence that profound remediation of moisture‐damaged schools does not decrease the respiratory symptoms of the school personnel.The effects on pupils' respiratory health are inconsistent. This may be explained by the fact that the occurrence of respiratory symptoms in the intervention and control groups did not differ from each other at baseline. Also, negative findings can be explained by the fact that bronchial asthma is a chronic disease and not quickly reversible or at all reversible, if the disease has become severe. In favour of the effectiveness of the remediation of mould damage is the finding that visits of children to a physician due to a common cold are less frequent in a mould‐damaged school after remediation.
Implications for research.
Better quality, prospective, controlled and preferably randomised studies are needed to find the most effective way to carry out remediation of damp and mould‐damaged buildings to minimise respiratory health hazards. For effects on respiratory health, we recommend the development and use of validated questionnaires on respiratory symptoms and infections and also studies with objective outcomes, such as spirometry with bronchodilation testing, hyper‐responsiveness or inflammation markers of the airways. Rather large sample sizes are needed to detect statistically significant differences between groups, especially when the occurrence of symptoms in a study population is low. Asthma is often a chronic disease and the reversibility of the respiratory symptoms is not clear, therefore it would be advisable to study the incidence of symptoms and asthma in incoming participants in mould‐damaged and healthy school buildings instead of changes in the prevalence.
What's new
| Date | Event | Description |
|---|---|---|
| 17 November 2014 | New citation required but conclusions have not changed | Our conclusions remain unchanged. During the final copy editing process, several typographical eroors were detected in the search strategy. We did not correct them, but the searches are being rerun to see if it changes the results. |
| 17 November 2014 | New search has been performed | Searches updated. We included four new trials (Åhman 2000; Eick 2011; Hoppe 2012; Meklin 2005a; Meklin 2005b) and excluded 13 new trials (Bailey 2009; Beck 2013; Butterfield 2010; Dhar 2012; Dotterud 2012; Fabian 2014; Garland 2013; Iossifova 2011; Norback 2011; O'Sullivan 2012; Reynolds 2012; Turyk 2013; Zhang 2012). |
Acknowledgements
We thank the Cochrane Occupational Safety and Health review group for its support. The review authors wish to thank the following people for commenting on the draft protocol: Clare Jeffrey, Chris Cates, Andrew Hope, Nelcy Rodriguez and Nick Matheson.
Appendices
Appendix 1. MEDLINE search strategy
1.1 PubMed search strategy 12 March 2009 (searched from 1951 to March 2009)
“Respiratory Tract Diseases”[MeSH] OR "Respiratory Tract Infections"[MeSH] OR [respiratory[tw] AND (infection[tw] OR disease[tw] OR symptom[tw])] or [respiratory[tw] AND (infections[tw] OR diseases[tw] OR symptoms[tw])] OR "Sick Building Syndrome"[MeSH] OR "Sick Building Syndrome"[tw] OR "Otitis Media"[MeSH] OR "Common Cold"[MeSH] OR "Influenza, Human"[MeSH] OR "Asthma"[MeSH] OR "Rhinitis"[MeSH] OR "Sinusitis"[MeSH] OR "Cough"[MeSH] OR "Conjunctivitis"[MeSH] OR "Eye Diseases/microbiology"[MeSH] OR "otitis media"[tw] OR wheez*[tw] OR "common cold"[tw] OR influenz*[tw] OR asthma*[tw] OR rhinit*[tw] OR sinusit*[tw] OR conjunctivit*[tw] OR "eye symptom"[tw] OR "eye symptoms"[tw] OR cough*[tw]
AND
"Humidity"[MeSH] OR "Fungi"[MeSH] OR "Water"[MeSH] OR "Air Microbiology"[MeSH] OR "Air Pollution, Indoor"[MeSH] OR damp*[tw] OR moistur*[tw] OR humid*[tw] OR mould*[tw] OR mold'[tw] OR condensation*[tw] OR fungal*[tw] OR fungi*[tw] OR "water vapour"[tw] OR "water vapours"[tw] OR "water vapor"[tw] OR "water vapors"[tw] OR spore*[tw] OR micro‐organism*[tw] OR microorganism*[tw]
AND
repair*[tw] OR renoval*[tw] OR remediat*[tw] OR rebuild*[tw] OR reconstruct*[tw] OR drain*[tw] OR remov*[tw] OR reparat*[tw] OR reduce*[tw] OR reduci*[tw] OR reduct* OR dehumidificat*[tw] OR refurbis*[tw] OR recapsul*[tw] OR decontaminat*[tw] OR dry[tw] OR drying[tw] OR drain[tw]
AND
(effect* [tw] OR control* [tw] OR evaluation* [tw] OR program* [tw]) AND (work[tw] OR works*[tw] OR work'*[tw] OR worka*[tw] OR worke*[tw] OR workg*[tw] OR worki*[tw] OR workl*[tw] OR workp*[tw] OR occupation* [tw] OR prevention* [tw] OR protect* [tw] ) OR [(randomized controlled trial[pt] OR controlled clinical trial[pt] OR randomized controlled trials[MeSH] OR random allocation[MeSH] OR double‐blind method[MeSH] OR single‐blind method[MeSH] OR clinical trial[pt] OR clinical trials[MeSH] OR clinical trial[tw] OR ((singl*[tw] OR doubl*[tw] OR trebl*[tw] OR tripl*[tw]) AND (mask*[tw] OR blind*[tw])) OR latin square[tw] OR placebos[MeSH] OR placebo*[tw] OR random*[tw] OR research design[MeSH:noexp] OR comparative study[pt] OR evaluation studies OR follow‐up studies[MeSH] OR prospective studies[MeSH] OR cross‐over studies[MeSH] OR controll*[tw] OR prospectiv*[tw] OR volunteer*[tw]) NOT (animal[MeSH] NOT human[MeSH])]
1.2 MEDLINE search strategy (searched from January 2009 to week 1 June 2011)
1 exp Respiratory Tract Diseases/ (916682) 2 exp Respiratory Tract Infections/ (254193) 3 (respiratory adj3 (infection* or disease* or symptom*)).tw. (55505) 4 Sick Building Syndrome/ (506) 5 sick building syndrome.tw. (402) 6 exp Otitis Media/ (19648) 7 Common Cold/ (3169) 8 Influenza, Human/ (25979) 9 Asthma/ (92422) 10 exp Rhinitis/ (22580) 11 exp Sinusitis/ (13677) 12 Cough/ (10339) 13 exp Conjunctivitis/ (15085) 14 exp Eye Diseases/mi [Microbiology] (9411) 15 (otitis media or wheez* or common cold* or influenza* or asthma* or rhinit* or sinusit* or cough* or conjunctivit* or eye symptom*).tw. (223775) 16 or/1‐15 (1031347) 17 Humidity/ (10976) 18 exp Fungi/ (260197) 19 Water/ (90607) 20 Air Microbiology/ (5872) 21 Air Pollution, Indoor/ (7560) 22 (damp* or moistur* or humid* or mould* or mold* or condensation* or fungal* or fungi* or water vapour* or water vapor* or micro?organism* or spore*).tw. (206107) 23 or/17‐22 (503666) 24 (repair* or renovat* or remediat* or rebuild* or reconstruct* or drain* or remov* or reparat* or reduc* or dehumidificat* or refurbis* or recapsul* or decontaminat* or dry or drying or drain*).tw. (2344067) 25 16 and 23 and 24 (3983) 26 randomized controlled trial.pt. (307057) 27 controlled clinical trial.pt. (83492) 28 randomized.ab. (211386) 29 placebo.ab. (124882) 30 clinical trials as topic.sh. (153231) 31 randomly.ab. (154072) 32 trial.ti. (91538) 33 26 or 27 or 28 or 29 or 30 or 31 or 32 (710393) 34 exp animals/ not humans.sh. (3604852) 35 33 not 34 (656888) 36 25 and 35 (389) 37 limit 36 to ed=20090101‐20101128 (32)
1.3 MEDLINE (Ovid) search strategy
Database searched from 1 April 2011 to November week 1, 2014
1 exp Respiratory Tract Diseases/ 2 exp Respiratory Tract Infections/ 3 (respiratory adj3 (infection* or disease* or symptom*)).tw. 4 Sick Building Syndrome/ 5 sick building syndrome.tw. 6 exp Otitis Media/ 7 Common Cold/ 8 Influenza, Human/ 9 Asthma/ 10 exp Rhinitis/ 11 exp Sinusitis/ 12 Cough/ 13 exp Conjunctivitis/ 14 exp Eye Diseases/mi [Microbiology] 15 (otitis or wheez* or common cold* or influenza* or flu or asthma* or rhinit* or sinusit* or cough* or conjunctivit* or sore throat* or nasal congestion* or sneez* or eye symptom* or eye irritat* or runny nose* or bronchit* or tonsillit* or pneumon*).tw. 16 or/1‐15 17 Humidity/ 18 exp Fungi/ 19 Water/ 20 Air Microbiology/ 21 Air Pollution, Indoor/ 22 (damp* or moistur* or (water adj2 (damage* or infiltrat* or intrusion* or leak*)) or water vapour* or water vapor* or humid* or mould* or mold* or condensation* or fungal* or fungi* or micro?organism* or spore*).tw. 23 or/17‐22 24 (repair* or renovat* or remediat* or rebuild* or reconstruct* or retrofit* or insulat* or ventilat* or heat* or air condition* or remov* or reparat* or reduc* or dehumidificat* or refurbis* or recapsul* or decontaminat* or dry or drying or drain*).tw. 25 16 and 23 and 24
Appendix 2. Embase.com search strategy
2.1 EMBASE search strategy (1974 to March 2009)
“respiratoy tract disease”/exp OR “sick building syndrome”/exp OR “otitis media”/exp OR “common cold”/exp OR asthma/exp OR rhinitis/exp OR cough/exp OR sinusitis/exp OR conjunctivitis/exp OR “otitis media” OR wheez* OR “common cold” OR influenza OR asthma OR rhinit* OR conjunctivit* OR “eye symptom*” OR “eye synptoms” OR sinusit*
AND
fungus/exp OR “air microbiology”/exp OR “indoor microbiology”OR “indoor air pollution/exp OR “indoor air pollution”/ OR damp* OR moistur* OR humid* OR mould* OR mold* OR condensation* OR fungal* OR fungi* OR microorganism* OR “micro organisms” OR spore* OR “water vapor”/exp OR “water vapour”/exp
AND
repair* OR renovar* OR remediat* OR rebuild* OR reconstruct* OR drain* OR reparat* OR reduct* OR dehumidificat* OR refurdis* OR recapsul* OR decontaminat* OR dry OR drying OR drain
AND
“controlled clinical trial”/lim OR “randomized controlled trial”/lim OR random* OR crossover* OR assign* OR allocat* OR placebo*OR volunteer* OR cohort* OR control* OR methodology/exp OR prospective* OR volunteer*
AND
humans/lim
2.2 EMBASE search strategy (January 2009 to June 2011)
17 #12 AND #16 16 #13 OR #14 OR #15 15 'methodology'/exp 14 random*:ab,ti OR placebo*:ab,ti OR factorial*:ab,ti OR crossover*:ab,ti OR 'cross‐over':ab,ti OR 'cross over':ab,ti OR volunteer*:ab,ti OR assign*:ab,ti OR allocat*:ab,ti OR ((singl* OR doubl*) NEAR/2 (blind* OR mask*)):ab,ti OR cohort*:ab,ti OR prospectiv*:ab,ti 13 'controlled clinical trial'/exp OR 'single blind procedure'/exp OR 'double blind procedure'/exp OR 'crossover procedure'/exp OR 'cohort analysis'/exp OR 'prospective study'/exp 12 #7 AND #10 AND #11 11 repair*:ab,ti OR renovat*:ab,ti OR remediat*:ab,ti OR rebuild*:ab,ti OR reconstruct*:ab,ti OR remov*:ab,ti OR reparat*:ab,ti OR reduc*:ab,ti OR dehumidificat*:ab,ti OR refurbis*:ab,ti OR recapsul*:ab,ti OR decontaminat*:ab,ti OR dry:ab,ti OR drying*:ab,ti OR drain*:ab,ti 10 #8 OR #9 9 damp*:ab,ti OR mositure*:ab,ti OR humid*:ab,ti OR mould*:ab,ti OR mold*:ab,ti OR condensation*:ab,ti OR fungal*:ab,ti OR fungi*:ab,ti OR 'water vapour':ab,ti OR 'water vapor':ab,ti OR microorganism*:ab,ti OR 'micro‐organism':ab,ti OR 'micro‐organisms':ab,ti OR spore*:ab,ti OR 'air microbiology':ab,ti OR 'indoor microbiology':ab,ti OR 'indoor air pollution':ab,ti 8 'humidity'/exp OR 'fungus'/exp OR 'indoor air pollution'/de OR 'microbiology'/exp 7 #1 OR #2 OR #3 OR #4 OR #5 OR #6 6 'otitis media':ab,ti OR 'common cold':ab,ti OR 'common colds':ab,ti OR rhinit*:ab,ti OR sinusit*:ab,ti OR asthma:ab,ti OR flu:ab,ti OR wheez*:ab,ti OR cough*:ab,ti OR conjunctivit*:ab,ti OR 'eye symptoms':ab,ti OR 'eye symptom':ab,ti OR influenza*:ab,ti 5 'sick building syndrome':ab,ti 4 (respiratory NEAR/3 (infection* OR disease* OR symptom*)):ab,ti 3 'otitis media'/exp OR 'common cold'/de OR 'influenza'/exp OR 'rhinitis'/exp OR 'sinusitis'/exp OR 'asthma'/exp OR 'coughing'/de OR 'irritative coughing'/de OR 'conjunctivitis'/exp OR 'eye disease'/exp 2 'sick building syndrome'/de 1 'respiratory tract disease'/exp OR 'respiratory tract infection'/exp
2.3 EMBASE search strategy (May 2011 to November 2014)
#20 #10 AND #18 AND #19 #19 repair*:ab,ti OR renovat*:ab,ti OR remediat*:ab,ti OR rebuild*:ab,ti OR reconstruct*:ab,ti OR retrofit*:ab,ti OR insulat*:ab,ti OR ventilat*:ab,ti OR heat*:ab,ti OR 'air condition':ab,ti OR 'air conditioning':ab,ti OR remov*:ab,ti OR reparat*:ab,ti OR reduc*:ab,ti OR dehumidifi*:ab,ti OR refurbis*:ab,ti OR recapsul*:ab,ti OR decontaminat*:ab,ti OR dry:ab,ti OR drying:ab,ti OR drain*:ab,ti #18 #11 OR #12 OR #13 OR #14 OR #15 OR #16 OR #17 #17 damp*:ab,ti OR moistur*:ab,ti OR (water NEAR/2 (damage* OR infiltrat* OR intrusion* OR leak*)):ab,ti OR (water NEAR/1 (vapor* OR vapour*)):ab,ti OR humid*:ab,ti OR mould*:ab,ti OR mold*:ab,ti OR condensation*:ab,ti OR fungal*:ab,ti OR fungi*:ab,ti OR fungus*:ab,ti OR 'micro‐organism':ab,ti OR 'micro‐organisms':ab,ti OR microorganism*:ab,ti OR spore*:ab,ti #16 'mycology'/de #15 'indoor air pollution'/de #14 'water'/de #13 'airborne fungus'/de #12 'mould'/exp OR 'fungus'/de #11 'humidity'/de #10 #1 OR #2 OR #3 OR #4 OR #5 OR #6 OR #7 OR #8 OR #9 #9 otitis*:ab,ti OR wheez*:ab,ti OR 'common cold':ab,ti OR 'common colds':ab,ti OR influenza*:ab,ti OR flu:ab,ti OR asthma*:ab,ti OR rhinit*:ab,ti OR sinusit*:ab,ti OR cough*:ab,ti OR conjunctivit*:ab,ti OR 'sore throat':ab,ti OR 'sore throats':ab,ti OR 'nasal congestion':ab,ti OR (eye NEAR/1 (symptom* OR irritat*)):ab,ti OR 'runny nose':ab,ti OR 'runny noses':ab,ti OR bronchit*:ab,ti OR tonsillit*:ab,ti OR pneumon*:ab,ti #8 'asthma'/de #7 'conjunctivitis'/de OR 'allergic conjunctivitis'/de OR 'rhinoconjunctivitis'/de OR 'viral conjunctivitis'/de OR 'eye irritation'/de #6 'common cold'/de OR 'common cold symptom'/de OR 'influenza'/exp OR 'rhinitis'/de OR 'sinusitis'/exp OR 'coughing'/exp OR 'wheezing'/de #5 'otitis media'/exp OR 'otitis'/de #4 'sick building syndrome':ab,ti OR 'sick building syndromes':ab,ti #3 'sick building syndrome'/de #2 (respiratory NEAR/3 (infection* OR symptom* OR disease*)):ab,ti #1 'respiratory tract infection'/exp OR 'respiratory tract inflammation'/exp OR 'upper respiratory tract congestion'/de OR 'respiratory tract disease'/de
Appendix 3. CINAHL (EBSCO) search strategy
3.1 CINAHL search 13 March 2009
respiratory tract disease.mp. OR respiratory tract diseases.mp. OR respiratory tract infection.mp. OR respiratory tract infections.mp. OR (respiratory adj3 (infection$ or disease$ or symptom$)).mp. OR sick building syndrome$.mp. OR otitis media.mp. OR common cold.mp. OR asthma.mp. OR ¬rhinitis.mp.¬ OR¬ sinusitis.mp. ¬OR ¬conjunctivitis.mp. ¬OR¬ cough.mp. OR¬ wheez$.mp. OR eye symptom$.mp. OR eye disease$
AND
humidity.mp. ¬OR¬ fungi.mp.¬ OR water.mp. OR “air microbiology”.mp. OR “indoor air pollution”.mp. OR (damp$ or moistur$ or humid$ or mould or moulds or mold or molds).mp. OR (condensation$ OR fungal$ OR fungi$).mp. OR ("water vapour$" OR "water vapor$").mp. OR (microorganism$ OR micro organism$).mp. OR spore$.mp.
AND
(repair$ OR renovat$ OR remediat$ OR rebuild$ OR reconstruct$).mp. OR¬ (drain$ OR remov$ OR reparat$ OR reduct$ OR dehuminificat$ OR refurbis$ OR recapsul$ OR decontaminat$ OR dry or drying).mp.
AND
clinical trials.mp OR [(ramdom$.mp. OR ¬controll$.mp.)AND ( trial.mp. OR trials.mp.)] OR random allocat$.mp. OR random assign$.mp. ¬OR [(singl* OR doubl* OR trebl* OR tripl*) AND (mask* OR blind*) OR placebo$ OR evaluat$.mp. OR (cross‐over$ OR comparativ$¬ OR volunteer$ OR prospectiv$ ).mp
3.2 CINAHL search strategy (2009 to May 2011)
S41 S26 and S39 S40 S26 and S39 S39 S28 or S29 or S30 or S31 or S32 or S33 or S34 or S35 or S36 or S37 or S38 S38 TI ( cohort stud* or observation* stud* ) or AB ( cohort stud* or bservation* stud* ) S37 (MH "Cross Sectional Studies") S36 (MH "Correlational Studies") S35 (MH "Case Control Studies+") S34 (MH "Prospective Studies+") S33 (MH "Quantitative Studies") S32 TI ( random* or placebo* ) or AB ( random* or placebo* ) S31 TI ( singl* blind* or doubl* blind* or tebl* blind* or tripl* blind* or singl* mask* or doubl* mask* or tripl* mask* or trebl* mask* ) or AB (singl* blind* or doubl* blind* or trebl* blind* or tripl* blind* or singl*mask* or doubl* mask* or tripl* mask* or trebl* mask* ) S30 TI clinic* N2 trial* or AB clinic* N2 trial* S29 PT clinical trial S28 (MH "Clinical Trials+") S27 S18 and S24 and S25 S26 S18 and S24 and S25 S25 TI ( repair* or renovat* or remediat* or rebuild* or reconstruct* or remov* or reparat* or reduc* or dehumidif* or refurbis* or recapsul* or decontaminat* or dry or drying or drain* ) or AB ( repair* or renovat* or remediat* or rebuild* or reconstruct* or remov* or reparat* or reduc* or dehumidif* or refurbis* or recapsul* or decontaminat* or dry or drying or drain* ) S24 S19 or S20 or S21 or S22 or S23 S23 TI ( damp* or moistur* or humid* or mould* or mold* or condensation* or fungal* or fungi* or water vapour* or water vapor* or microorganism* or micro‐organism* or spore* ) or AB ( damp* or moistur* or humid* or mould* or mold* or condensation* or fungal* or fungi* or water vapour* or water vapor* or microorganism* or micro‐organism* or spore* ) S22 (MH "Air Pollution, Indoor") S21 (MH "Air Microbiology") S20 (MH "Fungi+") S19 (MH "Humidity") S18 S1 or S2 or S3 or S4 or S5 or S6 or S7 or S8 or S9 or S10 or S11 or S12 or S13 or S14 or S15 or S16 or S17 S17 TI ( otitis media or common cold* or influenza* or flu or asthma* or rhinit* or sinusit* or cough* or conjunctivit* or eye symptom* ) or AB (otitis media or common cold* or influenza* or flu or asthma* or rhinit* or sinusit* or cough* or conjunctivit* or eye symptom* ) S16 (MH "Eye Diseases+/MI") S15 (MH "Conjunctivitis+") S14 (MH "Cough") S13 (MH "Sinusitis+") S12 (MH "Rhinitis+") S11 (MH "Asthma") S10 (MH "Influenza") OR (MH "Influenza, Human") S9 (MH "Common Cold") S8 (MH "Otitis Media+") S7 TI respiratory N5 symptom* or AB respiratory N5 symptom* S6 TI respiratory N5 disease* or AB respiratory N5 disease* S5 TI respiratory N5 infection* or AB respiratory N5 infection* S4 TI sick building syndrome* or AB sick building syndrome* S3 (MH "Sick Building Syndrome") S2 (MH "Respiratory Tract Infections+") S1 (MH "Respiratory Tract Diseases+")
3.3 CINAHL (EBSCO) search strategy May 2011 to November 2014
S26 S18 and S24 and S25 S25 TI (repair* or renovat* or remediat* or rebuild* or reconstruct* or retrofit* or insulat* or ventilat* or heat* or air condition* or remov* or reparat* or reduc* or dehumidif* or refurbis* or recapsul* or decontaminat* or dry or drying or drain*) or AB (repair* or renovat* or remediat* or rebuild* or reconstruct* or retrofit* or insulat* or ventilat* or heat* or air condition* or remov* or reparat* or reduc* or dehumidif* or refurbis* or recapsul* or decontaminat* or dry or drying or drain*) S24 S19 or S20 or S21 or S22 or S23 S23 TI (damp* or moistur* or (water N2 (damage* or infiltrat* or intrusion* or leak*)) or humid* or mould* or mold* or condensation* or fungal* or fungus* or fungi* or water vapour* or water vapor* or microorganism* or micro‐organism* or spore*) or AB (damp* or moistur* or humid* or mould* or mold* or condensation* or fungal* or fungus* or fungi* or water vapour* or water vapor* or microorganism* or micro‐organism* or spore*) S22 (MH "Air Pollution, Indoor") S21 (MH "Air Microbiology") S20 (MH "Fungi+") S19 (MH "Humidity") S18 S1 or S2 or S3 or S4 or S5 or S6 or S7 or S8 or S9 or S10 or S11 or S12 or S13 or S14 or S15 or S16 or S17 S17 TI (otitis* or wheez* or common cold* or influenza* or flu or asthma* or rhinit* or sinusit* or cough* or sore throat* or nasal congestion* or sneez* or conjunctivit* or eye symptom* or eye irritat* or runny nose* or bronchit* or tonsillit* or pneumon*) or AB (otitis* or wheez* or common cold* or influenza* or flu or asthma* or rhinit* or sinusit* or cough* or sore throat* or nasal congestion* or sneez* or conjunctivit* or eye symptom* or eye irritat* or runny nose* or bronchit* or tonsillit* or pneumon*) S16 (MH "Eye Diseases+/MI") S15 (MH "Conjunctivitis+") S14 (MH "Cough") S13 (MH "Sinusitis+") S12 (MH "Rhinitis+") S11 (MH "Asthma") S10 (MH "Influenza") OR (MH "Influenza, Human") S9 (MH "Common Cold") S8 (MH "Otitis Media+") S7 TI respiratory N5 symptom* or AB respiratory N5 symptom* S6 TI respiratory N5 disease* or AB respiratory N5 disease* S5 TI respiratory N5 infection* or AB respiratory N5 infection* S4 TI sick building syndrome* or AB sick building syndrome* S3 (MH "Sick Building Syndrome") S2 (MH "Respiratory Tract Infections+") S1 (MH "Respiratory Tract Diseases+")
Appendix 4. Web of Science (Thomson Reuters) search strategy
4.1 Science Citation Index search 12 March 2009
TS= "respiratory tract disease*" OR TS="respiratory tract infection*" OR TS=[(respiratory SAME (infection* or disease* or symptom*)] OR TS="sick building symdrome*" OR TS="otitis media*" OR TS="common could" OR TS=asthma OR TS=influenza OR TS=wheez* OR TS=rhinit* OR TS=(sinisit* OR conjunctivit* OR cough) OR TS= "eye symptom*" OR TS=”eye diseases”
AND
TS=humidity OR TS= fungi OR TS=water OR TS= "air microbiology" OR TS="indoor air pollution" OR TS=damp* OR TS= moistur* OR TS=humid* OR TS=mould* OR TS=mold* OR TS=condensation* OR TS=fungal* OR TS=fungi* OR TS="water vapour*"OR TS="water vapor*" OR TS=spore* OR TS=microorganism* OR TS=micro‐organism*¬
AND
TS=repair* OR TS=renoval* OR TS=remediat* OR TS=rebuild* OR TS=reconstruvt* OR TS=drain* OR TS=remov* OR TS=reparat* OR TS=reduce* OR TS=reduci* OR TS=reduct* OR TS=dehumiduficat* OR TS=refurbis* OR TS=recapsul* OR TS=decontaminat* OR TS=dry OR TS=drying
AND
TS=random* OR TS=control* OR TS=trial OR TS=trials OR TS=allocat* OR assign* OR TS= blind*OR TS=clinical* OR TS="latin square" OR TS=placebo* OR TS=comparativ* OR TS=evaluation* OR TS=follow* OR TS=prospectiv* OR TS=”cross‐over” OR TS=volunteer* OR TS=singl* ¬OR TS=doubl* OR TS=tripl*
4.2 Web of Science (2009 to May 2011)
Topic=(respiratory SAME (infection* or disease*) or "sick building syndrome" or "otitis media" or "common cold*" or influenza* or flu or asthma or rhinitis or sinusitis or cough or coughing or conjunctivitis or "eye disease*" or "eye symptom*") AND Topic=(humid* or fungi or fungal or fungus or water or "air microbiology" or "indoor air pollution" or damp* or moistur* or mould* or mold* or condensation* or "water vapour" or "water vapor" or spore* or microorganism* or micro‐organism*) AND Topic=(repair* or renovat* or remediat* or rebuild* or reconstruct* or drain* or remov* or reparat* or reduc* or dehumidif* or refurbis* or recapsul* or decontaminat* or dry or drying)
Refined by: Topic=(random* or control* or trial or trials or allocat* or assign* or blind* or clinical* or "latin square" or placebo* or camparativ* or evaluation* or follow* or prospectiv* or "cross‐over" or volunteer* or singl* or doubl* or tripl*)
4.2 Web of Science (2011 to November 2014)
Topic=(respiratory NEAR/3 (infection* or disease*) or "sick building syndrome" or "otitis media" or "common cold*" or influenza* or flu or asthma or rhinitis or sinusitis or cough or coughing or conjunctivitis or "eye disease*" or "eye symptom*") AND Topic=(humid* or fungi or fungal or fungus or water or "air microbiology" or "indoor air pollution" or damp* or moistur* or mould* or mold* or condensation* or "water vapour" or "water vapor" or spore* or microorganism* or micro‐organism*) AND Topic=(repair* or renovat* or remediat* or rebuild* or reconstruct* or drain* or remov* or reparat* or reduc* or dehumidif* or refurbis* or recapsul* or decontaminat* or dry or drying)
Appendix 5. OSH search strategy
5.1 OSH search 19 March 2009
CCOHS, CISDOC, NIOSHTIC and RILOSH databases
respirator* OR otitis OR asthma OR rhinitis OR sinusitis OR cough OR wheez* OR conjunctivitis AND humidit* OR fungi* OR fungal OR water OR indoor OR damp* OR moistur* OR mould* OR mold OR molds OR condensation* OR spore* AND repair* OR renovat* OR remediat* OR rebuild* OR reconstruct* OR drain* OR remov* OR reparat* OR reduc* OR rehumidificat* OR refurbish* OR recapsul* OR decontaminat* AND random* OR control* OR allocate* OR assign* OR trial OR trials OR singl* OR doubl* OR clinical OR evaluation* OR follow* OR prospective* OR volunteer* OR effect* OR evaluat* OR program* OR prevent*
5.2 OSH search update 23 March 2014
CCOHS, CISDOC, NIOSHTIC and RILOSH databases
respirator* OR otitis OR asthma OR rhinitis OR sinusitis OR cough OR wheez* OR conjunctivitis AND humidit* OR fungi* OR fungal OR water OR indoor OR damp* OR moistur* OR mould* OR mold OR molds OR condensation* OR spore* AND repair* OR renovat* OR remediat* OR rebuild* OR reconstruct* OR drain* OR remov* OR reparat* OR reduc* OR rehumidificat* OR refurbish* OR recapsul* OR decontaminat* AND random* OR control* OR allocate* OR assign* OR trial OR trials OR singl* OR doubl* OR clinical OR evaluation* OR follow* OR prospective* OR volunteer* OR effect* OR evaluat* OR program* OR prevent*
OSH UPDATE Search History (copied directly from the database 8.12.2010)
Databases NIOSHTIC, NIOSHTIC‐2, CISDOC, RILOSH, CCOHS
Step: Hits: Strategy: #1 59226 GW{respirator* OR otitis OR asthma OR rhinitis OR sinusitis OR cough OR wheez* OR conjunctivitis} #2 59244 GW{humidit* OR fungi* OR fungal OR water OR indoor OR damp* OR moistur* OR mould* OR mold OR molds OR condensation* OR spore*} #3 97795 GW{repair* OR renovat* OR remediat* OR rebuild* OR reconstruct* OR drain* OR remov* OR reparat* OR reduc* OR rehumidificat* OR refurbish* OR recapsul* OR decontaminat*} #4 415900 GW{random* OR control* OR allocate* OR assign* OR trial OR trials OR singl* OR doubl* OR clinical OR evaluation* OR follow* OR prospective* OR volunteer* OR effect* OR evaluat* OR program* OR prevent*} #5 1849 #1 AND #2 AND #3 AND #4 #6 493271 DC{OUNIOC OR OUNIOS OR OURILO OR OUCISD OR OUCCOHS} #7 1167 #5 AND #6 #8 14662 PY{2009 OR 2010} #9 34 #7 AND #8
Appendix 6. BIOSIS search strategy
BIOSIS search history 13 March 2009 (OVID)
respiratory tract disease.mp. OR respiratory tract diseases.mp. OR respiratory tract infection.mp. OR respiratory tract infections.mp. OR (respiratory adj3 (infection$ or disease$ or symptom$)).mp. OR sick building syndrome.mp. OR otitis media.mp. OR common cold.mp. OR asthma.mp. OR rhinitis.mp. OR sinusitis.mp. OR conjunctivitis.mp. OR cough.mp. or wheez$.mp. OR "eye symptom$".mp. AND humidity.mp. OR fungi.mp. OR water.mp. OR “air microbiology”.mp. OR “indoor air pollution”.mp. OR (damp$ or moistur$ or humid$ or mould or moulds or mold or molds).mp. OR (condensation$ OR fungal$ OR fungi$).mp. OR ("water vapour$" OR "water vapor$").mp. OR (microorganism$ OR micro‐organism$).mp. OR spore$.mp. AND (repair$ OR renovat$ OR remediat$ OR rebuild$ OR reconstruct$).mp. OR (drain$ OR remov$ OR reparat$ OR reduct OR dehuminificat$ OR refurbis$ OR recapsul$ OR decontaminat$ OR dry OR drying).mp. AND (ramdom$ OR controll$ OR trial OR trials OR clinical).mp. OR (allocat$ OR assign$ OR singl$ OR doubl$ OR evaluat$).mp. OR (cross‐over$ OR comparativ$ OR volunteer$ OR prospectiv$).mp. AND limit to human AND limit to article or “review articles”
Appendix 7. Cochrane Library databases search strategy
Cochrane Library databases search March 2009 (Wiley InterScience)
Respiratory Tract Diseases/exp OR (respiratory and (infection* or disease* or symptom*)) OR “Sick building Syndrome”/exp OR “sick building syndrome” OR “Otitis Media”/exp OR “common Cold”/exp OR “Influenza, Human”/exp OR Asthma/exp OR Sinusitis/exp OR Conjunctivitis/exp OR (“Eye Diseases”exp wirh MI/qualifier) OR Cough/exp OR “otitis media” OR wheez* OR “common cold” OR influenz* OR asthma* OR rhinit* OR sinusit* OR conjunctivit* OR “eye symptom” OR cough AND Fungi/exp OR Humidity/exp OR “Air Microbiology”/exp¬ OR “Air Pollution, Indoor/exp OR damp* OR moistur* OR humid* OR mould* OR mold* OR condensation* OR fungal* OR fungi* OR “water vapor” OR “water vapors” OR micro‐organism* OR microorganism* OR spore* AND repair* OR renovat* OR remediat* OR rebuild* OR reconstruct* OR drain* OR remov* OR reparat* OR reduct* OR rehumidificat* OR refurbis* OR recapsul* OR decontaminat* OR dry OR drying
Appendix 8. Glossary
Vapour‐air retarder: a device to diminish water content of the indoor air.
Preventer: asthma medicine to prevent asthma attacks, generally inhaled corticosteroids.
Sisalated paper: paper that contains sisal fibres.
Data and analyses
Comparison 1. Mould remediation versus no intervention in houses ‐ effects in adults.
| Outcome or subgroup title | No. of studies | No. of participants | Statistical method | Effect size |
|---|---|---|---|---|
| 1 Asthma‐related outcomes RCT | 2 | Odds Ratio (M‐H, Fixed, 95% CI) | Subtotals only | |
| 1.1 Wheezing in last 4 weeks at 6 months | 1 | 128 | Odds Ratio (M‐H, Fixed, 95% CI) | 0.45 [0.17, 1.19] |
| 1.2 Wheezing in last 4 weeks at 12 months | 2 | 2945 | Odds Ratio (M‐H, Fixed, 95% CI) | 0.64 [0.55, 0.75] |
| 1.3 Medication in last 6 months at 6 months | 1 | 125 | Odds Ratio (M‐H, Fixed, 95% CI) | 0.11 [0.04, 0.28] |
| 1.4 Medication in last 6 months at 12 months | 1 | 168 | Odds Ratio (M‐H, Fixed, 95% CI) | 0.98 [0.53, 1.84] |
| 1.5 Breathing worse or similar at 6 months | 1 | 125 | Odds Ratio (M‐H, Fixed, 95% CI) | 0.19 [0.08, 0.42] |
| 1.6 Wheezing affects activities at 6 months | 1 | 128 | Odds Ratio (M‐H, Fixed, 95% CI) | 0.48 [0.23, 1.03] |
| 1.7 Wheezing affects activities at 12 months | 1 | 171 | Odds Ratio (M‐H, Fixed, 95% CI) | 0.88 [0.48, 1.64] |
| 1.8 Breathing worse or similar at 12 months | 1 | 162 | Odds Ratio (M‐H, Fixed, 95% CI) | 0.33 [0.17, 0.63] |
| 1.9 Use of preventer in last 4 weeks at 6 months | 1 | 128 | Odds Ratio (M‐H, Fixed, 95% CI) | 0.30 [0.11, 0.81] |
| 1.10 Use of preventer in last 4 weeks at 12 months | 1 | 171 | Odds Ratio (M‐H, Fixed, 95% CI) | 0.22 [0.08, 0.57] |
| 1.11 Use of reliever in last 4 weeks at 6 months | 1 | 128 | Odds Ratio (M‐H, Fixed, 95% CI) | 0.86 [0.32, 2.34] |
| 1.12 Use of reliever in last 4 weeks at 12 months | 1 | 171 | Odds Ratio (M‐H, Fixed, 95% CI) | 0.33 [0.14, 0.75] |
| 1.13 Morning phlegm worse or similar | 1 | 1926 | Odds Ratio (M‐H, Fixed, 95% CI) | 0.65 [0.53, 0.78] |
| 1.14 Sleep disturbed by wheezing (worse or similar) | 1 | 983 | Odds Ratio (M‐H, Fixed, 95% CI) | 0.65 [0.50, 0.85] |
| 1.15 Speech disturbed by wheezing (worse or similar) | 1 | 975 | Odds Ratio (M‐H, Fixed, 95% CI) | 0.56 [0.36, 0.87] |
| 1.16 Days off work (worse or similar) | 1 | 1165 | Odds Ratio (M‐H, Fixed, 95% CI) | 0.64 [0.50, 0.83] |
| 1.17 Days of school (worse or similar) | 1 | 502 | Odds Ratio (M‐H, Fixed, 95% CI) | 0.54 [0.37, 0.79] |
| 2 Asthma‐related outcomes CBA | 1 | Odds Ratio (M‐H, Fixed, 95% CI) | Totals not selected | |
| 2.1 Asthma at baseline | 1 | Odds Ratio (M‐H, Fixed, 95% CI) | 0.0 [0.0, 0.0] | |
| 2.2 Asthma at follow‐up | 1 | Odds Ratio (M‐H, Fixed, 95% CI) | 0.0 [0.0, 0.0] | |
| 3 Respiratory infections RCT | 2 | Odds Ratio (M‐H, Fixed, 95% CI) | Subtotals only | |
| 3.1 Rhinitis at 6 months | 1 | 126 | Odds Ratio (M‐H, Fixed, 95% CI) | 0.58 [0.23, 1.44] |
| 3.2 Rhinitis at 12 months | 2 | 3080 | Odds Ratio (M‐H, Fixed, 95% CI) | 0.57 [0.49, 0.66] |
| 3.3 Rhinoconjunctivitis at 6 months | 1 | 126 | Odds Ratio (M‐H, Fixed, 95% CI) | 0.36 [0.13, 1.01] |
| 3.4 Rhinoconjunctivitis at 12 months | 1 | 171 | Odds Ratio (M‐H, Fixed, 95% CI) | 0.36 [0.15, 0.87] |
| 4 Respiratory infections CBA | 1 | Odds Ratio (M‐H, Fixed, 95% CI) | Totals not selected | |
| 4.1 Chest infections or bronchitis at baseline | 1 | Odds Ratio (M‐H, Fixed, 95% CI) | 0.0 [0.0, 0.0] | |
| 4.2 Chest infections or bronchitis at follow‐up | 1 | Odds Ratio (M‐H, Fixed, 95% CI) | 0.0 [0.0, 0.0] | |
| 4.3 Pneumonia at baseline | 1 | Odds Ratio (M‐H, Fixed, 95% CI) | 0.0 [0.0, 0.0] | |
| 4.4 Pneumonia at follow‐up | 1 | Odds Ratio (M‐H, Fixed, 95% CI) | 0.0 [0.0, 0.0] |
Comparison 2. Mould remediation complete versus in progress in houses ‐ effects in adults.
| Outcome or subgroup title | No. of studies | No. of participants | Statistical method | Effect size |
|---|---|---|---|---|
| 1 Asthma‐related outcomes CBA | 1 | Odds Ratio (Fixed, 95% CI) | Totals not selected | |
| 1.1 Asthma at follow‐up | 1 | Odds Ratio (Fixed, 95% CI) | 0.0 [0.0, 0.0] | |
| 1.2 Medication for breathing problems | 1 | Odds Ratio (Fixed, 95% CI) | 0.0 [0.0, 0.0] | |
| 2 Respiratory symptoms CBA | 1 | Odds Ratio (Fixed, 95% CI) | Totals not selected | |
| 2.1 Allergic rhinitis | 1 | Odds Ratio (Fixed, 95% CI) | 0.0 [0.0, 0.0] |
Comparison 3. Mould remediation versus no exposure in offices ‐ effects in adults.
| Outcome or subgroup title | No. of studies | No. of participants | Statistical method | Effect size |
|---|---|---|---|---|
| 1 Respiratory symptoms CBA | 1 | Odds Ratio (M‐H, Fixed, 95% CI) | Totals not selected | |
| 1.1 Building‐related symptoms at baseline | 1 | Odds Ratio (M‐H, Fixed, 95% CI) | 0.0 [0.0, 0.0] | |
| 1.2 Building‐related symptoms at follow‐up | 1 | Odds Ratio (M‐H, Fixed, 95% CI) | 0.0 [0.0, 0.0] | |
| 1.3 Respiratory illnesses at baseline | 1 | Odds Ratio (M‐H, Fixed, 95% CI) | 0.0 [0.0, 0.0] | |
| 1.4 Respiratory illnesses at follow‐up | 1 | Odds Ratio (M‐H, Fixed, 95% CI) | 0.0 [0.0, 0.0] |
Comparison 4. Mould remediation versus information only in houses ‐ effects in children.
| Outcome or subgroup title | No. of studies | No. of participants | Statistical method | Effect size |
|---|---|---|---|---|
| 1 Asthma‐related outcomes (symptom days) RCT | 1 | Mean Difference (IV, Fixed, 95% CI) | Totals not selected | |
| 1.1 Max symptom days at baseline (unadj, ln values) | 1 | Mean Difference (IV, Fixed, 95% CI) | 0.0 [0.0, 0.0] | |
| 1.2 Max symptom days at 12 months follow‐up (unadj, ln values) | 1 | Mean Difference (IV, Fixed, 95% CI) | 0.0 [0.0, 0.0] | |
| 1.3 Max symptom days at baseline (adj ln values) | 1 | Mean Difference (IV, Fixed, 95% CI) | 0.0 [0.0, 0.0] | |
| 1.4 Max symptom days at 12 months follow‐up (adj, ln values) | 1 | Mean Difference (IV, Fixed, 95% CI) | 0.0 [0.0, 0.0] | |
| 2 Asthma related outcomes (ED visits, 1 or more) RCT | 1 | Risk Ratio (M‐H, Fixed, 95% CI) | Totals not selected | |
| 2.1 During whole 12 months follow‐up | 1 | Risk Ratio (M‐H, Fixed, 95% CI) | 0.0 [0.0, 0.0] | |
| 2.2 During follow‐up 6 to 12 months | 1 | Risk Ratio (M‐H, Fixed, 95% CI) | 0.0 [0.0, 0.0] |
4.2. Analysis.
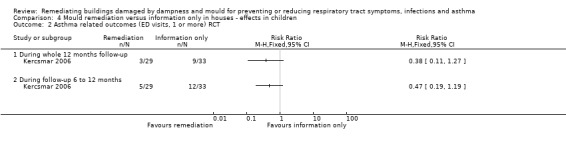
Comparison 4 Mould remediation versus information only in houses ‐ effects in children, Outcome 2 Asthma related outcomes (ED visits, 1 or more) RCT.
Comparison 5. Mould remediation versus no exposure in schools ‐ effects in children.
| Outcome or subgroup title | No. of studies | No. of participants | Statistical method | Effect size |
|---|---|---|---|---|
| 1 Asthma‐related outcomes CBA | 3 | Odds Ratio (M‐H, Fixed, 95% CI) | Totals not selected | |
| 1.1 Coughing before intervention | 3 | Odds Ratio (M‐H, Fixed, 95% CI) | 0.0 [0.0, 0.0] | |
| 1.2 Coughing after intervention | 3 | Odds Ratio (M‐H, Fixed, 95% CI) | 0.0 [0.0, 0.0] | |
| 1.3 Dyspnoea before intervention | 2 | Odds Ratio (M‐H, Fixed, 95% CI) | 0.0 [0.0, 0.0] | |
| 1.4 Dyspnoea after intervention | 2 | Odds Ratio (M‐H, Fixed, 95% CI) | 0.0 [0.0, 0.0] | |
| 1.5 Wheezing before intervention | 2 | Odds Ratio (M‐H, Fixed, 95% CI) | 0.0 [0.0, 0.0] | |
| 1.6 Wheezing after intervention | 2 | Odds Ratio (M‐H, Fixed, 95% CI) | 0.0 [0.0, 0.0] | |
| 2 Respiratory infections CBA | 1 | Mean Difference (IV, Fixed, 95% CI) | Totals not selected | |
| 2.1 All respiratory infections at baseline | 1 | Mean Difference (IV, Fixed, 95% CI) | 0.0 [0.0, 0.0] | |
| 2.2 All respiratory infections at follow‐up | 1 | Mean Difference (IV, Fixed, 95% CI) | 0.0 [0.0, 0.0] | |
| 2.3 Common cold at baseline | 1 | Mean Difference (IV, Fixed, 95% CI) | 0.0 [0.0, 0.0] | |
| 2.4 Common cold at follow‐up | 1 | Mean Difference (IV, Fixed, 95% CI) | 0.0 [0.0, 0.0] | |
| 2.5 Tonsillitis at baseline | 1 | Mean Difference (IV, Fixed, 95% CI) | 0.0 [0.0, 0.0] | |
| 2.6 Tonsillitis at follow‐up | 1 | Mean Difference (IV, Fixed, 95% CI) | 0.0 [0.0, 0.0] | |
| 2.7 Otitis at baseline | 1 | Mean Difference (IV, Fixed, 95% CI) | 0.0 [0.0, 0.0] | |
| 2.8 Otitis at follow‐up | 1 | Mean Difference (IV, Fixed, 95% CI) | 0.0 [0.0, 0.0] | |
| 2.9 Sinusitis at baseline | 1 | Mean Difference (IV, Fixed, 95% CI) | 0.0 [0.0, 0.0] | |
| 2.10 Sinusitis at follow‐up | 1 | Mean Difference (IV, Fixed, 95% CI) | 0.0 [0.0, 0.0] | |
| 2.11 Bronchitis or pneumonia at baseline | 1 | Mean Difference (IV, Fixed, 95% CI) | 0.0 [0.0, 0.0] | |
| 2.12 Bronchitis or pneumonia at follow‐up | 1 | Mean Difference (IV, Fixed, 95% CI) | 0.0 [0.0, 0.0] | |
| 2.13 Use antibiotics at baseline | 1 | Mean Difference (IV, Fixed, 95% CI) | 0.0 [0.0, 0.0] | |
| 2.14 Use antibiotics at follow‐up | 1 | Mean Difference (IV, Fixed, 95% CI) | 0.0 [0.0, 0.0] | |
| 3 Respiratory symptoms CBA | 3 | Odds Ratio (M‐H, Fixed, 95% CI) | Totals not selected | |
| 3.1 Eye irritation before intervention | 3 | Odds Ratio (M‐H, Fixed, 95% CI) | 0.0 [0.0, 0.0] | |
| 3.2 Eye irritation after intervention | 3 | Odds Ratio (M‐H, Fixed, 95% CI) | 0.0 [0.0, 0.0] | |
| 3.3 Stuffy nose before intervention | 3 | Odds Ratio (M‐H, Fixed, 95% CI) | 0.0 [0.0, 0.0] | |
| 3.4 Stuffy nose after intervention | 3 | Odds Ratio (M‐H, Fixed, 95% CI) | 0.0 [0.0, 0.0] | |
| 3.5 Runny nose before intervention | 3 | Odds Ratio (M‐H, Fixed, 95% CI) | 0.0 [0.0, 0.0] | |
| 3.6 Runny nose after intervention | 3 | Odds Ratio (M‐H, Fixed, 95% CI) | 0.0 [0.0, 0.0] | |
| 3.7 Dry throat before intervention | 3 | Odds Ratio (M‐H, Fixed, 95% CI) | 0.0 [0.0, 0.0] | |
| 3.8 Dry throat after intervention | 3 | Odds Ratio (M‐H, Fixed, 95% CI) | 0.0 [0.0, 0.0] | |
| 3.9 Hoarseness before intervention | 3 | Odds Ratio (M‐H, Fixed, 95% CI) | 0.0 [0.0, 0.0] | |
| 3.10 Hoarseness after intervention | 3 | Odds Ratio (M‐H, Fixed, 95% CI) | 0.0 [0.0, 0.0] |
Comparison 6. Mould remediation versus no exposure in schools ‐ effects in adults.
| Outcome or subgroup title | No. of studies | No. of participants | Statistical method | Effect size |
|---|---|---|---|---|
| 1 Asthma‐related outcomes CBA | 1 | Odds Ratio (M‐H, Fixed, 95% CI) | Totals not selected | |
| 1.1 Cough before intervention | 1 | Odds Ratio (M‐H, Fixed, 95% CI) | 0.0 [0.0, 0.0] | |
| 1.2 Cough after intervention | 1 | Odds Ratio (M‐H, Fixed, 95% CI) | 0.0 [0.0, 0.0] | |
| 1.3 Dyspnoea before intervention | 1 | Odds Ratio (M‐H, Fixed, 95% CI) | 0.0 [0.0, 0.0] | |
| 1.4 Dyspnoea after intervention | 1 | Odds Ratio (M‐H, Fixed, 95% CI) | 0.0 [0.0, 0.0] | |
| 1.5 Wheezing before intervention | 1 | Odds Ratio (M‐H, Fixed, 95% CI) | 0.0 [0.0, 0.0] | |
| 1.6 Wheezing after intervention | 1 | Odds Ratio (M‐H, Fixed, 95% CI) | 0.0 [0.0, 0.0] | |
| 2 Asthma symptom score | 1 | Mean Difference (IV, Fixed, 95% CI) | Totals not selected | |
| 2.1 Lower respiratory symptoms at baseline | 1 | Mean Difference (IV, Fixed, 95% CI) | 0.0 [0.0, 0.0] | |
| 2.2 Lower respiratory symptoms 1‐year follow‐up | 1 | Mean Difference (IV, Fixed, 95% CI) | 0.0 [0.0, 0.0] | |
| 2.3 Lower respiratory symptoms 3‐year follow‐up | 1 | Mean Difference (IV, Fixed, 95% CI) | 0.0 [0.0, 0.0] | |
| 3 Respiratory symptoms CBA | 1 | Odds Ratio (M‐H, Fixed, 95% CI) | Totals not selected | |
| 3.1 Eye irritation before intervention | 1 | Odds Ratio (M‐H, Fixed, 95% CI) | 0.0 [0.0, 0.0] | |
| 3.2 Eye irritation after intervention | 1 | Odds Ratio (M‐H, Fixed, 95% CI) | 0.0 [0.0, 0.0] | |
| 3.3 Stuffy nose before intervention | 1 | Odds Ratio (M‐H, Fixed, 95% CI) | 0.0 [0.0, 0.0] | |
| 3.4 Stuffy nose after intervention | 1 | Odds Ratio (M‐H, Fixed, 95% CI) | 0.0 [0.0, 0.0] | |
| 3.5 Runny nose before intervention | 1 | Odds Ratio (M‐H, Fixed, 95% CI) | 0.0 [0.0, 0.0] | |
| 3.6 Runny nose after intervention | 1 | Odds Ratio (M‐H, Fixed, 95% CI) | 0.0 [0.0, 0.0] | |
| 3.7 Dry throat before intervention | 1 | Odds Ratio (M‐H, Fixed, 95% CI) | 0.0 [0.0, 0.0] | |
| 3.8 Dry throat after intervention | 1 | Odds Ratio (M‐H, Fixed, 95% CI) | 0.0 [0.0, 0.0] | |
| 3.9 Hoarseness before intervention | 1 | Odds Ratio (M‐H, Fixed, 95% CI) | 0.0 [0.0, 0.0] | |
| 3.10 Hoarseness after intervention | 1 | Odds Ratio (M‐H, Fixed, 95% CI) | 0.0 [0.0, 0.0] | |
| 4 Respiratory symptom score | 1 | Mean Difference (IV, Fixed, 95% CI) | Totals not selected | |
| 4.1 Irritative symptoms at baseline | 1 | Mean Difference (IV, Fixed, 95% CI) | 0.0 [0.0, 0.0] | |
| 4.2 Irritative symptoms at 1‐year follow‐up | 1 | Mean Difference (IV, Fixed, 95% CI) | 0.0 [0.0, 0.0] | |
| 4.3 Irritative symptoms at 3‐year follow‐up | 1 | Mean Difference (IV, Fixed, 95% CI) | 0.0 [0.0, 0.0] |
Characteristics of studies
Characteristics of included studies [ordered by study ID]
Burr 2007.
| Methods | RCT | |
| Participants | Participants aged 3 to 61 who reported symptoms of asthma in the last 12 months and indoor mould in 81 intervention houses (115 persons) and 83 control houses (117 persons) in South Wales | |
| Interventions | Removal of all visible mould and fungicide treatment in mould‐damaged houses. A positive input fan was also installed in damaged houses | |
| Outcomes | Buildings ‐ Primary: presence of visible indoor mould Secondary: temperature and humidity Patients ‐ Primary: variability in peak expiratory flow rate Secondary: perceived improvement in breathing, reported change in medication use, wheezing and symptoms of rhinitis and rhinoconjunctivitis |
|
| Notes | The intervention was only partially successful, because by 12 months mould was present in 40% of the intervention houses and 78% of the control houses | |
| Risk of bias | ||
| Bias | Authors' judgement | Support for judgement |
| Blinding of participants and personnel (performance bias) All outcomes | High risk | Not done |
| Blinding of outcome assessment (detection bias) All outcomes | Unclear risk | Probably not done |
| Unplanned subgroup analyses (16) | Low risk | No unplanned subgroup analyses |
| Follow‐up (17) | Low risk | Follow‐up time 12 months |
| Compliance (19) | Unclear risk | "Some members of the control group took their own action to remove mould so that by 12 months it was present in only 78% of control houses" |
| Valid outcome measures (20) | Unclear risk | Subjective symptoms and changes in asthma medication |
| Selection bias (population) (21) | Low risk | Both participants and controls were recruited from the same population |
| Selection bias (time) (22) | Low risk | The questionnaires were sent to both the intervention and control group at the same time |
| Random sequence generation (selection bias) | Low risk | The houses were randomised |
| Allocation concealment (selection bias) | Unclear risk | Not reported |
| Adjustment for confounding (25) | Unclear risk | Only mean age and number of current smokers were reported |
| Incomplete outcome data (26) (attrition bias) | Low risk | The numbers of houses and persons lost to follow‐up were reported |
Eick 2011.
| Methods | Controlled before‐after study | |
| Participants | Children (n = 46), mean age 6.6 years. The homes where at least 1 asthmatic child under 12 years lived permanently and which received income‐related, state‐funded benefits were included and the control homes were randomly chosen from these | |
| Interventions | Retrofitted, whole‐house mechanical ventilation with heat recovery system, laminate flooring, anti‐allergy bed clothes, a central vacuum cleaner and central heating were installed | |
| Outcomes | Buildings, temperature, relative humidity, fine particles, coarse particles, wall/wall surface moisture, dust mite allergen, microbial colonies, carbon dioxide, carbon monoxide Participants: asthma‐related and other respiratory symptoms |
|
| Notes | Mould or mould damage was observed in 55% of the homes before intervention. Only the pilot study was included in the review | |
| Risk of bias | ||
| Bias | Authors' judgement | Support for judgement |
| Blinding of participants and personnel (performance bias) All outcomes | High risk | Not blinded |
| Blinding of outcome assessment (detection bias) All outcomes | High risk | Not blinded |
| Unplanned subgroup analyses (16) | Low risk | No data dredging |
| Follow‐up (17) | Low risk | Follow‐up time up to 3 years? |
| Compliance (19) | Unclear risk | Compliance not reported |
| Valid outcome measures (20) | Unclear risk | Questionnaire of subjective symptoms |
| Selection bias (population) (21) | Low risk | Participants and controls were recruited from the same population |
| Selection bias (time) (22) | Unclear risk | Interviews of the study group and control group were probably performed at the same time |
| Random sequence generation (selection bias) | High risk | Not done |
| Allocation concealment (selection bias) | High risk | Not done |
| Adjustment for confounding (25) | High risk | Not done |
| Incomplete outcome data (26) (attrition bias) | High risk | Medians of symptom scores were reported in each intervention group |
Hoppe 2012.
| Methods | Controlled before‐after study | |
| Participants | Remediation in progress homes (n = 24) were compared to the completed homes (n = 49) after a great flood in Iowa, USA | |
| Interventions | Removal and replacement of cabinetry, drywall, flooring and insulation with a drying‐out period between removal and replacement | |
| Outcomes | Buildings: asbestos, lead, radon, CO, CO2, relative humidity, temperature, wall moisture, bioaerosol concentrations (mould, bacteria, inhalable particular matter, endotoxin, linear and branched β‐D‐glucan, common household allergens Participants: doctor‐diagnosed asthma, prescription for breathing problems, self reported asthma, wheeze, trouble breathing, allergic rhinitis |
|
| Notes | There were no baseline data available for the prevalence of respiratory symptoms or diseases before the intervention | |
| Risk of bias | ||
| Bias | Authors' judgement | Support for judgement |
| Blinding of participants and personnel (performance bias) All outcomes | High risk | Not blinded |
| Blinding of outcome assessment (detection bias) All outcomes | High risk | Not blinded |
| Unplanned subgroup analyses (16) | Unclear risk | Data dredging unclear |
| Follow‐up (17) | Unclear risk | Follow‐up time 4 to 9 months |
| Compliance (19) | Unclear risk | Compliance not reported |
| Valid outcome measures (20) | Unclear risk | Questionnaire of subjective symptoms |
| Selection bias (population) (21) | Low risk | Both participants and controls were recruited from the same population |
| Selection bias (time) (22) | Low risk | The questionnaires were sent to both the intervention and control group at the same time |
| Random sequence generation (selection bias) | High risk | Not done |
| Allocation concealment (selection bias) | High risk | Not done |
| Adjustment for confounding (25) | Low risk | Results adjusted for age, sex and smoking history |
| Incomplete outcome data (26) (attrition bias) | Low risk | Loss to follow‐up only 2 out of 73 |
Howden‐Chapman 2007.
| Methods | cRCT | |
| Participants | 1350 households in which at least 1 household member had reported respiratory symptoms in the past year or had a history of asthma, pneumonia or chest infections. Members were planning to stay in the house for the next 2 winters living in uninsulated dwellings in 7 low‐income communities in New Zealand (4407 participants) | |
| Interventions | Installation of a standard retrofit insulation package | |
| Outcomes | Buildings ‐ Primary: changes in self reported dampness and warmth, measured temperature and relative humidity, comfort charts, self reported fuel usage, measured data from energy companies Secondary: changes in musty smell, observed mould, mould speciation, mould mass, endotoxins, beta‐glucans, dust mite allergens, smoking behaviour Patients ‐ Primary: wheezing, days off work or school, self reported visit to general practitioner, general practitioner reported visit, hospital admittance, main code respiratory condition Secondary: SF‐36: vitality, happiness, general health; self reported symptoms of colds or flu |
|
| Notes | The intervention was not specifically aimed at reducing exposure to mould | |
| Risk of bias | ||
| Bias | Authors' judgement | Support for judgement |
| Blinding of participants and personnel (performance bias) All outcomes | High risk | Not done |
| Blinding of outcome assessment (detection bias) All outcomes | Low risk | Assessors were blinded |
| Unplanned subgroup analyses (16) | Low risk | No unplanned subgroup analyses |
| Follow‐up (17) | Low risk | About 1 year follow‐up |
| Compliance (19) | Low risk | "insulation was installed by trained community teams" |
| Valid outcome measures (20) | Unclear risk | Self reported symptoms and number of days off work or school |
| Selection bias (population) (21) | Low risk | Participants and controls were recruited from the same population |
| Selection bias (time) (22) | Low risk | The questionnaires were sent to the intervention and control group at the same time |
| Random sequence generation (selection bias) | Unclear risk | The households were randomised |
| Allocation concealment (selection bias) | Unclear risk | Not reported |
| Adjustment for confounding (25) | Low risk | Adjusted and non‐adjusted results were reported |
| Incomplete outcome data (26) (attrition bias) | Low risk | The numbers of households lost to follow‐up were reported |
Jarvis 2001.
| Methods | Controlled before‐after study | |
| Participants | 488 current occupants of a moisture‐damaged office building in the USA | |
| Interventions | 1. Intervention: removal of visibly mouldy gypsum board, structural changes including replacement of windows and installation of a vapour‐air retarder 2. Intervention: because there was new mould growth after the first intervention, the second intervention included removal of mouldy wallboard, HVAC insulation, upholstered furniture was discarded, interior surfaces were cleaned, damaged books and archives were discarded |
|
| Outcomes | Buildings: inspection of possible new mould growth, air sampling of the moulds Participants: respiratory symptoms, discomfort complaints, medication, sick leave |
|
| Notes | — | |
| Risk of bias | ||
| Bias | Authors' judgement | Support for judgement |
| Blinding of participants and personnel (performance bias) All outcomes | High risk | Not blinded |
| Blinding of outcome assessment (detection bias) All outcomes | High risk | Not blinded |
| Unplanned subgroup analyses (16) | Low risk | No unplanned subgroup analyses |
| Follow‐up (17) | Low risk | Follow‐up time 8.8 years |
| Compliance (19) | Unclear risk | Compliance unclear |
| Valid outcome measures (20) | High risk | Standardised questionnaire, but self invented case definitions |
| Selection bias (population) (21) | Unclear risk | The index building is well described, but there is not much information about the comparison building |
| Selection bias (time) (22) | Unclear risk | The timing of questionnaires in the comparison building is not reported |
| Random sequence generation (selection bias) | High risk | Not randomised |
| Allocation concealment (selection bias) | High risk | Not reported |
| Adjustment for confounding (25) | Unclear risk | Distribution of known confounders in the intervention and control group was said to be similar (no data) |
| Incomplete outcome data (26) (attrition bias) | Low risk | 82% of the occupants completed the final survey |
Kercsmar 2006.
| Methods | RCT | |
| Participants | Symptomatic children (n = 62), 2 to 17 years of age, living in a home with indoor mould and who had physician‐diagnosed asthma for at least 3 months before enrolment, had made at least 2 emergency department visits or had at least 1 hospitalisation for asthma in the 12 months preceding enrolment | |
| Interventions | Interventions were directed at reducing water infiltration, removal of water‐damaged building materials, alterations to heating/ventilation/air conditioning, lead hazard control and environmental cleaning | |
| Outcomes | Building: a standardised visual assessment tool was used to score the extent of visible moulds present in multiple areas of the home. Dust samples were obtained from the child's bedroom to measure mould, dust mite, cockroach, mouse and rat urine allergens and endotoxin Patients: primary: maximum number of asthma symptom days Secondary: hospitalisation, emergency department visits, pulmonary function data, Children's Health Survey of Asthma (CHSA), inflammatory markers |
|
| Notes | — | |
| Risk of bias | ||
| Bias | Authors' judgement | Support for judgement |
| Blinding of participants and personnel (performance bias) All outcomes | High risk | Not blinded |
| Blinding of outcome assessment (detection bias) All outcomes | High risk | Not blinded |
| Unplanned subgroup analyses (16) | Low risk | No unplanned subgroup analyses |
| Follow‐up (17) | Low risk | Follow‐up time of 1 year |
| Compliance (19) | Unclear risk | Unclear compliance |
| Valid outcome measures (20) | Unclear risk | Mean maximal symptom days presented only in a figure. Acute care visits confirmed from hospital records |
| Selection bias (population) (21) | Low risk | Participants were from the same hospital |
| Selection bias (time) (22) | Unclear risk | Interviews of the study group and control group were probably performed at the same time |
| Random sequence generation (selection bias) | Low risk | Participants were randomised with a permuted block scheme |
| Allocation concealment (selection bias) | Unclear risk | Probably no concealment |
| Adjustment for confounding (25) | Low risk | Distribution of known confounders in the intervention and control group was described |
| Incomplete outcome data (26) (attrition bias) | Low risk | |
Meklin 2005a.
| Methods | Controlled before‐after study | |
| Participants | School children (7 to 13 yrs) in a mould‐damaged school (before repairs 414 pupils and 408 after repairs), were compared to children (7 to 14) in a non‐damaged school (208 pupils in the beginning and 238 in the final survey) in Finland | |
| Interventions | Extensive renovation of the school building: structures were opened and renewed, land‐drains, drain‐, heating and water pipes were renewed, all coating materials were renewed, ventilation was installed, alteration from natural ventilation to mechanical exhaust and air supply. A thorough cleaning of the school | |
| Outcomes | Buildings: self reported draft, insufficient ventilation, humid indoor air, mould odour, other unpleasant odour, dust or dirt, airborne bacteria and fungi Participants: self reported respiratory and asthma‐related symptoms |
|
| Notes | Results are presented in 2 different articles | |
| Risk of bias | ||
| Bias | Authors' judgement | Support for judgement |
| Blinding of participants and personnel (performance bias) All outcomes | High risk | Not blinded |
| Blinding of outcome assessment (detection bias) All outcomes | High risk | Not blinded |
| Unplanned subgroup analyses (16) | Unclear risk | No data dredging |
| Follow‐up (17) | Low risk | Follow‐up time up to 5 years |
| Compliance (19) | Unclear risk | Compliance unclear |
| Valid outcome measures (20) | Unclear risk | Questionnaire of subjective symptoms |
| Selection bias (population) (21) | High risk | Participants and controls were from the same population but in the fully repaired school the attention to the problems seemed to be greater than elsewhere |
| Selection bias (time) (22) | Low risk | The questionnaires were sent to the intervention and control group at the same time |
| Random sequence generation (selection bias) | High risk | Not done |
| Allocation concealment (selection bias) | High risk | Not done |
| Adjustment for confounding (25) | Low risk | Age and prevalence of smoking was reported |
| Incomplete outcome data (26) (attrition bias) | Low risk | Loss to follow‐up reported |
Meklin 2005b.
| Methods | Controlled before‐after study | |
| Participants | Schoolchildren (13 to 16 years) in a mould‐damaged school (before repairs 431 pupils and 296 after repairs), were compared to children (13 to 17 years) in a non‐damaged school (318 pupils in the beginning and 388 in the final survey) in Finland | |
| Interventions | Drying of the ground structures and renewing of floor and wall coatings of the main corridor in the ground floor, renewing of land‐drains and external moisture barriers, mainly a mechanical exhaust ventilation system, thorough cleaning of ventilation ducts. A thorough cleaning of the school | |
| Outcomes | Buildings: self reported draft, insufficient ventilation, humid indoor air, mould odour, other unpleasant odour, dust or dirt, airborne bacteria and fungi Participants: self reported respiratory and asthma‐related symptoms |
|
| Notes | The mean fungal concentration and the mean concentration of bacteria were higher after the partial renovation than before | |
| Risk of bias | ||
| Bias | Authors' judgement | Support for judgement |
| Blinding of participants and personnel (performance bias) All outcomes | High risk | Not blinded |
| Blinding of outcome assessment (detection bias) All outcomes | High risk | Not blinded |
| Unplanned subgroup analyses (16) | Low risk | No data dredging |
| Follow‐up (17) | Low risk | Follow‐up time up to 5 years |
| Compliance (19) | Unclear risk | Compliance unclear |
| Valid outcome measures (20) | Unclear risk | Questionnaire of subjective symptoms |
| Selection bias (population) (21) | Low risk | Participants and controls were recruited from the same population |
| Selection bias (time) (22) | Low risk | The questionnaires were sent to the intervention and control group at the same time |
| Random sequence generation (selection bias) | High risk | Not randomised |
| Allocation concealment (selection bias) | High risk | Not concealed |
| Adjustment for confounding (25) | Low risk | Age and prevalence of smoking was reported |
| Incomplete outcome data (26) (attrition bias) | Low risk | Loss to follow‐up reported |
Patovirta 2004a.
| Methods | Controlled before‐after study | |
| Participants | 44 teachers working in a complex of 3 school buildings in Finland, 2 of which were water‐damaged | |
| Interventions | Thorough remediation of the water‐damaged schools | |
| Outcomes | Buildings: reported in Haverinen 1999 Participants: self reported allergic symptoms, infections, respiratory, skin and general symptoms Results of lung function measurements (n = 23) |
|
| Notes | Data for self reported infections and allergic symptoms of control group not shown | |
| Risk of bias | ||
| Bias | Authors' judgement | Support for judgement |
| Blinding of participants and personnel (performance bias) All outcomes | High risk | Not blinded |
| Blinding of outcome assessment (detection bias) All outcomes | High risk | Not blinded |
| Unplanned subgroup analyses (16) | Low risk | No unplanned subgroup analyses |
| Follow‐up (17) | Low risk | Follow‐up time 3 years |
| Compliance (19) | Unclear risk | Compliance unclear |
| Valid outcome measures (20) | Low risk | Spirometry was used in addition to a questionnaire |
| Selection bias (population) (21) | Low risk | Participants and controls were recruited from the same population |
| Selection bias (time) (22) | Low risk | The questionnaires were sent to the intervention and control group at the same time |
| Random sequence generation (selection bias) | High risk | Not randomised |
| Allocation concealment (selection bias) | High risk | Not concealed |
| Adjustment for confounding (25) | Unclear risk | Distribution of known confounders in the intervention and control group was said to be similar (no data) |
| Incomplete outcome data (26) (attrition bias) | Unclear risk | No data for respiratory infections in the control group |
Savilahti 2000.
| Methods | Controlled before‐after study | |
| Participants | The study group consisted of 397 children aged 7 to 12 in a mould‐damaged school and a control group of 192 non‐exposed children of the same age in a control school in Finland | |
| Interventions | Thorough remediation of the moisture‐damaged school | |
| Outcomes | Building: investigation of the buildings. Microbiological samples from the air, surfaces and materials Participants: occurrence of respiratory infections (common cold, tonsillitis, otitis, sinusitis, bronchitis) |
|
| Notes | The moisture damage was verified using microbiological samples from the air, surfaces and materials. Following renovation, new samples were taken | |
| Risk of bias | ||
| Bias | Authors' judgement | Support for judgement |
| Blinding of participants and personnel (performance bias) All outcomes | High risk | Not blinded |
| Blinding of outcome assessment (detection bias) All outcomes | High risk | Not blinded |
| Unplanned subgroup analyses (16) | Low risk | No unplanned subgroup analyses |
| Follow‐up (17) | Low risk | Follow‐up time of 1 year |
| Compliance (19) | Unclear risk | Compliance unclear |
| Valid outcome measures (20) | Low risk | Medical records were used in addition to the questionnaire |
| Selection bias (population) (21) | Low risk | Participants and controls were recruited from the same population |
| Selection bias (time) (22) | Low risk | The questionnaires were sent to both the intervention and control group at the same time |
| Random sequence generation (selection bias) | High risk | Not randomised |
| Allocation concealment (selection bias) | High risk | Not concealed |
| Adjustment for confounding (25) | Low risk | Distribution of known confounders in the intervention and control group was described |
| Incomplete outcome data (26) (attrition bias) | Low risk | Response rate to the second questionnaire was 81% in the intervention school and 100% in the control school |
Shortt 2007.
| Methods | Controlled before‐after study | |
| Participants | Elderly, low‐income families and the infirm, 54 households in the experimental group and 46 in the control group | |
| Interventions | Energy efficiency measures, including central heating systems | |
| Outcomes | Buildings: participants' opinions on whether their homes suffered from condensation, mould and damp Temperature change Participants: satisfaction rates with internal temperature Prevalence of angina, arthritis/rheumatism, chest infections, bronchitis, pneumonia/hypothermia, stress/mental illness |
|
| Notes | — | |
| Risk of bias | ||
| Bias | Authors' judgement | Support for judgement |
| Blinding of participants and personnel (performance bias) All outcomes | High risk | Not blinded |
| Blinding of outcome assessment (detection bias) All outcomes | High risk | Not blinded |
| Unplanned subgroup analyses (16) | Low risk | No unplanned subgroup analyses |
| Follow‐up (17) | Low risk | Follow‐up time of 1 year |
| Compliance (19) | Unclear risk | Compliance unclear |
| Valid outcome measures (20) | Unclear risk | Questionnaire on subjective symptoms |
| Selection bias (population) (21) | High risk | Older people were selected for the intervention group |
| Selection bias (time) (22) | Unclear risk | Interviews of the study group and control group were probably performed at the same time |
| Random sequence generation (selection bias) | High risk | Not randomised |
| Allocation concealment (selection bias) | High risk | Not concealed |
| Adjustment for confounding (25) | High risk | Not adjusted |
| Incomplete outcome data (26) (attrition bias) | Unclear risk | Not reported |
Åhman 2000.
| Methods | Controlled before‐after study | |
| Participants | Pupils and personnel at 2 schools in Sweden 337 pupils and 34 personnel in the intervention school and 224 and 21 personnel in the control school | |
| Interventions | A new ventilated floor was installed and water damaged wallboards were exchanged | |
| Outcomes | Participants: physical and psycho‐social school environment parameters Frequency of irritating symptoms including respiratory symptoms |
|
| Notes | — | |
| Risk of bias | ||
| Bias | Authors' judgement | Support for judgement |
| Blinding of participants and personnel (performance bias) All outcomes | High risk | Not blinded |
| Blinding of outcome assessment (detection bias) All outcomes | High risk | Not blinded |
| Unplanned subgroup analyses (16) | Low risk | No unplanned subgroup analyses |
| Follow‐up (17) | Unclear risk | Follow‐up time 7 months |
| Compliance (19) | Low risk | Compliance was reliable |
| Valid outcome measures (20) | Unclear risk | Subjective symptoms |
| Selection bias (population) (21) | Low risk | "These two schools (intervention school and the control school) were the only compulsory schools in this suburb, which had an even distribution of social factors, such as gender, immigrants and type of dwellings." |
| Selection bias (time) (22) | Low risk | The intervention and control group were interviewed at the same time |
| Random sequence generation (selection bias) | High risk | Not randomised |
| Allocation concealment (selection bias) | High risk | Not concealed |
| Adjustment for confounding (25) | Low risk | Distribution of known confounders in the intervention and control group was described |
| Incomplete outcome data (26) (attrition bias) | Low risk | Results were presented only for those who participated in both pre‐ and post‐intervention interviews |
cRCT = cluster‐randomised controlled trial HVAC = heating ventilation and air‐conditioning RCT = randomised controlled trial SF‐36 = short‐form health survey
Characteristics of excluded studies [ordered by study ID]
| Study | Reason for exclusion |
|---|---|
| Bailey 2009 | No control group |
| Beck 2013 | This is a multi‐component intervention to reduce asthma triggers. Mould reduction is only a small component among many others and thus it is impossible to discern its influence |
| Bernstein 1983 | A case study without a control group describing symptoms compatible with hypersensitivity pneumonitis in 2 of 14 employees in a clerical office |
| Butterfield 2010 | No health outcome data |
| Dhar 2012 | Abstract; no health outcome data |
| Dotterud 2012 | No difference in the dampness of the intervention and control buildings |
| Fabian 2014 | Not an empirical study; modelling of interventions |
| Garland 2013 | No remediation or repair of buildings |
| Haverinen 1999 | The symptoms were not surveyed after reparation of the building |
| Haverinen‐Shaughnessy 2004 | No control group was included |
| Howden‐Chapman 2005 | The paper describes the purpose and methods of a study that is included in this review (Howden‐Chapman 2007) |
| Iossifova 2010 | No control group |
| Iossifova 2011 | In the study design the cases (lower respiratory tract symptoms or systemic symptoms or diagnoses) in 2002 were compared to a group without these symptoms or diseases in 2002. There was not a non‐exposed control group nor an exposed control group without intervention |
| Johnson 2009 | No control group |
| Lloyd 2008 | The study did not address mould remediation and respiratory symptoms. The aim of this study was to examine the effect of improving the thermal quality of housing on blood pressure and general health |
| Morgan 2004 | The focus of the study was on the reduction of the levels of cockroach allergen and dust‐mite allergen (Der f1) and complications of asthma. No outcomes were reported regarding the remediation of buildings |
| Norback 2011 | No verified water damage or dampness in the buildings |
| O'Sullivan 2012 | No control group; no verification of remediation |
| Reynolds 2012 | No health outcome data |
| Santilli 2003 | The focus was on the measurement of mould spore counts. The health outcomes of 12 participants were descriptive |
| Stubner 2000 | No control group was included in the study; no data on health outcomes |
| Turyk 2013 | This is a multi‐component intervention to reduce asthma triggers in the home. Mould reduction was only a small component amidst many others and thus it is impossible to discern its influence |
| Wilkerson 2004 | No new study; the author has referred to the study of Morgan 2004 |
| Zhang 2012 | No intervention |
Contributions of authors
Riitta Sauni and Jos Verbeek conceived the idea and prepared the protocol and review.
Merja Jauhiainen and Riitta Sauni planned the search strategy.
Riitta Sauni, Jukka Uitti and Jos Verbeek extracted data and assessed risk of bias.
The other review authors commented on the protocol and the various drafts of the review and helped with conceptual problems.
The authors of the chosen articles were excluded from evaluating their own studies.
Sources of support
Internal sources
Finnish Institute of Occupational Health, Finland.
External sources
No sources of support supplied
Declarations of interest
Riitta Sauni: none known. Jos H Verbeek: I am employed by the Finnish Institute of Occupational Health to produce Cochrane Systematic Reviews of occupational safety and health topics. Jukka Uitti: none known. Merja Jauhiainen: none known. Kathleen Kreiss: none known. Torben Sigsgaard: Prof. Sigsgaard is a member of the Scientific Advisory Board of Rockwool International None of the authors have accepted financial benefits from any organisation that may in any way gain or lose financially from the results of our study or the conclusions of our review.
New search for studies and content updated (no change to conclusions)
References
References to studies included in this review
Åhman 2000 {published data only}
- Åhman M, Lundin A, Musabasic V, Söderman E. Improved health after intervention on a school with moisture problems. Indoor Air 2000;10:57‐62. [DOI] [PubMed] [Google Scholar]
Burr 2007 {published data only}
- Burr ML, Matthews IP, Arthur RA, Watson HL, Gregory CJ, Dunstan FDJ, et al. Effects on patients with asthma of eradicating visible indoor mould: a randomised controlled study. Thorax 2007;62:766‐71. [DOI] [PMC free article] [PubMed] [Google Scholar]
Eick 2011 {published data only}
- Eick SA, Richardson G. Investigation of different approaches to reduce allergens in asthmatic children's homes; the Breath of Fresh Air Project, Cornwall, UK. Science of the Total Environment 2011;409(19):3628‐33. [DOI] [PubMed] [Google Scholar]
Hoppe 2012 {published data only}
- Hoppe KA, Metwali N, Perry SS, Hart T, Kostle PA, Thorne PS. Assessment of airborne exposures and health in flooded homes undergoing renovation. Indoor Air 2012;22(6):446‐56. [DOI] [PMC free article] [PubMed] [Google Scholar]
Howden‐Chapman 2007 {published data only}
- Howden‐Chapman P, Matheson A, Crane J, Vigger H, Cunningham M, Blakely T, et al. Effect of insulating existing houses on health inequality: cluster randomised study in the community. BMJ 2007;334:460‐8. [DOI] [PMC free article] [PubMed] [Google Scholar]
Jarvis 2001 {published data only}
- Jarvis JQ, Morey PR. Allergic respiratory disease and fungal remediation on a building in a subtropical climate. Applied Occupational and Environmental Hygiene 2001;16:380‐8. [DOI] [PubMed] [Google Scholar]
Kercsmar 2006 {published data only}
- Kercsmar CM, Dearborn DG, Schluchter M, Xue L, Kirchner HL, Sobolewski J, et al. Reduction in asthma morbidity in children as a result of home remediation aimed at moisture sources. Environmental Health Perspectives 2006;114:1574‐80. [DOI] [PMC free article] [PubMed] [Google Scholar]
Meklin 2005a {published data only}
- Lignell U, Meklin T, Putus T, Rintala H, Vepsäläinen A, Kalliokoski P, et al. Effects of moisture damage and renovation on microbial conditions and pupils' health in two schools ‐ a longitudinal analysis of five years. Journal of Environmental Monitoring 2007;9(3):225‐33. [DOI] [PubMed] [Google Scholar]
- Meklin T, Potus T, Pekkanen J, Hyvärinen A, Hirvonen MR, Nevalainen A. Effects of moisture‐damage repairs on microbial exposure and symptoms in school children. Indoor Air 2005;15(Suppl 10):40‐7. [DOI] [PubMed] [Google Scholar]
Meklin 2005b {published data only}
- Lignell U, Meklin T, Putus T, Rintala H, Vepsäläinen A, Kalliokoski P, et al. Effects of moisture damage and renovation on microbial conditions and pupils' health in two schools ‐ a longitudinal analysis of five years. Journal of Environmental Monitoring 2007;9(3):225‐33. [DOI] [PubMed] [Google Scholar]
- Meklin T, Potus T, Pekkanen J, Hyvärinen A, Hirvonen MR, Nevalainen A. Effects of moisture‐damage repairs on microbial exposure and symptoms in school children. Indoor Air 2005;15(Suppl 10):40‐7. [DOI] [PubMed] [Google Scholar]
Patovirta 2004a {published data only}
- Patovirta R‐L, Husman T, Haverinen U, Vahteristo M, Uitti JA, Tukiainen H, et al. The remediation of mold damaged school ‐ a three year follow‐up study on teachers' health. Central European Journal of Public Health 2004;12:36‐42. [PubMed] [Google Scholar]
Savilahti 2000 {published data only}
- Savilahti R, Uitti J, Laippala P, Husman T, Roto P. Respiratory morbidity among children following renovation of a water‐damaged school. Archives of Environmental Health 2000;55:405‐10. [DOI] [PubMed] [Google Scholar]
Shortt 2007 {published data only}
- Shortt N, Rugkåsa J. "The walls were so damp and cold" fuel poverty and ill health in Northern Ireland: results from a housing intervention. Health & Place 2007;13:99‐110. [DOI] [PubMed] [Google Scholar]
References to studies excluded from this review
Bailey 2009 {published data only}
- Bailey R, Park JH, Saito R, Kreiss K, Cox Ganser J. Evaluation of dampness‐associated respiratory symptoms with relocation of staff during remediation of an elementary school ‐ North Carolina. NIOSH Health hazard evaluation report: HETA‐2009‐0172‐3124. www.cdc.gov/niosh/hhe/reports/pdfs/2009‐0172‐3124.pdf. Morgantown, WV (US): NIOSH, 2009. [Google Scholar]
Beck 2013 {published data only}
- Beck AF, Simmons JM, Sauers HS, Sharkey K, Alam M, Jones C, et al. Connecting at‐risk inpatient asthmatics to a community‐based program to reduce home environmental risks: care system redesign using quality improvement methods. Hospital Pediatrics 2013;3(4):326‐34. [DOI] [PubMed] [Google Scholar]
Bernstein 1983 {published data only}
- Bernstein RS, Sorenson WG, Garabrant D, Reaux C, Treitman RD. Exposures to respirable, airborne Penicillium from a contaminated ventilation system: clinical, environmental and epidemiological aspects. American Industrial Hygiene Association Journal 1983;44:161‐9. [DOI] [PubMed] [Google Scholar]
Butterfield 2010 {published data only}
- Butterfield PG, Hill W, Postma J, Butterfield PW, Odom‐Maryom T. Effectiveness of a household environmental health intervention delivered by rural public health nurses. American Journal of Public Health 2011;101(Suppl):262‐70. [DOI] [PMC free article] [PubMed] [Google Scholar]
Dhar 2012 {published data only}
- Dhar MG, Pacheco F, Barnes C. Indoor airborne spore levels before and after healthy homes education and remediation. Journal of Allergy and Clinical Immunology 2012;129(2):AB64. [Google Scholar]
Dotterud 2012 {published data only}
- Dotterud CK, Storro O, Simpson MR, Johnsen R, Oien T. The impact of pre‐ and postnatal exposures on allergy related diseases in childhood: a controlled multicentre intervention study in primary health care. BMC Public Health 2013;13:123. [DOI] [PMC free article] [PubMed] [Google Scholar]
Fabian 2014 {published data only}
- Fabian MP, Adamkiewicz G, Stout NK, Sandel M, Levy JI. A simulation model of building intervention impacts on indoor environmental quality, pediatric asthma, and costs. Journal of Allergy and Clinical Immunology 2014;133(1):77‐84. [DOI] [PMC free article] [PubMed] [Google Scholar]
Garland 2013 {published data only}
- Garland E, Steenburgh ET, Sanchez SH, Geevarughese A, Bluestone L, Rothenberg L, et al. Impact of LEED‐certified affordable housing on asthma in the South Bronx. Progress in Community Health Partnerships: Research, Education, and Action 2013;7(1):29‐37. [DOI] [PubMed] [Google Scholar]
Haverinen 1999 {published data only}
- Haverinen U, Husman T, Toivola M, Suonketo J, Pentti M, Lindberg R, et al. An approach to management of critical indoor air problems in school buildings. Environmental Health Perspectives 1999;107(Suppl 3):509‐14. [DOI] [PMC free article] [PubMed] [Google Scholar]
Haverinen‐Shaughnessy 2004 {published data only}
- Haverinen‐Shaughnessy U, Pekkanen J, Nevalainen A, Moschandreas D, Husman T. Estimating effects of moisture damage repairs on students' health ‐ a long‐term intervention study. Journal of Exposure Analysis and Environmental Epidemiology 2004;14(Suppl 1):58‐64. [DOI] [PubMed] [Google Scholar]
Howden‐Chapman 2005 {published data only}
- Howden‐Chapman P, Crane J, Matheson A, Viggers H, Cunningham M, Blakely T, et al. Retrofitting houses with insulation to reduce health inequalities: aims and methods of a clustered, randomised community‐based trial. Social Science & Medicine 2005;61:2600‐10. [DOI] [PubMed] [Google Scholar]
Iossifova 2010 {published data only}
- Iossifova Y, Cox‐Ganser J, Park J‐H, White SK, Kreiss K. Three years of dampness remediation and respiratory health of an office worker cohort. American Journal of Respiratory and Critical Care Medicine 2010;181:A4649. [Google Scholar]
Iossifova 2011 {published data only}
- Iossifova YY, Cox‐Ganser JM, Park J‐H, White SK, Kreiss K. Lack of respiratory improvement following remediation of a water‐damaged office building. American Journal of Industrial Medicine 2011;54(4):269‐77. [DOI] [PubMed] [Google Scholar]
Johnson 2009 {published data only}
- Johnson L, Ciaccio C, Barnes CS, Kennedy K, Forrest E, Gard LC, et al. Low‐cost interventions improve indoor air quality and children's health. Allergy & Asthma Proceedings 2009;30:377‐85. [DOI] [PubMed] [Google Scholar]
Lloyd 2008 {published data only}
- Lloyd EL, McCormack C, McKeever M, Syme M. The effect of improving the thermal quality of cold housing on blood pressure and general health: a research note. Journal of Epidemiology and Community Health 2008;62:793‐7. [DOI] [PubMed] [Google Scholar]
Morgan 2004 {published data only}
- Morgan WJ, Crain EF, Gruchalla RS, O'Connor GT, Kattan M, Evans R, et al. Results of a home‐based environmental intervention among urban children with asthma. New England Journal of Medicine 2004;351:1068‐80. [DOI] [PubMed] [Google Scholar]
Norback 2011 {published data only}
- Norback D, Wieslande Gr, Zhang X, Zhao Z. Respiratory symptoms, perceived air quality and physiological signs in elementary school pupils in relation to displacement and mixing ventilation system: an intervention study. Indoor Air 2011;21(5):427‐37. [DOI] [PubMed] [Google Scholar]
O'Sullivan 2012 {published data only}
- O'Sullivan MM, Brandfield J, Hoskote SS, Sefal SN, Chug L, Modrykamien A, et al. Environmental improvements brought by the legal interventions in the homes of poorly controlled inner‐city adult asthmatic patients: a proof‐of‐concept study. Journal of Asthma 2012;49(9):911‐7. [DOI] [PubMed] [Google Scholar]
Reynolds 2012 {published data only}
- Reynolds KA, Boone S, Bright KR, Gerba CP. Occurrence of household mold and efficacy of sodium hypochlorite disinfectant. Journal of Occupational and Environmental Hygiene 2012;9(11):633‐9. [DOI] [PubMed] [Google Scholar]
Santilli 2003 {published data only}
- Santilli J, Rockwell W. Fungal contamination of elementary schools: a new environmental hazard. Annals of Allergy, Asthma & Immunology 2003;90:203‐8. [DOI] [PubMed] [Google Scholar]
Stubner 2000 {published data only}
- Stubner AH, Dillon HK, Kohler CL. Home remediation for respiratory health: a feasibility study. Family & Community Health 2000;22:1‐15. [Google Scholar]
Turyk 2013 {published data only}
- Turyk M, Banda E, Chisum G, Weems D Jr, Liu Y, Damitz M, et al. A multifaceted community‐based asthma intervention in Chicago: effects of trigger reduction and self‐management education on asthma morbidity. Journal of Asthma 2013;50(7):729‐36. [DOI] [PubMed] [Google Scholar]
Wilkerson 2004 {published data only}
- Wilkerson RR. A multifaceted, home based, environmental intervention reduced asthma related morbidity in children with atopic asthma. Evidence‐based Nursing 2004;8:43. [DOI] [PubMed] [Google Scholar]
Zhang 2012 {published data only}
- Zhang X, Sahlberg B, Wieslander G, Janson C, Gislason T, Norback D. Dampness and moulds in workplace buildings: associations with incidence and remission of sick building syndrome (SBS) and biomarkers of inflammation in a 10 year follow‐up study. Science of the Total Environment 2012;430:75‐81. [DOI] [PubMed] [Google Scholar]
Additional references
Bornehag 2001
- Bornehag CG, Blomquist G, Gyntelberg F, Järvholm B, Malmberg P, Nordvall L, et al. Dampness in buildings and health. Nordic interdisciplinary review of the scientific evidence on associations between exposure to "dampness" in buildings and health effects (NORDDAMP). Indoor Air 2001;11(2):72‐86. [DOI] [PubMed] [Google Scholar]
Bornehag 2004
- Bornehag CG, Sundell J, Bonini S, Custovic A, Malmberg P, Skerfving S, et al. Dampness in buildings as a risk factor for health effects, EUROEXPO: a multidisciplinary review of the literature (1998‐2000) on dampness and mite exposure in buildings and health effects. Indoor Air 2004;14(4):243‐57. [DOI] [PubMed] [Google Scholar]
Burney 1989
- Burney PGJ, Laitinen LA, Perdrizet S, Huckauf H, Tattersfield AE, Chinn S, et al. Validity and repeatability of the IUATLD (1984) Bronchial Symptoms Questionnaire: an international comparison. European Respiratory Journal 1989;2:940‐5. [PubMed] [Google Scholar]
Downs 1998
- Downs SH, Black N. The feasibility of creating a checklist for the assessment of the methodological quality both of randomised and non‐randomised studies of health care interventions. Journal of Epidemiology and Community Health 1998;52:377‐84. [DOI] [PMC free article] [PubMed] [Google Scholar]
Ebbehøj 2002
- Ebbehøj N, Hansen M, Sigsgaard T, Larsen L. Building‐related symptoms and mold: two‐step intervention study. Indoor Air 2002;12:273‐7. [DOI] [PubMed] [Google Scholar]
Fisk 2007
- Fisk WJ, Lei‐Gomez Q, Mendell MJ. Meta‐analyses of the associations of respiratory health effects with dampness and mold in homes. Indoor Air 2007;17:284‐96. [DOI] [PubMed] [Google Scholar]
Haverinen‐Shaughnessy 2008
- Haverinen‐Shaughnessy U, Hyvärinen A, Putus T, Nevalainen A. Monitoring success of remediation: seven case studies of moisture and mold damaged buildings. Science of the Total Environment 2008;399:19‐27. [DOI] [PubMed] [Google Scholar]
Higgins 2011
- Higgins JPT, Green S (editors). Cochrane Handbook for Systematic Reviews of Interventions Version 5.1.0 [updated March 2011]. The Cochrane Collaboration, 2011. Available from www.cochrane‐handbook.org. Chichester, UK: John Wiley & Sons, Ltd.
Immonen 2002
- Immonen J. Immunologic and Pulmonary Reactivity in Schoolchildren from Moisture and Mould‐damaged School Buildings: a Three‐year Follow‐up Study. Kuopio, Finland: National Public Health Institute, 2002. [Google Scholar]
IoM 2004a
- Institute of Medicine. Human health effects associated with damp indoor environments. Damp Indoor Spaces and Health. Washington DC: National Academies Press, 2004:183‐269. [Google Scholar]
IoM 2004b
- Institute of Medicine. Damp buildings. Damp Indoor Spaces and Health. Washington DC: National Academies Press, 2004:29‐89. [PubMed] [Google Scholar]
Karjalainen 2007
- Karjalainen A (editor). Ammattitatudit 2007 (Statistics of Occupational Diseases). Helsinki: Finnish Institute of Occupational Health, 2007. [Google Scholar]
Koivisto 1996
- Koivisto J, Jääskeläinen E. Damages due to dampness in apartment buildings ‐ survey of prevalence and reparation costs [Asuinkerrostalojen kosteusvauriot ‐ yleisyyden ja korjauskustannusten selvittäminen]. Publications of the National Public Health Institute, Series B 9 1996.
Koskinen 1999a
- Koskinen OM, Husman TM, Meklin TM, Nevalainen AI. The relationship between moisture or mould observations in houses and the state of their occupants. European Respiratory Journal 1999;14:1363‐7. [PubMed] [Google Scholar]
Koskinen 1999b
- Koskinen O. Moisture, Mold and Health. Kuopio, Finland: National Public Health Institute, 1999. [Google Scholar]
Krieger 2010
- Krieger J, Jacobs DE, Ashley PJ, Baeder A, Chew GL, Dearborn D, et al. Housing interventions and control of asthma‐related indoor biologic agents: a review of the evidence. Journal of Public Health Management and Practice 2010;16(Suppl 5):11‐20. [DOI] [PMC free article] [PubMed] [Google Scholar]
Lacasse 2003
- Lacasse Y, Selman M, Costabel U, Dalphin JC, Morell M, Ando M, et al. Clinical diagnosis of active hypersensitivity pneumonitis. American Journal of Respiratory and Critical Care Medicine 2003;168:952–8. [DOI] [PubMed] [Google Scholar]
Lahtinen 2004
- Lahtinen M, Sundman‐Digert C, Reijula K. Psychosocial work environment and indoor air problems: a questionnaire as a means of problem diagnosis. Occupational and Environmental Medicine 2004;61:143‐9. [DOI] [PMC free article] [PubMed] [Google Scholar]
Lefebvre 2011
- Lefebvre C, Manheimer E, Glanville J. Chapter 6: Searching for studies. In: Higgins JPT, Green S (editors). Cochrane Handbook for Systematic Reviews of Interventions Version 5.1.0 [updated March 2011]. The Cochrane Collaboration, 2011. Available from www.cochrane‐handbook.org.
Meklin 2002
- Meklin T. Microbial exposure and health in schools ‐ effects of moisture damage and remediation. National Public Health Institute (academic dissertation). Kuopio University Printing Office: Kuopio 2002; Vol. A13.
Mendell 2011
- Mendell MJ, Mirer AG, Cheung K, Tong M, Douwes J. Respiratory and allergic health effects of dampness, mold and dampness‐related agents: a review of the epidemiologic evidence. Environmental Health Perspectives 2011;119(6):748‐56. [DOI] [PMC free article] [PubMed] [Google Scholar]
Nevalainen 1998
- Nevalainen A, Partanen P, Jääskeläinen E, Hyvärinen A, Koskinen O, Meklin T, et al. Prevalence of moisture problems in Finnish houses. Indoor Air 1998;Suppl 4:45‐89. [Google Scholar]
Partanen 1995
- Partanen P, Jääskeläinen E, Nevalainen A, Husman T, Hyvärinen A, Korhonen L, et al. Mould damages in small buildings ‐ survey of prevalence and reparation costs [Pientalojen kosteusvauriot ‐ yleisyyden ja korjauskustannusten selvittäminen]. Publications of National Public Health Institute, Series B 6 1995.
Patovirta 2004b
- Patovirta R‐L, Meklin T, Nevalainen A, Husman T. Effects of mould remediation on school teachers' health. International Journal of Environmental Health Research 2004;14:415‐27. [DOI] [PubMed] [Google Scholar]
Patovirta 2005
- Patovirta R‐L. Teachers' Health in Moisture‐damaged Schools ‐ a Follow‐up Study. Kuopio, Finland: National Public Health Institute, 2005. [Google Scholar]
Pellegrino 2005
- Pellegrino R, Viegi G, Brusasco V, Crapo RO, Burgos F, Casaburi R, et al. Interpretative strategies for lung function tests. Series ATS/ERS Task Force: Standardisation of lung function testing. European Respiratory Journal 2005;26:948‐68. [DOI] [PubMed] [Google Scholar]
RevMan 2014 [Computer program]
- The Nordic Cochrane Centre, The Cochrane Collaboration. Review Manager (RevMan). Version 5.3. Copenhagen: The Nordic Cochrane Centre, The Cochrane Collaboration, 2014.
Rudblad 2002
- Rudblad S, Andersson K, Stridh G, Bodin L, Juto J‐E. Slowly decreasing mucosal hyperreactivity years after working in a school with moisture problems. Indoor Air 2002;12:138‐44. [DOI] [PubMed] [Google Scholar]
Strachan 1988
- Strachan DP. Damp housing and childhood asthma: validation of reporting of symptoms. BMJ 1988;297:1223‐6. [DOI] [PMC free article] [PubMed] [Google Scholar]
Sudakin 1998
- Sudakin DL. Toxigenic fungi in a water‐damaged building: an intervention study. American Journal of Industrial Medicine 1998;34:183‐90. [DOI] [PubMed] [Google Scholar]
Taskinen 2001
- Taskinen T. Moisture and Mould Problems in School Buildings. Kuopio, Finland: National Public Health Institute, 2001. [Google Scholar]
Thomson 2001
- Thomson H, Petticrew M, Morrison D. Health effects of housing improvement: systematic review of intervention studies. BMJ 2001;323:187‐90. [DOI] [PMC free article] [PubMed] [Google Scholar]
Toren 1993
- Toren K, Brisman J, Jarvholm B. Asthma and asthma‐like symptoms in adults assessed by questionnaires. A literature review. Chest 1993;104:600‐8. [DOI] [PubMed] [Google Scholar]
Toren 2006
- Toren K, Palmqvist M, Lowhagen O, Balder B, Tunsater A. Self‐reported asthma was biased in relation to disease severity while reported year of asthma onset was accurate. Journal of Clinical Epidemiology 2006;59:90‐3. [DOI] [PubMed] [Google Scholar]
WHO 2009
- WHO. WHO guidelines for indoor air quality: dampness and mould. World Health Organization, 2009. [PubMed] [Google Scholar]
References to other published versions of this review
Sauni 2009
- Sauni R, Uitti J, Jauhiainen M, Kreiss K, Sigsgaard T, Verbeek JH. Remediating buildings damaged by dampness and mould for preventing respiratory tract symptoms, infections and asthma. Cochrane Database of Systematic Reviews 2009, Issue 3. [DOI: 10.1002/14651858.CD007897] [DOI] [Google Scholar]
Sauni 2011
- Sauni R, Uitti J, Jauhiainen M, Kreiss K, Sigsgaard T, Verbeek JH. Remediating buildings damaged by dampness and mould for preventing or reducing respiratory tract symptoms, infections and asthma. Cochrane Database of Systematic Reviews 2011, Issue 9. [DOI: 10.1002/14651858.CD007897.pub2] [DOI] [PubMed] [Google Scholar]