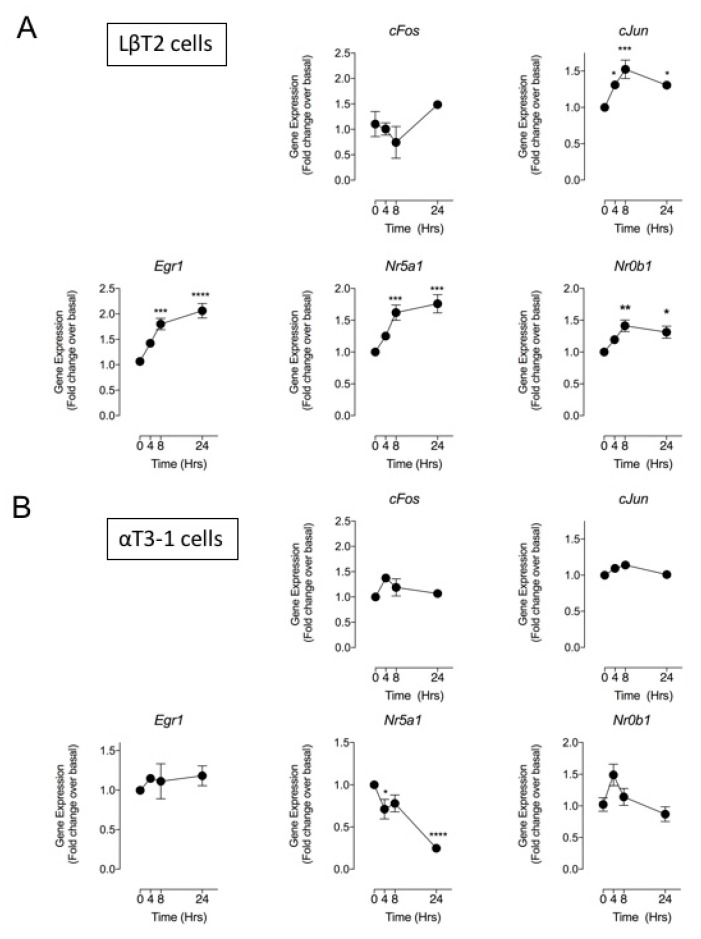
Figure 5.
Effect of CNP on gonadotrope transcription factor gene expression in LβT2 and αT3-1 cells. LβT2 (A) and αT3-1 (B) cells were stimulated with 0 or 100 nM CNP for 0, 4, 8, and 24 h, before extracting RNA and performing multiplex RT-qPCR for gonadotrope transcription factors. Data shown are means ± SEM (n = 6 individual RNA extractions) of relative gene expression (normalized to ActB); **** p < 0.0001, *** p < 0.001, ** p < 0.01, * p < 0.05, significantly different from basal (0 h).

