Figure 7.
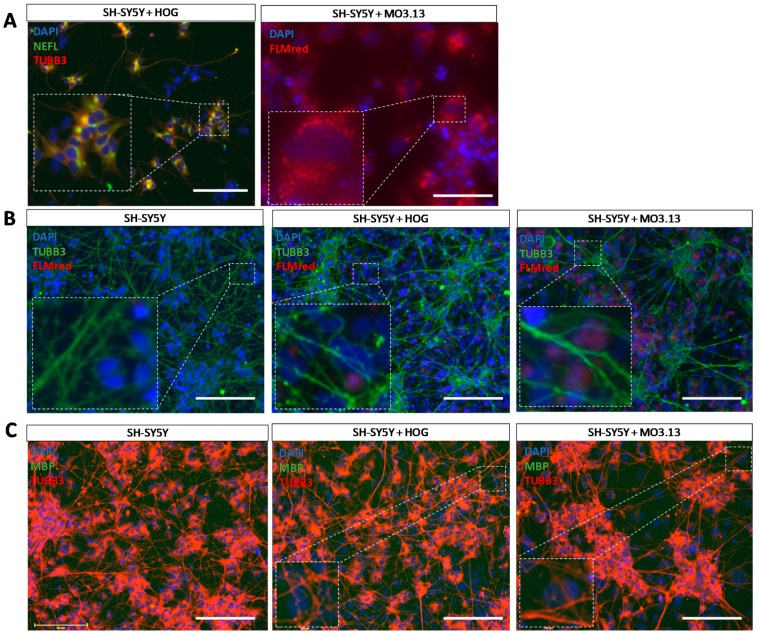
Immunocytochemical analysis of co-cultures of HOG or MO3.13 cells with differentiated neuronal SH-SY5Y cells. (A) Representative image of neuronal marker neurofilament light chain (NEFL) and TUBB3 stainings in SH-SY5Y + HOG co-culture and FluoroMyelin Red (FLMred) cytoplasmic lipid droplets in living SH-SY5Y + MO3.13 co-cultures. (B) Representative images of TUBB3- and FLMred signals in fixed SH-SY5Y monoculture, and SH-SY5Y + HOG co-culture and SH-SY5Y + MO3.13 co-culture. These images serve as examples for the absence of FLMred overlap with the extensive neurite outgrowth (TUBB3) in our cultures. (C) Representative images of the absence of MBP-signals (polyclonal antibody) and the presence of TUBB3-signals in SH-SY5Y monocultures, and SH-SY5Y + HOG and SH-SY5Y + MO3.13 co-cultures. Scale bar = 50 µm.

