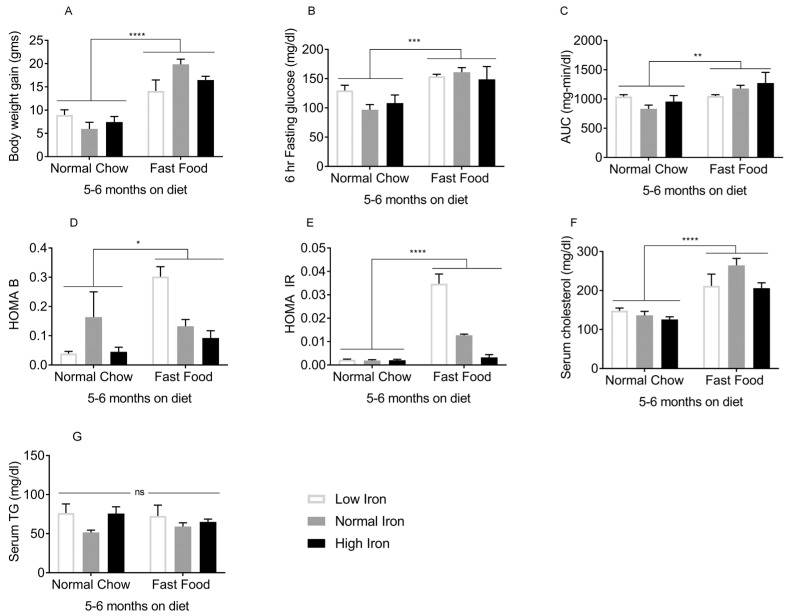
Figure 2.
Metabolic phenotypes after 5–6 months on diet: The following were measured in mice on the FF/NC diets for 5–6 months (n = 8–10 per group). (A) Body weight. (B) Blood glucose after 6h fasting. (C) Glucose tolerance (area under the glucose curve [AUC] after intra-peritoneal glucose tolerance testing). (D) Homeostasis model assessment of β-cell function (HOMA B). (E) Homeostasis model assessment of insulin resistance (HOMA IR). (F) Serum cholesterol and (G) Fasting serum triglycerides (TG). Shown are means ± SE. p values were calculated by two-way ANOVA with post hoc Tukey’s multiple comparisons test. * 0.01 ≤ p ≤ 0.05; ** 0.001 ≤ p ≤ 0.01; *** 0.0001 ≤ p ≤ 0.001; **** p < 0.0001. ns: not significant.

