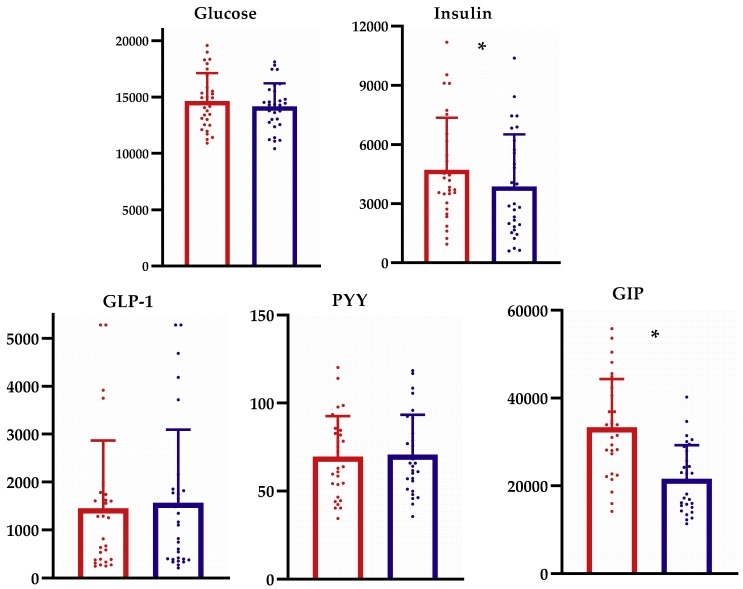
Figure 3.
Comparison of the area under the curve (AUC0–120 min) biomarker response between boiled and chilled potato intake. * p < 0.05 between groups using non-parametric Wilcoxon Signed Ranks Test. Red color refers to the AUC(0–120 min) for the boiled potato; blue color refers to the AUC(0–120 min) for the chilled potato. GLP-1, glucagon-like peptide-1; PYY, peptide YY; GIP, glucose-dependent insulinotropic-peptide.

