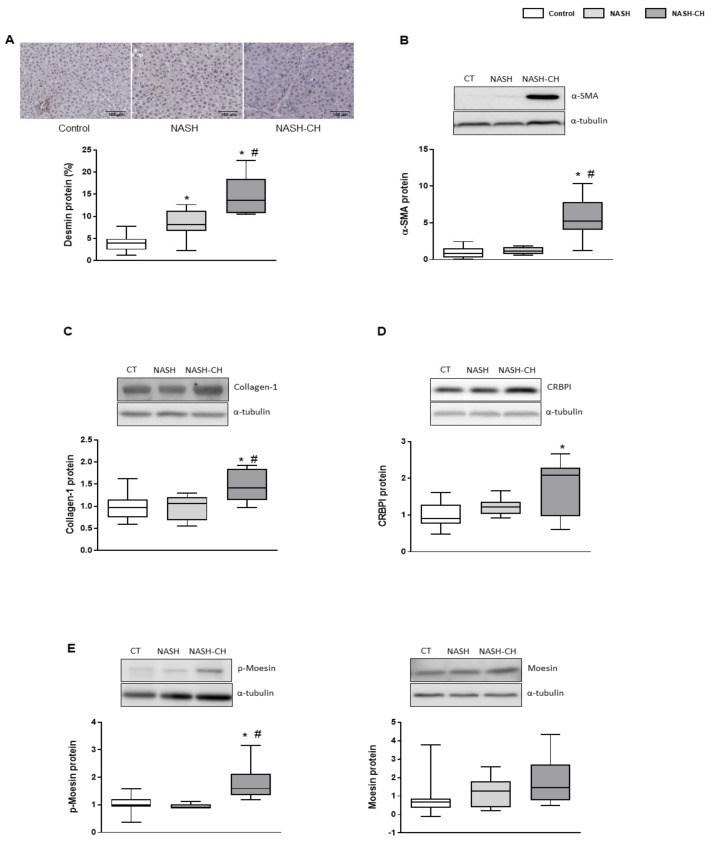
Figure 4.
HSC phenotype in control and NASH rats. (A) Representative images of desmin immunohistochemistry in liver tissue and its quantification. (B) α-SMA protein expression in total liver tissue, normalized to α-tubulin, and corresponding quantification. (C) Collagen-1α1 protein expression in total liver tissue, normalized to α-tubulin. (D) CRBP1 protein expression in total liver tissue, normalized to α-tubulin. (E) p-moesin and moesin protein expression in total liver tissue, normalized to α-tubulin. Results represent mean ± SEM, * p < 0.05 vs. control group, # p < 0.05 vs. NASH group (n = 6 rats per group). All images scale bar = 100 μm.

