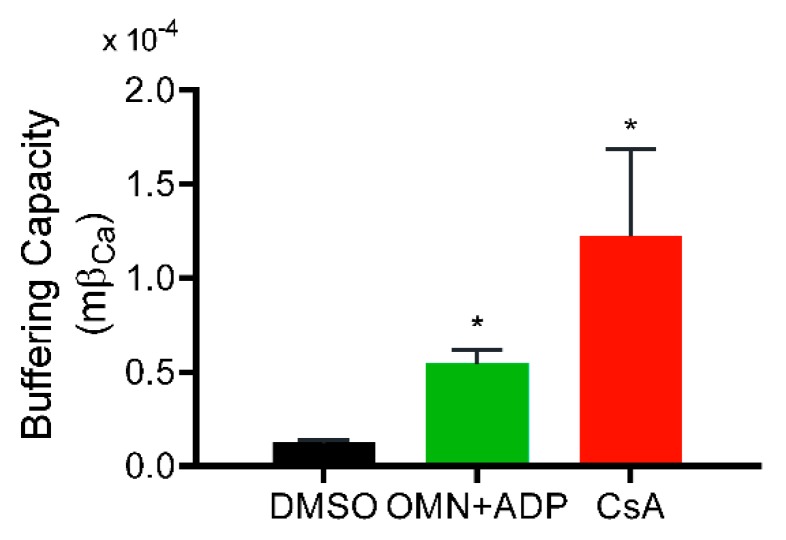
Figure 4.
Effect of CsA and AdN on mitochondrial Ca2+ buffering capacity. Mitochondrial Ca2+ buffering capacity calculated from trend fits of [Ca2+]e and [Ca2+]m for DMSO-(control), CsA-, and OMN+ADP-treated mitochondria as described by Equations (2)–(4) in Materials and Methods. Buffering capacity for each treatment was calculated from three-five experiments each for [Ca2+]e and [Ca2+]m and averaged. Error bars represent mean ± SEM (* p < 0.01 compared with DMSO).

