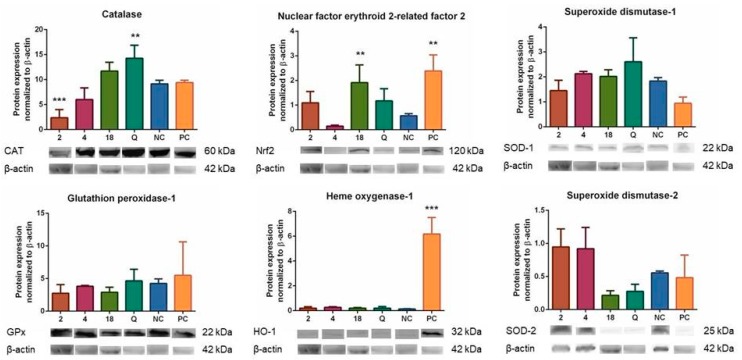
Figure 6.
Effects of compounds 2, 4, and 18 (at a concentration of 2 µM) on the levels of selected antioxidant enzymes CAT, GPx, HO-1, and SOD-1 and -2, and on the expression of Nrf2 after 6 h of incubation. The THP-1-XBlue-CD14-MD2 cell model was used with quercetin as the standard (2 μM), pyocyanin alone (100 µM) as the positive control (PC), and the vehicle alone as the negative control (NC). ** = p < 0.01; *** = p < 0.001; and **** = p < 0.0001.

