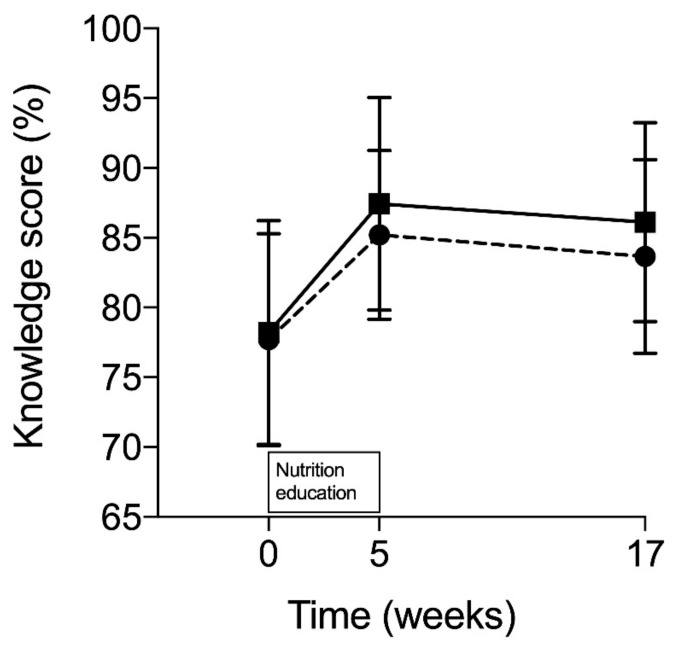
Figure 3.
Mean nutrition knowledge scores with SD at baseline, after nutrition education and after follow-up. Black line with squares refers to the EDU + APP group (education sessions + the use of mobile food app) and dotted line with circles to the EDU group (education sessions only). p = 0.309 for group × time interaction, p < 0.001 for main effect of time, and p = 0.309 for main effect of group.

