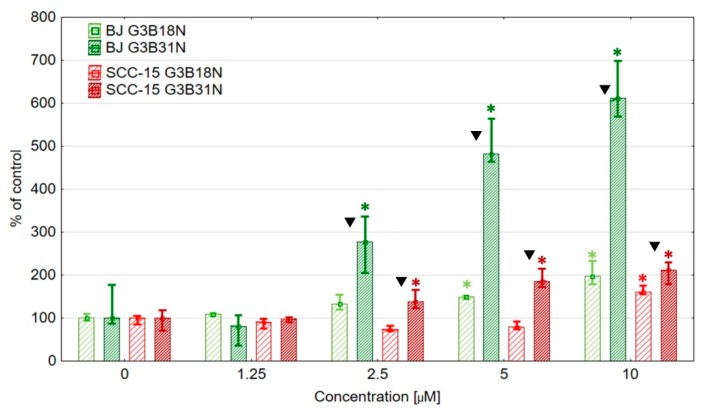
Figure 5.
Activity of executive 3/7 caspases after 24 h treatment of BJ and SCC-15 cells with G3B18N and G3B31N conjugates, expressed as a percentage of control. Squares show medians, and whiskers are lower and upper quartile. * p < 0.05 significant difference against control (Kruskal-Wallis test). Triangles show significant differences between conjugates for the same cell lines (Mann Whitney U test, p < 0.05).

