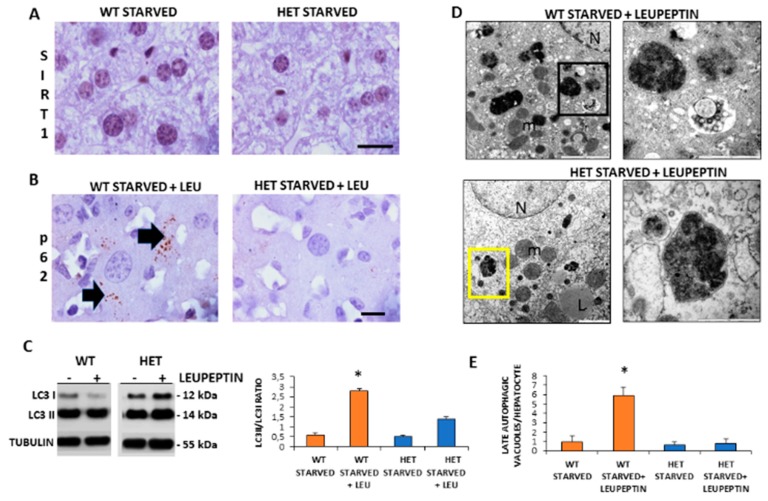
Figure 4.
Autophagic flux is sustained in wild type (WT) but inconsistent in SIRT1 heterozygous (HET) mice liver during starvation. (A) Representative Sirtuin 1 protein staining in WT and HET mice. (B) Representative pictures of P62 protein dot staining (arrow) in starved mice plus leupeptin. (C) LC3I and LC3II expressions by Western blotting and relative quantification. (D) Representative transmission electron microscopic images of the liver in starved WT and HET mice injected with leupeptin, a lysosomal inhibitor. Black square, late autophagosome. Yellow square: lysosomes; m: mitochondria; N: nucleus; L: lipid droplet. (E) Quantification of late autophagosomes in the hepatocytes. Scale bars in immunohistochemistry represent 10 µm. Values are mean ± SEM. * p < 0.05 vs. WT starved.

