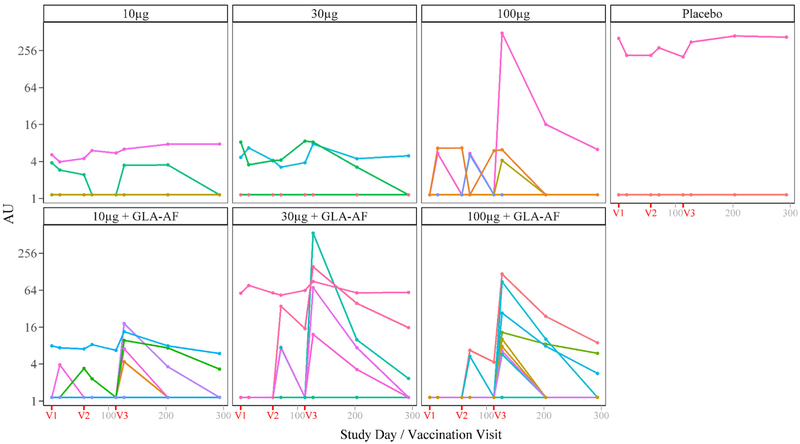
Fig. 5.
Individual Time Trends of ELISA IgG Antibody Levels by Treatment Group, Per Protocol. Population. NOTE: V1, V2, and V3 indicate the scheduled days for vaccinations 1,2, and 3, respectively (days 1,57, and 113). Of 61 volunteers in the PP population, antibody levels for 25 vaccinated and 9 control volunteers were undetectable for all time points.

