Abstract
Background: The aggressiveness of pancreatic ductal adenocarcinoma (PDAC) is enhanced by its interactions with stromal extracellular matrix, notably with hyaluronan (HA). Our previous studies have demonstrated increased expression of genes involved in HA synthesis and degradation in PDAC, suggesting the presence of an autocrine mechanism which accelerates the production of low-molecular-weight HA.
Results: A subset of PDAC (20% of cell lines and 25% of tissues) showed overexpression of multiple genes encoding both HA-synthesizing and HA-degrading enzymes, displaying a phenotype defined as an HA activated-metabolism phenotype (HAMP). Interestingly, HAMP+ cells were more susceptible to the treatment with an HA synthesis inhibitor and HA degradation inhibitor than HAMP- cells. Patients with HAMP+ tumors were significantly associated with shorter survival than those with HAMP- tumors (P = 0.049).
Methods: We investigated transcriptional profiling of genes involved in HA synthesis (including HAS2 and HAS3) and degradation (including HYAL1 and KIAA1199) in a panel of PDAC cell lines and primary tissues. Response of PDAC cells to treatment with an HA synthesis inhibitor (4-methylumbelliferone) or HA degradation inhibitor (dextran sulfate) was examined by cell migration assay. Survival was determined by Kaplan–Meier curve and compared by log-rank test.
Conclusions: The present study identified a novel phenotype, HAMP, characterized by activation of HA metabolism pathways, in PDAC. HAMP should be further investigated as a prognostic marker as well as a target for personalized medicine.
Keywords: hyaluronan, synthesis, degradation, pancreatic cancer, prognosis
INTRODUCTION
Pancreatic ductal adenocarcinoma (PDAC) is one of the most aggressive and lethal cancers worldwide, currently ranking the fourth leading cause of cancer death in Western countries and Japan. In general, PDAC exhibits poor response to chemotherapy or immunotherapy; therefore, the identification of more effective therapy is urgently needed [1]. Recently, personalized medicine (also known as precision medicine) has attracted much interest in the field of cancer therapy. However, there have been only a few targetable molecules/pathways and their corresponding drugs identified in PDAC [2].
Progression of cancer depends largely on tumor microenvironment composed of extracellular matrix (ECM), such as collagen, fibronectin, laminin, and hyaluronan (HA). These ECM components, along with a variety of stromal cells, orchestrate a host stromal response that ultimately supports invasive and metastatic processes of cancer cells [3]. PDAC is characterized by a dense desmoplastic stroma containing a large amount of ECM. Among the ECM components, HA has been shown to abundantly accumulate in PDAC and provide a favorable environment for tumor progression [4–6]. We demonstrated that HA is strongly expressed in primary PDAC tissues, with a staining being detected both in tumor and stromal components [5]. Importantly, strong HA expression was an independent prognostic factor in patients with PDAC undergoing resection [5].
HA is a large polymer, of a molecular weight of ranging from 105 to 107 Da in its naïve form, composed of two monosaccharides, glucuronic acid and N-acetyl-glucosamine [7]. HA is synthesized by hyaluronan synthases localized in the plasma membrane (including HAS1, HAS2, and HAS3) and extruded into the extracellular space [8]. The extracellular HA is incorporated into the cells and degraded into smaller fragments by enzymes including hyaluronidases (such as HYAL1 and HYAL2) [7, 9] and KIAA1199/CEMIP/HYBID [10]. HA is involved in many signaling pathways to regulate a wide variety of cellular processes, including cell adhesion, migration, and proliferation by interacting with specific cell surface receptors [11]. In particular, low-molecular-weight HA, produced upon degradation, is strongly associated with malignant phenotype of various cancers [12–14], suggesting the important role of abnormal HA metabolism in cancer progression.
In many cancer types, two major processes of HA metabolism (synthesis and degradation) have been reported to be activated [15, 16]. Our previous studies have shown increased expression of HAS2, HYAL1, and KIAA1199 in PDAC [5, 17, 18]. Furthermore, we have shown that HA, especially low-molecular-weight HA, promotes migratory ability of PDAC cells [14]. These findings led us to hypothesize the existence of an HA activated-metabolism phenotype (HAMP) in which a series of HA metabolism processes are activated to consequently accelerate the production of low-molecular-weight HA.
The aim of the present study was to identify HAMP in PDAC by expression profiling of multiple genes involved in HA metabolism. We also determined the clinical implications of HAMP as a therapeutic target and prognostic marker.
RESULTS
Identification of HAMP in PDAC cell lines
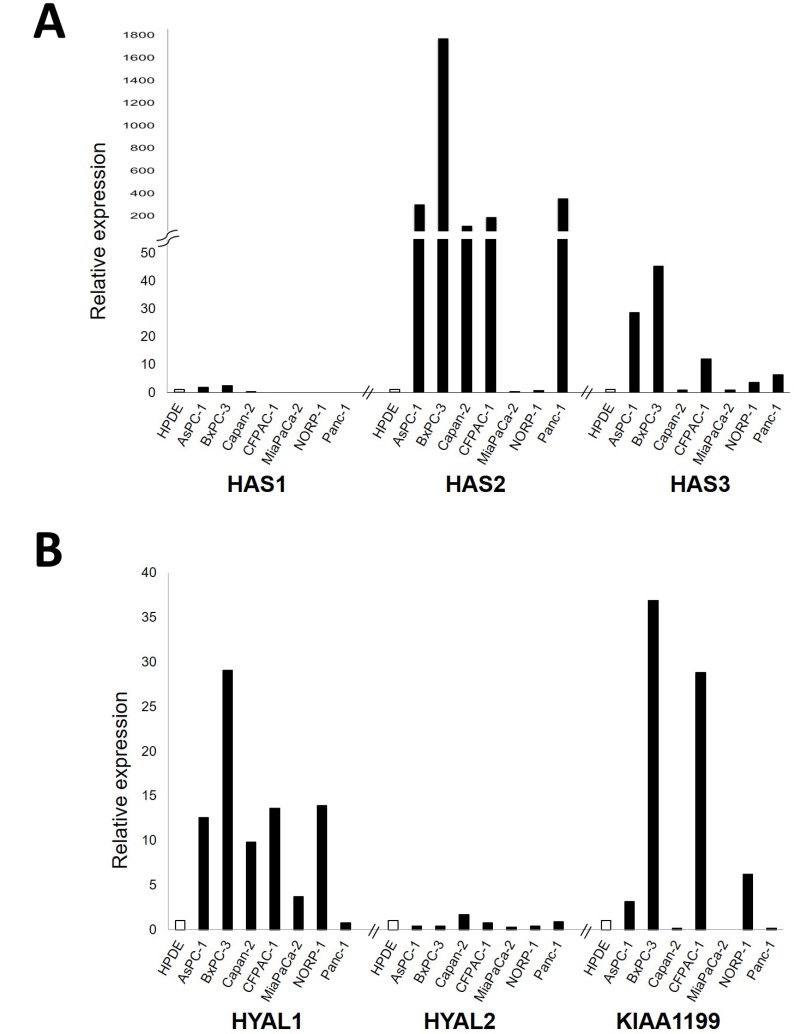
In an attempt to identify genes related to HA metabolism that are highly expressed in PDAC, we first examined mRNA expression levels of major genes responsible for HA synthesis (HAS1, HAS2 and HAS3) and degradation (HYAL1, HYAL2, and KIAA1199) in a panel of 7 PDAC cell lines. Of the HA synthesizing enzyme genes, HAS2 and HAS3 were overexpressed in a subset of PDAC cell lines as compare to the control cell line HPDE (Figure 1A). Of the HA degrading enzyme genes, HYAL1 and KIAA1199 were highly expressed in a subset of PDAC cell lines (Figure 1B).
Figure 1.
Relative mRNA expression levels of major genes responsible for HA synthesis, including HAS1, HAS2, and HAS3 (A) and those for HA degradation, including HYAL1, HYAL2, and KIAA1199 (B) in a panel of 7 PDAC cell lines. Each value was defined when the expression level in HPDE (as a control) was set to 1.
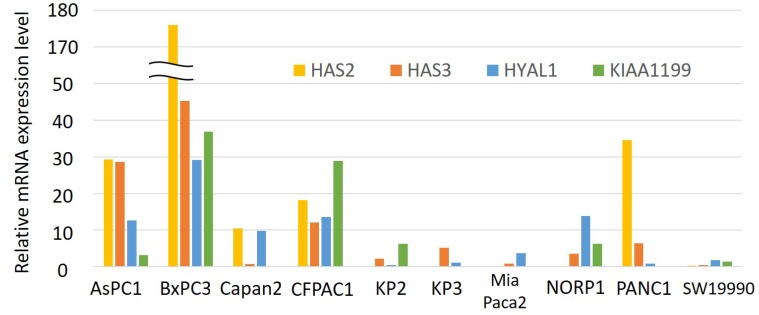
We therefore investigated the expression profiling of these four genes (HAS2, HAS3, HYAL1, and KIAA1199) in a panel of 10 PDAC cell lines (Figure 2). When we looked at expression of these four genes in each cell line, it seems that some cell lines show increased expression of multiple genes whereas others show low expression of them.
Figure 2. Relative mRNA expression levels of HAS2, HAS3, HYAL1, and KIAA1199 in a panel of 10 PDAC cell lines.
Each value was defined when the expression level in HPDE (as a control) was set to 1. Only HAS2 expression was divided by 10.
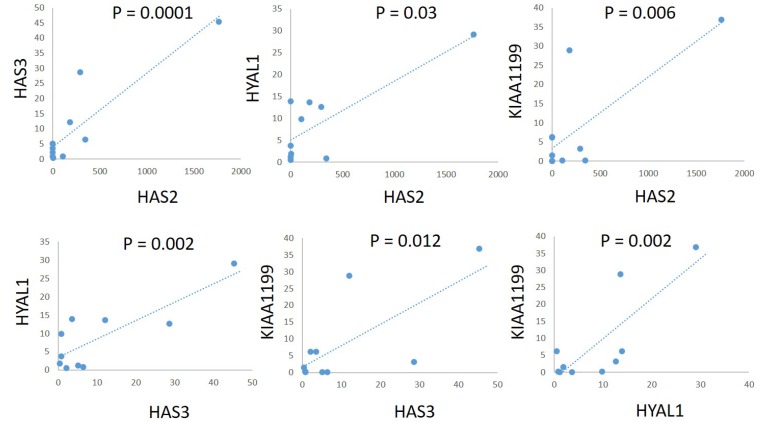
To explore the correlation between expression of these genes among cell lines, we used Spearman’s rank correlation coefficient to examine the expression levels of two of these genes. There was a significant positive correlation between HAS2 and HAS3 (r = 0.891, P = 0.0001), HAS2 and HYAL1 (r = 0.803, P = 0.003), HAS2 and KIAA1199 (r = 0.762, P = 0.006), HAS3 and HYAL1 (r = 0.83, P = 0.002), HAS3 and KIAA1199 (r = 0.723, P = 0.012), and HYAL1 and KIAA1199 (r = 0.812, P = 0.002) (Figure 3).
Figure 3. Correlations of mRNA expression levels of HAS2, HAS3, HYAL1, and KIAA1199 in a panel of PDAC cell lines.
There was a significant positive correlation between HAS2 and HAS3 (r = 0.891, P = 0.0001), HAS2 and HYAL1 (r = 0.803, P = 0.003), HAS2 and KIAA1199 (r = 0.762, P = 0.006), HAS3 and HYAL1 (r = 0.83, P = 0.002), HAS3 and KIAA1199 (r = 0.723, P = 0.012), and HYAL1 and KIAA1199 (r = 0.812, P = 0.002).
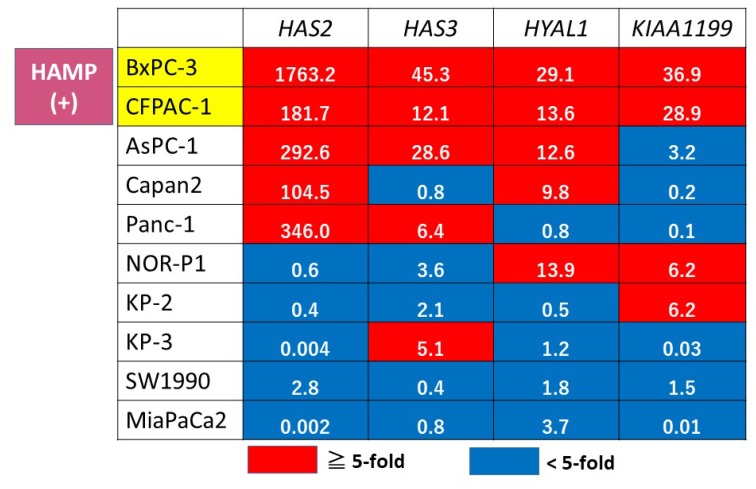
We then classified the expression pattern of these genes into overexpression (defined as > 5-fold relative to the expression of HPDE) or non-overexpression (< 5-fold) in all PDAC cell lines (Figure 4). This expression profiling identified two cell lines (BxPC3 and CFPAC1) displaying overexpression of all of the four genes tested, which were defined as HAMP.
Figure 4. Gene expression profiling of HA metabolism genes in PDAC cell lines.
A red box indicates overexpression (> 5-fold relative to HPDE), and blue indicates non-overexpression (< 5-fold). The actual fold change is given in each box. HAMP+ was defined when all of the 4 tested genes were overexpressed.
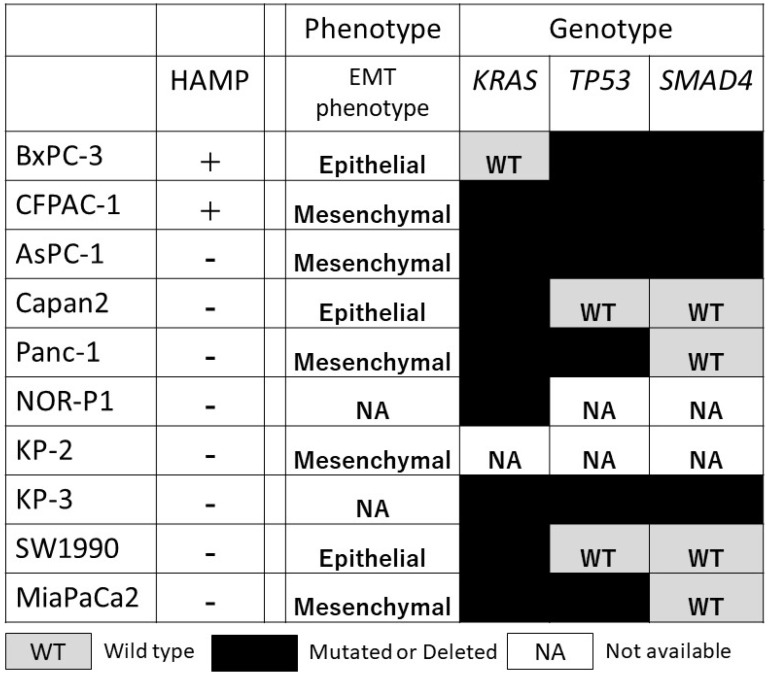
HAMP was not associated with known phenotype (epithelial mesenchymal transition phenotype) and genotype (KRAS, TP53, and SMAD4 alterations), possibly representing an independent phenotype (Figure 5).
Figure 5. Correlation between HAMP and other known phenotype (epithelial/mesenchymal phenotype) and genotype (genetic alterations in the KRAS, TP53, and SMAD4) in a panel of 10 PDAC cell lines.
WT, wild type; black box, mutated or deleted; NA, information not available.
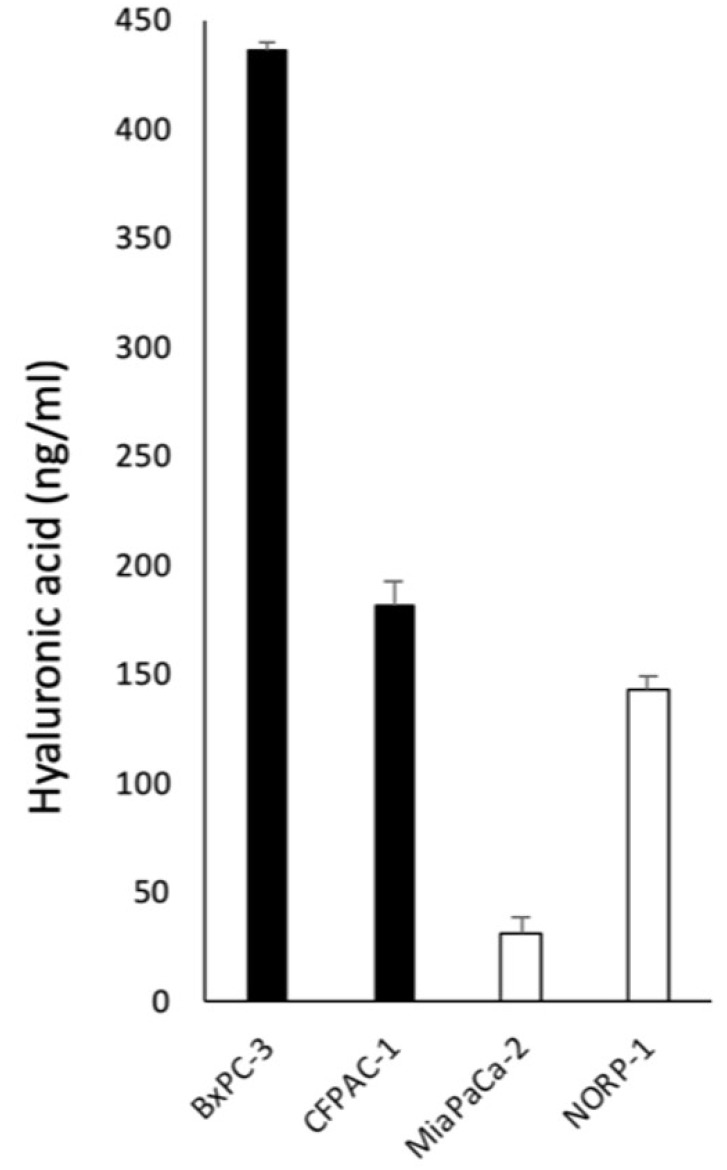
To confirm the increased HA metabolism in HAMP at protein level, we examined HA concentration in conditioned media from HAMP+ cell lines (BxPC3 and CFPAC1) and HAMP- cell lines (MiaPaCa2 and NOR-P1). The HA concentration appeared higher in HAMP+ cell lines than HAMP- cell lines (Figure 6).
Figure 6. Concentrations of HA in conditioned media from HAMP + cell lines (BxPC3 and CFPAC1) and HAMP- cell lines (MiaPaCa2 and NOR-P1).
The HA concentration appeared higher in HAMP+ cell lines than HAMP− cell lines.
Different responses to inhibitors of HA synthesis and hyaluronidase by different HAMP status
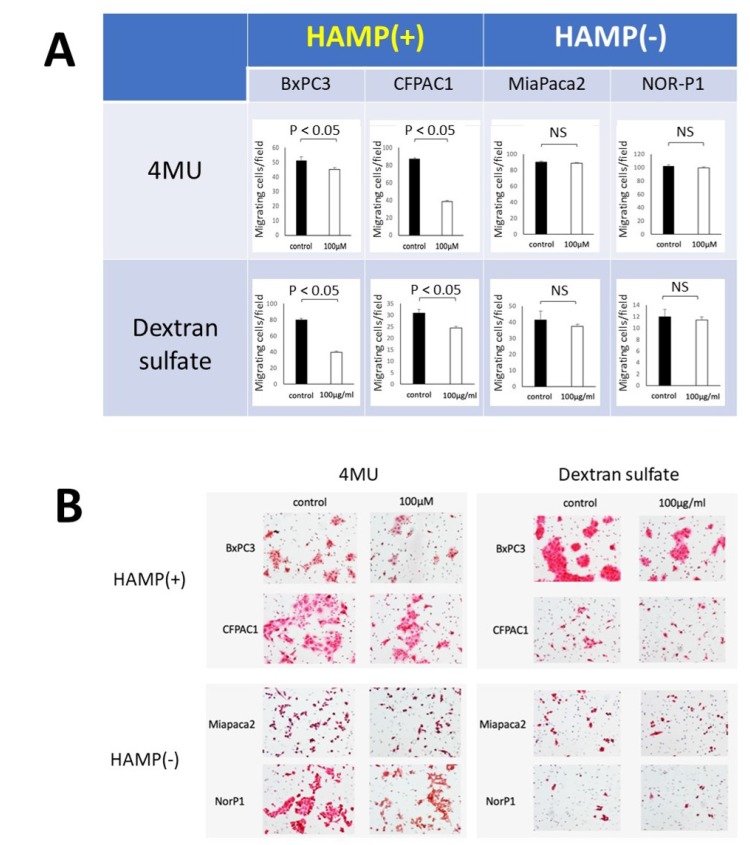
Previous studies have shown that treatment with HA synthesis inhibitor (4-MU) and hyaluronidase inhibitor (dextran sulfate) resulted in decreased HA production and migratory ability in some PDAC cell lines [14, 18]. We hypothesized that HAMP+ cells are more susceptible to inhibitors of HA synthesis or degradation than HAMP- cells. To test this hypothesis, we compared the responses to these treatments between two HAMP+ cell lines (BxPC3 and CFPAC1) and two HAMP- cell lines (MiaPaCa2 and NOR-P1). Treatment with 4-MU (100 μM) resulted in a significant decrease in the number of migrating cells in the HAMP+ cell lines but not in the HAMP- cell lines (Figure 7). Similarly, treatment with dextran sulfate (100 mg/ml) resulted in a significant decrease in the number of migrating cells in the HAMP+ cell lines but not in the HAMP- cell lines (Figure 7).
Figure 7. Responses of PDAC cell lines with different HAMP status to inhibitors of HA synthesis (4-MU) or degradation (dextran sulfate).
Migrating cells were determined after treatment with 4-MU (100 μM) or dextran sulfate (100 mg/ml) in a transwell assay. (A) The number of migrating cells per field after treatment, showing a significant decrease only in two HAMP+ cell lines. (B) Representative pictures of migrating cells.
Prognostic implication of HAMP in PDAC patients
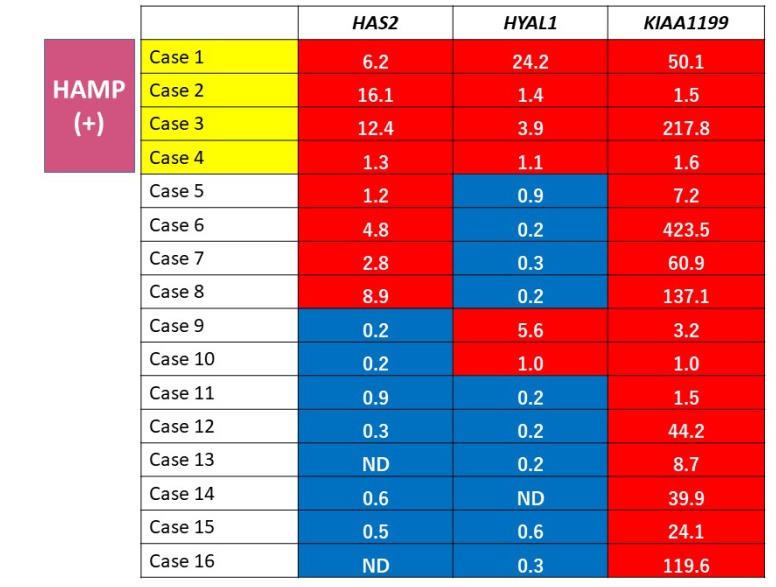
To explore prognostic relevance of HAMP in PDAC patients, we investigated expression profiling of HAS2, HYAL1, and KIAA1199 mRNA in PDAC tissues obtained from 16 patients (7 male and 9 female patients with the average age of 66.7 years) who underwent pancreatectomy (Table 1). Increased expression was defined when the expression level was higher in tumor than in the corresponding non-tumor tissue. Expression profiling identified four cases (25%) showing increased expression of all of the genes tested, which were defied as HAMP+ (Figure 8). There were no significant differences in patient’s backgrounds and clinicopathological variables, including age, sex, serum CEA and CA19-9 level, UICC stage, histological grade (well, moderately, poorly differentiated), lymphatic/vessel/neural invasion, residual tumor, and adjuvant chemotherapy between patients with HAMP+ and those with HAMP- (Table 1).
Table 1. Clinicopathological characteristics of 16 PDAC patients with and without HAMP+.
| Variable | HAMP+ (n = 4) | HAMP− (n = 12) | Total (n = 16) | P | |
|---|---|---|---|---|---|
| Age (years) | 58.3 (46–70) | 69.5 (33–81) | 66.7 (33–81) | 0.674 | |
| Gender | M | 3 | 4 | 7 | 0.146 |
| F | 1 | 8 | 9 | ||
| serum CEA (ng/mL) | 5.75 (2.8–8.4) | 5.79 (1–13.6) | 5.78 (1–13.6) | 0.983 | |
| serum CA19.9 (U/mL) | 115.8 (15.4–328.3) | 156.5 (0.8–989.4) | 146.3 (0.8–989.4) | 0.712 | |
| UICC-T | 0.485 | ||||
| pT1 | 0 | 2 | 2 | ||
| pT2 | 1 | 2 | 3 | ||
| pT3 | 3 | 5 | 8 | ||
| pT4 | 0 | 3 | 3 | ||
| UICC-N | 0.728 | ||||
| pN0 | 1 | 3 | 4 | ||
| pN1 | 3 | 9 | 12 | ||
| UICC-M | NA | ||||
| pM0 | 4 | 12 | 16 | ||
| pM1 | 0 | 0 | 0 | ||
| UICC-Stage | 0.545 | ||||
| IA | 0 | 1 | 1 | ||
| IB | 1 | 1 | 2 | ||
| IIA | 0 | 0 | 0 | ||
| IIB | 3 | 7 | 10 | ||
| III | 0 | 3 | 3 | ||
| IV | 0 | 0 | 0 | ||
| Histological grade | 0.62 | ||||
| Well | 4 | 8 | 12 | ||
| Mod | 0 | 1 | 1 | ||
| Poor | 0 | 2 | 2 | ||
| Mucinous | 0 | 1 | 1 | ||
| Lymphatic invasion | 0.62 | ||||
| + | 0 | 2 | 2 | ||
| − | 4 | 10 | 14 | ||
| Vessel invasion | 0.182 | ||||
| + | 0 | 4 | 4 | ||
| − | 4 | 8 | 12 | ||
| Neural invasion | 0.712 | ||||
| + | 1 | 2 | 3 | ||
| − | 3 | 10 | 13 | ||
| Residual tumor | 0.18 | ||||
| R0 | 3 | 11 | 14 | ||
| R1 | 1 | 0 | 1 | ||
| R2 | 0 | 1 | 1 | ||
| Adjuvant chemotherapy | 0.712 | ||||
| + | 1 | 2 | 3 | ||
| − | 3 | 10 | 13 |
Figure 8. Gene expression profiling of HA metabolism genes in PDAC tissues.
A red box indicates increased expression (tumor/non-tumor > 1) and blue box indicates non-increased expression (tumor/non-tumor < 1). The actual fold change is given in each box. HAMP+ was defined when expressions of all of the 3 tested genes were increased.
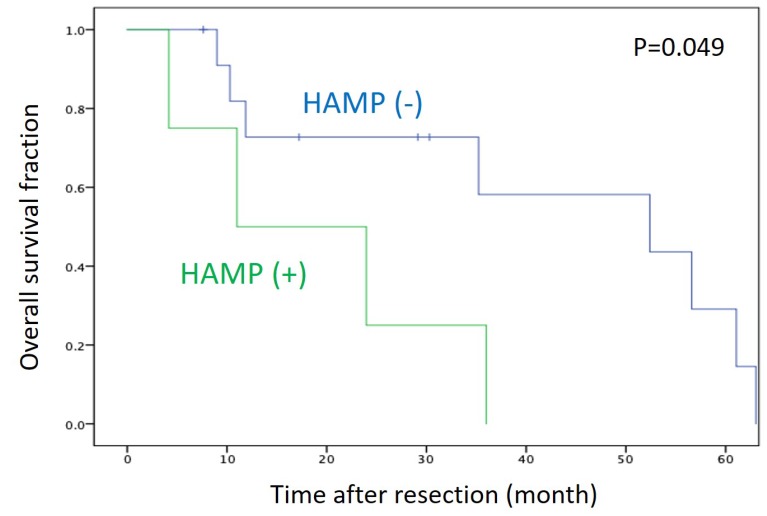
We then compared survival between patients with HAMP+ and those with HAMP-. The overall survival was significantly shorter in patients with HAMP+ than in those with HAMP− (P = 0.049) (Figure 9).
Figure 9. Kaplan–Meier survival curve of patients with PDAC after surgical resection.
Survival of patients with HAMP+ tumors was significantly shorter those with HAMP− tumors (P = 0.049 by log-rank test).
Using Cox proportional hazard model, we investigated factors associated with prognosis in 16 patients with PDAC (Table 2). Univariate analysis identified HAMP+ as one of the factors predicting poor prognosis (hazard ratio, 3.69), though the association was not statistically significant (P = 0.066).
Table 2. Univariate analysis of factors predicting poor prognosis in patients with PDAC.
| Univariate analysis | ||||
|---|---|---|---|---|
| HR | 95%CI | p | ||
| Age (>65/≤65) | 0.712 | 0.166 | 3.06 | 0.648 |
| Gender (M/F) | 0.954 | 0.286 | 3.182 | 0.939 |
| CEA | 1.398 | 0.42 | 4.647 | 0.585 |
| CA19-9 | 0.259 | 0.841 | 0.056 | 1.189 |
| UICC Stage (III, IV / I, II) | 0.883 | 0.106 | 7.369 | 0.909 |
| Histological grade (poor/others) | 0.933 | 0.194 | 4.498 | 0.932 |
| Lymphatic invasion (+/-) | 2.619 | 0.315 | 21.742 | 0.373 |
| Vessel invasion (+/-) | 2.402 | 0.51 | 11.319 | 0.268 |
| Neural invasion (+/-) | 2.222 | 0.467 | 10.565 | 0.316 |
| Residual tumor (+/-) | 2.558 | 0.283 | 23.091 | 0.403 |
| Adjuvant chemotherapy (+/-) | 0.827 | 0.096 | 7.156 | 0.863 |
| HAMP (+/-) | 3.693 | 0.919 | 14.842 | 0.066 |
DISCUSSION
In the present study, we investigated expression profiling of genes involved in HA metabolism in a panel of PDAC cell lines and tissues. The following findings were obtained. First, expression profiling identified HAMP in a subset of PDAC cell lines and tissues. Second, HAMP+ cell lines were more susceptible to treatment with inhibitors of HA synthesis (4-MU) or degradation (dextran sulfate). Third, survival of PDAC patients with HAMP+ tumors was significantly shorter than those with HAMP- tumors. These findings suggest the presence of a novel phenotype associated with activated HA metabolism pathways and poor prognosis in PDAC.
Global genomic analyses using microarrays revealed that PDAC is characterized by frequent genetic alterations in a core set of 12 cellular signaling pathways and processes [19]. These included KRAS signaling, TGFβ signaling, JNK signaling, integrin signaling, Wnt/Notch signaling, Hedgehog signaling, control of G1-S phase transition, apoptosis, DNA damage control, small GTPase control, invasion, and hemophilic cell adhesion [19]. We demonstrate that, in addition to these pathways, HA metabolism pathway is also deregulated in PDAC. Thus, multiple signaling pathways are genetically or epigenetically altered in PDAC, which may explain its aggressive biological and clinical features.
In the present study, we demonstrated a significant positive correlation between mRNA expressions of HAS2, HAS3, HYAL1, and KIAA1199. These genes are located at different chromosomal loci, and transcriptions of these genes are independently regulated by different mechanisms. In fact, HAS2 gene was localized to the chromosome 8q24.12, while HAS3 gene was localized to the chromosome16q22.1 [8]. HYAL1 gene was localized to the chromosome 3p21.3 [20], while KIAA1199 gene was localized to the 15q25.1 [21]. Therefore, the mechanism by which transcription levels of these independent genes are simultaneously elevated is unknown. One possible mechanism is abundance of transcription factor(s) shared by these genes. For example, HAS2 and HAS3 have binding sites for Sp1, a transcription factor known to be overexpressed in a subset of PDAC [22], in their promoter regions [23, 24]. Another possible mechanism is aberrant hypomethylation, which has been associated with overexpression of multiple genes in PDAC [25]. In support for this idea, our previous study have shown that transcriptional expressions of HAS2 and HAS3 are regulated by DNA methylation in PDAC cells [26]. Finally, it is also possible that gene amplification is a mechanism underlying the overexpression of these genes. For example, frequent amplification (copy number gains) of the chromosomal loci harboring the HAS2 gene (8q24) has been reported in PDAC [27].
In the present study, expression profiling of HAS2, HYAL1, and KIAA1199 identified HAMP+ in 25% of PDAC patients who underwent surgery. Survival analysis revealed that patients with HAMP+ tumors showed shorter survival time than those with HAMP- tumors, though the number of patients was limited. Further studies in a larger number of patients are definitely needed to confirm the prognostic significance of HAMP in PDAC.
The present study suggests a possible personalized treatment strategy selectively for HAMP+ PDAC. First, inhibition of HA synthesis may be an ideal and straightforward treatment strategy [28]. One agent that has received increasing attention is 4-MU, which inhibits HA synthesis by acting as a competitive substrate for UDP-glucuronosyltransferase (UGT) and by downregulating HAS2 and HAS3 [29, 30]. Notably, 4-MU, also known as hymecromone, is already used in several countries as a drug to improve liver function or to treat biliary spasm without any serious side effects [31]. Previous studies have shown that 4-MU and its derivatives inhibit the growth and metastasis of PDAC in vitro and in vivo [32, 33]. Our present study showed that HAMP+ cell lines were more susceptible to 4-MU than HAMP− cell lines. Therefore, this drug should be tested selectively for PDAC patients with HAMP+ tumors in the future.
Inhibitors of HA degradation (hyaluronidase) may represent another treatment option against HAMP+ PDAC. One of the hyaluronidase inhibitors is glycyrrhizin, also known as glycyrrhizic acid, which has been shown to display anticancer properties [34]. Glycyrrhizin has also been used as a drug delivery carrier for cancer therapy [35]. We also showed that a novel hyaluronidase inhibitor, Hyaluromycin, inhibits proliferation and migration of PDAC cells [36]. These promising agents should be tested for the selective treatment of HAMP+ PDAC in preclinical and clinical studies.
In conclusion, we identified a novel phenotype, HAMP, associated with activated HA metabolism pathways in PDAC. This phenotype should be further investigated as a prognostic marker as well as a target for personalized medicine.
MATERIALS AND METHODS
Cell lines and reagents
We used 10 PDAC cell lines, AsPC-1, BxPC-3, Capan-2, CFPAC-1, MIAPaCa-2, PANC-1, SW1990 (American Type Culture Collection, Manassas, VA, USA), KP-2, KP-3 (JCRB Cell Bank, Osaka, Japan), and NORP-1 (RIKEN BRC Cell Bank, Tsukuba, Ibaraki, Japan). An immortalized cell line derived from human pancreatic duct, HPDE, was a kind gift from Dr. M.S. Tsao (Dept. of Pathology, Univ. of Toronto, Canada). PDAC cell lines were maintained in RPMI1640 medium (Life Technologies, Grand Island, NY, USA) supplemented with 10% fetal bovine serum (FBS) (Life Technologies) and 1% streptomycin and penicillin (Life Technologies). HPDE was maintained in HuMedia-KG2 (KURABO, Osaka, Japan), in a 5% CO2 incubator at 37° C. 4-Methylumbelliferone (4-MU) and dextran sulfate were purchased from SIGMA-ALDRICH Corp. (St. Louis, MO, USA).
Patients and tissue sampling
Tissue specimens were collected from 16 PDAC patients who underwent surgical resection between 2013 and 2018 in our department. This study was approved by the ethical committee of our institution (University of Occupational and Environmental Health, Kitakyushu, Japan), and written informed consent was obtained from all patients. Frozen tissues were harvested from tumor and non-tumorous pancreata far from the tumor (confirmed under H&E staining) and minced into smaller pieces. The minced tissues were then homogenized by a homogenizer and processed for RNA extraction.
Quantitative real-time RT-PCR
Total RNA was isolated from cell lines and homogenized tissues using RNeasy Mini Kit (QIAGEN GmbH, Hilden, Germany) according to the manufacture’s protocol. First strand cDNA was synthesized from 1.0 μg of total RNA. Real-time mRNA expression analysis of HA-related genes (HAS2, HAS3, HYAL1, and KIAA1199) and a housekeeping gene (GAPDH) for control was performed using TaqMan@ Gene Expression Assays and Step One Plus real-time PCR system (Thermo Fisher Scientific Inc., Waltham, MA, USA) according to the manufacture’s instruction. The relative quantification was given by the Ct values, determining the reactions for target genes and an internal control gene in all samples.
Measurements of HA concentrations
Cells (1.0 × 10⁵ cells/ml) were cultured in a serum-free medium (RPMI1640 without FBS) for 48 hours and the culture medium was collected for measurements of HA concentrations. The concentration of total HA was measured using the Quantikine ELISA Hyaluronan Immunoassay (R&D Systems Inc., Minneapolis, MN, USA). Assays were triplicated and the average concentrations were determined.
Cell migration assay
The migratory ability of cells was determined by transwell cell migration assay using cell culture inserts equipped with a filter membrane containing 8 μm pores (BD Biosciences, Franklin Lajes NJ, USA). The lower chamber was filled with RPMI1640 containing 10% FBS. The upper chamber was filled with 2.0 × 10⁴ cells in the RPMI1640 containing 1% FBS. After 24 h incubation, the cells remaining on the upper side of the filters were removed. The cells on the bottom surface of the membrane were stained with hematoxylin and eosin and the number of cells that had migrated to the bottom surface of the membrane were counted in five randomly selected microscopic fields in each sample.
Statistical analysis
Statistical analyses were performed using SPSS statistical software version 24.0 (SPSS, Chicago, Illinois, USA). The correlation between expression of genes among PDAC cell lines was determined using Spearman’s rank correlation coefficient. Student’s t-test and Mann-Whitney U test were used for group comparison. Survival curves were constructed with Kaplan–Meier method and compared using the log-rank test. For univariate analysis of prognostic factors, we used Cox proportional hazard model. A P-value of < 0.05 was considered statistically significant.
ACKNOWLEDGMENTS
We thank Ms. Ueda for her excellent technical assistance.
Abbreviations
- PDAC
pancreatic ductal adenocarcinoma
- HA
hyaluronan
- HAMP
hyaluronan activated-metabolism phenotype
Author contributions
Yuzan Kudo and Shiro Kohi carried out experiments and analyzed data. Keiji Hirata, Michael Goggins, and Norihiro Sato summarized and interpreted data. Yuzan Kudo and Norihiro Sato wrote the manuscript. All authors approved the submission of this manuscript.
CONFLICTS OF INTEREST
The authors declare no financial conflict of interest.
FUNDING
This work was supported by JSPS KAKENHI Grant Number JP17K10714.
REFERENCES
- 1. Vincent A, Herman J, Schulick R, Hruban RH, Goggins M. Pancreatic cancer. Lancet. 2011; 378:607–620. 10.1016/S0140-6736(10)62307-0. [DOI] [PMC free article] [PubMed] [Google Scholar]
- 2. O'Hayer KM, Brody JR. Personalized therapy for pancreatic cancer: Do we need better targets, arrows, or both? Discov Med. 2016; 21:117–123. [PubMed] [Google Scholar]
- 3. Rowe RG, Weiss SJ. Navigating ECM barriers at the invasive front: the cancer cell-stroma interface. Annu Rev Cell Dev Biol. 2009; 25:567–595. 10.1146/annurev.cellbio.24.110707.175315. [DOI] [PubMed] [Google Scholar]
- 4. Whatcott CJ, Diep CH, Jiang P, Watanabe A, LoBello J, Sima C, Hostetter G, Shepard HM, Von Hoff DD, Han H. Desmoplasia in Primary Tumors and Metastatic Lesions of Pancreatic Cancer. Clin Cancer Res. 2015; 21:3561–3568. 10.1158/1078-0432.CCR-14-1051. [DOI] [PMC free article] [PubMed] [Google Scholar]
- 5. Cheng XB, Sato N, Kohi S, Yamaguchi K. Prognostic impact of hyaluronan and its regulators in pancreatic ductal adenocarcinoma. PLoS One. 2013; 8:e80765. 10.1371/journal.pone.0080765. [DOI] [PMC free article] [PubMed] [Google Scholar]
- 6. Sato N, Kohi S, Hirata K, Goggins M. Role of hyaluronan in pancreatic cancer biology and therapy: Once again in the spotlight. Cancer Sci. 2016; 107:569–575. 10.1111/cas.12913. [DOI] [PMC free article] [PubMed] [Google Scholar]
- 7. Toole BP. Hyaluronan: from extracellular glue to pericellular cue. Nat Rev Cancer. 2004; 4:528–539. 10.1038/nrc1391. [DOI] [PubMed] [Google Scholar]
- 8. Itano N, Kimata K. Mammalian hyaluronan synthases. IUBMB Life. 2002; 54:195–199. 10.1080/15216540214929. [DOI] [PubMed] [Google Scholar]
- 9. Stern R. Hyaluronan catabolism: a new metabolic pathway. Eur J Cell Biol. 2004; 83:317–325. 10.1078/0171-9335-00392. [DOI] [PubMed] [Google Scholar]
- 10. Yoshida H, Nagaoka A, Kusaka-Kikushima A, Tobiishi M, Kawabata K, Sayo T, Sakai S, Sugiyama Y, Enomoto H, Okada Y, Inoue S. KIAA1199, a deafness gene of unknown function, is a new hyaluronan binding protein involved in hyaluronan depolymerization. Proc Natl Acad Sci U S A. 2013; 110:5612–5617. 10.1073/pnas.1215432110. [DOI] [PMC free article] [PubMed] [Google Scholar]
- 11. Misra S, Hascall VC, Markwald RR, Ghatak S. Interactions between hyaluronan and its receptors (CD44, RHAMM) regulate the activities of inflammation and cancer. Front Immunol. 2015; 6:201. 10.3389/fimmu.2015.00201. [DOI] [PMC free article] [PubMed] [Google Scholar]
- 12. Wu M, Cao M, He Y, Liu Y, Yang C, Du Y, Wang W, Gao F. A novel role of low molecular weight hyaluronan in breast cancer metastasis. FASEB J. 2015; 29:1290–1298. 10.1096/fj.14-259978. [DOI] [PubMed] [Google Scholar]
- 13. Schmaus A, Klusmeier S, Rothley M, Dimmler A, Sipos B, Faller G, Thiele W, Allgayer H, Hohenberger P, Post S, Sleeman JP. Accumulation of small hyaluronan oligosaccharides in tumour interstitial fluid correlates with lymphatic invasion and lymph node metastasis. Br J Cancer. 2014; 111:559–567. 10.1038/bjc.2014.332. [DOI] [PMC free article] [PubMed] [Google Scholar]
- 14. Cheng XB, Kohi S, Koga A, Hirata K, Sato N. Hyaluronan stimulates pancreatic cancer cell motility. Oncotarget. 2016; 7:4829–4840. 10.18632/oncotarget.6617. [DOI] [PMC free article] [PubMed] [Google Scholar]
- 15. Sironen RK, Tammi M, Tammi R, Auvinen PK, Anttila M, Kosma VM. Hyaluronan in human malignancies. Exp Cell Res. 2011; 317:383–391. 10.1016/j.yexcr.2010.11.017. [DOI] [PubMed] [Google Scholar]
- 16. McAtee CO, Barycki JJ, Simpson MA. Emerging roles for hyaluronidase in cancer metastasis and therapy. Adv Cancer Res. 2014; 123:1–34. 10.1016/B978-0-12-800092-2.00001-0. [DOI] [PMC free article] [PubMed] [Google Scholar]
- 17. Koga A, Sato N, Kohi S, Yabuki K, Cheng XB, Hisaoka M, Hirata K. KIAA1199/CEMIP/HYBID overexpression predicts poor prognosis in pancreatic ductal adenocarcinoma. Pancreatology. 2017; 17:115–122. 10.1016/j.pan.2016.12.007. [DOI] [PubMed] [Google Scholar]
- 18. Kohi S, Sato N, Cheng XB, Koga A, Hirata K. Increased Expression of HYAL1 in Pancreatic Ductal Adenocarcinoma. Pancreas. 2016; 45:1467–1473. 10.1097/MPA.0000000000000670. [DOI] [PubMed] [Google Scholar]
- 19. Jones S, Zhang X, Parsons DW, Lin JC, Leary RJ, Angenendt P, Mankoo P, Carter H, Kamiyama H, Jimeno A, Hong SM, Fu B, Lin MT, et al. . Core signaling pathways in human pancreatic cancers revealed by global genomic analyses. Science. 2008; 321:1801–1806. 10.1126/science.1164368. [DOI] [PMC free article] [PubMed] [Google Scholar]
- 20. Csóka AB, Frost GI, Heng HH, Scherer SW, Mohapatra G, Stern R. The hyaluronidase gene HYAL1 maps to chromosome 3p21.2-p21.3 in human and 9F1-F2 in mouse, a conserved candidate tumor suppressor locus. Genomics. 1998; 48:63–70. 10.1006/geno.1997.5158. [DOI] [PubMed] [Google Scholar]
- 21. Michishita E, Garcés G, Barrett JC, Horikawa I. Upregulation of the KIAA1199 gene is associated with cellular mortality. Cancer Lett. 2006; 239:71–77. 10.1016/j.canlet.2005.07.028. [DOI] [PubMed] [Google Scholar]
- 22. Jiang NY, Woda BA, Banner BF, Whalen GF, Dresser KA, Lu D. Sp1, a new biomarker that identifies a subset of aggressive pancreatic ductal adenocarcinoma. Cancer Epidemiol Biomarkers Prev. 2008; 17:1648–1652. 10.1158/1055-9965.EPI-07-2791. [DOI] [PubMed] [Google Scholar]
- 23. Monslow J, Williams JD, Fraser DJ, Michael DR, Foka P, Kift-Morgan AP, Luo DD, Fielding CA, Craig KJ, Topley N, Jones SA, Ramji DP, Bowen T. Sp1 and Sp3 mediate constitutive transcription of the human hyaluronan synthase 2 gene. J Biol Chem. 2006; 281:18043–18050. 10.1074/jbc.M510467200. [DOI] [PubMed] [Google Scholar]
- 24. Wang S, Zhen L, Liu Z, Ai Q, Ji Y, Du G, Wang Y, Bu Y. Identification and analysis of the promoter region of the human HAS3 gene. Biochem Biophys Res Commun. 2015; 460:1008–1014. 10.1016/j.bbrc.2015.03.142. [DOI] [PubMed] [Google Scholar]
- 25. Sato N, Maitra A, Fukushima N, van Heek NT, Matsubayashi H, Iacobuzio-Donahue CA, Rosty C, Goggins M. Frequent hypomethylation of multiple genes overexpressed in pancreatic ductal adenocarcinoma. Cancer Res. 2003; 63:4158–4166. [PubMed] [Google Scholar]
- 26. Kohi S, Sato N, Cheng XB, Koga A, Higure A, Hirata K. A novel epigenetic mechanism regulating hyaluronan production in pancreatic cancer cells. Clin Exp Metastasis. 2016; 33:225–230. 10.1007/s10585-015-9771-9. [DOI] [PubMed] [Google Scholar]
- 27. Mahlamäki EH, Bärlund M, Tanner M, Gorunova L, Höglund M, Karhu R, Kallioniemi A. Frequent amplification of 8q24, 11q, 17q, and 20q-specific genes in pancreatic cancer. Genes Chromosomes Cancer. 2002; 35:353–358. 10.1002/gcc.10122. [DOI] [PubMed] [Google Scholar]
- 28. Adamia S, Maxwell CA, Pilarski LM. Hyaluronan and hyaluronan synthases: potential therapeutic targets in cancer. Curr Drug Targets Cardiovasc Haematol Disord. 2005; 5:3–14. 10.2174/1568006053005056. [DOI] [PubMed] [Google Scholar]
- 29. Kultti A, Pasonen-Seppänen S, Jauhiainen M, Rilla KJ, Kärnä R, Pyöriä E, Tammi RH, Tammi MI. 4-Methylumbelliferone inhibits hyaluronan synthesis by depletion of cellular UDP-glucuronic acid and downregulation of hyaluronan synthase 2 and 3. Exp Cell Res. 2009; 315:1914–1923. 10.1016/j.yexcr.2009.03.002. [DOI] [PubMed] [Google Scholar]
- 30. Kakizaki I, Kojima K, Takagaki K, Endo M, Kannagi R, Ito M, Maruo Y, Sato H, Yasuda T, Mita S, Kimata K, Itano N. A novel mechanism for the inhibition of hyaluronan biosynthesis by 4-methylumbelliferone. J Biol Chem. 2004; 279:33281–33289. 10.1074/jbc.M405918200. [DOI] [PubMed] [Google Scholar]
- 31. Nagy N, Kuipers HF, Frymoyer AR, Ishak HD, Bollyky JB, Wight TN, Bollyky PL. 4-methylumbelliferone treatment and hyaluronan inhibition as a therapeutic strategy in inflammation, autoimmunity, and cancer. Front Immunol. 2015; 6:123. 10.3389/fimmu.2015.00123. [DOI] [PMC free article] [PubMed] [Google Scholar]
- 32. Morohashi H, Kon A, Nakai M, Yamaguchi M, Kakizaki I, Yoshihara S, Sasaki M, Takagaki K. Study of hyaluronan synthase inhibitor, 4-methylumbelliferone derivatives on human pancreatic cancer cell (KP1-NL). Biochem Biophys Res Commun. 2006; 345:1454–1459. 10.1016/j.bbrc.2006.05.037. [DOI] [PubMed] [Google Scholar]
- 33. Hajime M, Shuichi Y, Makoto N, Masanori Y, Ikuko K, Atsushi K, Mutsuo S, Keiichi T. Inhibitory effect of 4-methylesculetin on hyaluronan synthesis slows the development of human pancreatic cancer in vitro and in nude mice. Int J Cancer. 2007; 120:2704–2709. 10.1002/ijc.22349. [DOI] [PubMed] [Google Scholar]
- 34. Roohbakhsh A, Iranshahy M, Iranshahi M. Glycyrrhetinic Acid and Its Derivatives: Anti-Cancer and Cancer Chemopreventive Properties, Mechanisms of Action and Structure- Cytotoxic Activity Relationship. Curr Med Chem. 2016; 23:498–517. 10.2174/0929867323666160112122256. [DOI] [PubMed] [Google Scholar]
- 35. Su X, Wu L, Hu M, Dong W, Xu M, Zhang P. Glycyrrhizic acid: A promising carrier material for anticancer therapy. Biomed Pharmacother. 2017; 95:670–678. 10.1016/j.biopha.2017.08.123. [DOI] [PubMed] [Google Scholar]
- 36. Kohi S, Sato N, Koga A, Hirata K, Harunari E, Igarashi Y. Hyaluromycin, a Novel Hyaluronidase Inhibitor, Attenuates Pancreatic Cancer Cell Migration and Proliferation. J Oncol. 2016; 2016:9063087. 10.1155/2016/9063087. [DOI] [PMC free article] [PubMed] [Google Scholar]


