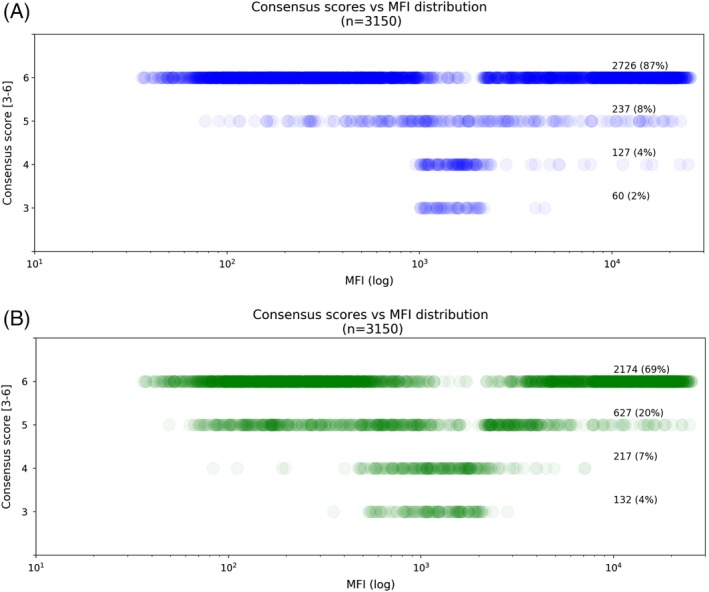
Figure 3.

Consensus scores vs MFI distribution. This figure shows the spread of MFI values (X axis) associated with consensus scores 3 to 6 (Y axis). Each circle represents a single specificity, and higher colour density indicates a larger number of circles in that area and vice versa. A, Consensus within HLA antibody specificities assigned from LabScreen SAB assays. The figure shows a bimodal distribution of specificities having a consensus score of 6 with high levels of consensus with low and high MFI values. The majority of specificities with lower levels of consensus are distributed around MFI range 1000 to 2000. B, Consensus within acceptable mismatches designations
